3450 29 Hwy · Cottonport, LA
Flood risk 1/10 · Minimal
- FEMA flood zone
- X
- Chance of flooding over 30 yrs
- 0.0%
- Est. flood insurance / yr
- $507 – $1,088
Fire risk 1/10 · Minimal
- Est. fire insurance / yr
- $1,269 – $2,357
Heat risk 8/10 · Major
- Hot days now (above 110°F)
- 7 days/yr
- Hot days in 30 yrs
- 19 days/yr
Wind risk 9/10 · Severe
- Chance of severe wind over 30 yrs
- 99.0%
Air-quality risk 1/10 · Minimal
- Unhealthy air days now
- 0 days/yr
- Unhealthy air days in 30 yrs
- 0 days/yr
Risk factors via First Street. Map © Google.
Why this score? — see what drove the D grade
The composite is a weighted blend of 9 inputs, each scored 0–100. Each bar is that input's sub-score; the figure is the points it added to the 100-point composite (weight × sub-score).
- Cash flow +12.7/30.0
- ARV discount +7.5/15.0
- Appreciation +6.2/10.0
- DSCR +3.8/10.0
- Livability +3.0/5.0
- 1% rule +2.5/10.0
- Rent growth +2.5/5.0
- Condition / age +2.5/5.0
- Schools +2.1/10.0
$149,900
🖨 Deal sheet (PDF) 📄 Offer letter ✓ Due diligence
Listing remarks
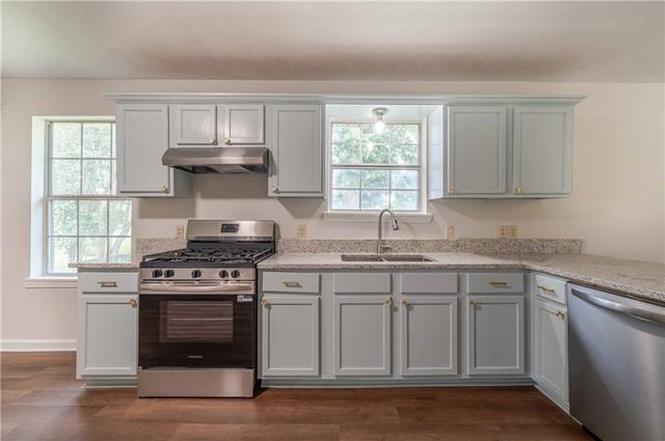
Welcome to peaceful country living in Evergreen! This completely updated 3-bedroom, 2.5-bath home offers the perfect blend of modern upgrades and relaxing rural charm. Move-in ready and thoughtfully remodeled from top to bottom, this home features a spacious layout designed for both everyday living and entertaining. Inside, you'll find beautiful granite countertops, a 5-burner gas stove, walk-in pantry, updated finishes throughout, and plenty of room to gather with family and friends. The fully remodeled interior provides a fresh, modern feel while still maintaining the warmth and comfort of home. Step outside and enjoy quiet mornings on the welcoming front porch or unwind in the evenings w
Key facts
- 5-burner gas stove
- Front porch
- Granite countertops
Tags
Property features AI
Exterior
- Home design: Single family residence
- Construction: Metal roof; Other construction materials
- Exterior features: Workshop; Acreage
Interior
- Kitchen: Dishwasher
- Bedrooms: Two bedrooms (Bedroom 1, Bedroom 2)
- Bathrooms: 2 full bathrooms; 1 half bathroom
- Heating & cooling: Central heating; Central air conditioning
- Interior features: Living Room; Dining Room; Bedroom 1; Bedroom 2
Neighborhood map
What this means for you Summary
Snapshot
- This is a 3-bed/2.5-bath single-family listed at $150k.
Deal economics
- At list price, monthly cash flow is $-17 ($-205/yr) — negative.
- To cash-flow at today's rent, offer at most $147k (2.0% below list).
- To meet the 1% rule (rent ≥ 1% of price), the offer needs to be $112k (25.3% below list).
- Recommended offer: $112k (25.3% below list) — sets the bar for 1% rule.
Location & tenants
- Location reads 59/100 on livability (#272 in LA) — a working-class tenant base; expect higher turnover. Strengths: cost of living A+, crime B; Watch: health & safety C-, amenities F, commute F.
- Avoyelles Parish (rural): math 22% / reading 30% proficiency, ranked #56 of 98 in LA (top 57%) — low school quality limits family demand, transient renter base, plan for 1-2y turnover; 75% free/reduced lunch — lower-income household profile, screen leases tightly.
- Zoned schools: Cottonport Elementary (math 8% / reading 17%, grade F, #550 of 646 statewide, top 88%, 318 students, 71% FRL); Bunkie Magnet High School (math 23% / reading 28%, grade F, #149 of 265 statewide, top 56%, 702 students, 52% FRL).
- Market conditions: 20 active listings in the ZIP; 15 units permitted in Avoyelles Parish in 2024 (0 in 5+ unit buildings).
Forward outlook
- In year one you build about $5k of equity ($1k loan paydown + $4k appreciation (2.4% local appreciation)).
- Avoyelles County population projected at -18% by 2050 — secular population decline; favor cash flow + early exit over multi-decade hold.
- At projected returns (2.4% appreciation + 3.0% rent growth), your $42k cash investment doubles in ~8 years — after that, you're playing with house money.
- By year 8, paydown + projected appreciation supports a ~$34k cash-out refi (75% LTV) — recoverable capital for the next deal without selling this one.
Negotiation context
- It's been on market 113 days — a 9% lower offer ($136k) is reasonable based on typical stale-listing flexibility.
- 5 sale attempts; this cycle's ask has dropped $19k (11%) from the opening price — seller is motivated, your offer sets the floor, not the list.
- Current owner paid $112k; 34% above their basis — modest negotiation headroom, anchor on the comps not their cost.
Risks & watch-outs
- Climate carrying-cost: severe wind risk, 99% chance of damaging wind over 30y; extreme-heat days projected 7→19/yr by 2055 (HVAC capex compounding) — expect insurance premiums to compound above CPI over the hold.
Questions for the listing agent
- What do current leases actually rent for vs. the listed asking? Can we see a recent rent roll and the last 12 months of T-12 income?
- It's been on market 113 days. Have you received any prior offers? Is the seller open to a 25% concession, seller financing, or rate buy-down credit?
- Built in 1975 — when were the roof, HVAC, electrical panel, plumbing, and water heater last replaced?
- Why hasn't it sold? Are there any deal-killer items the seller is aware of (foundation, flood, title, zoning, code violations)?
- Is there a deadline driving the sale (1031 exchange, divorce, estate, relocation)? That informs how much negotiation room exists.
- Schools are F-rated, which usually means shorter tenancies and higher turnover. Who's the typical renter profile here, and what's been the actual vacancy rate?
- The area grade is low — what's the realistic commute time and amenity access for the typical tenant pool here? Any planned neighborhood developments (good or bad) we should know about?
- What's the average days-on-market for RENTAL listings here right now (not sales)? A rising rental-DOM trend means longer vacancies and softer asking-rent achievability than the comps imply.
- What's the recent tenant-quality profile in this submarket — average credit score on applications, eviction rate, late-payment / NSF rate, and stable-employment percentage? A property-management company in the area should have these aggregated.
- How much new for-sale + rental construction is in the pipeline within 1–3 miles? Heavy new supply typically softens prices + rents 12–24 months out; constrained supply supports both.
Investment metrics
- 1% rule
- 0.75% ✗
- Cap rate
- 6.16%
- Cash-on-cash
- -0.49%
- DSCR
- 0.98
- GRM
- 11.2
CMA / ARV
No comps found within radius.
Projected returns pro-forma
2.35% appreciation · 3.0% rent growth · sell at horizon
- IRR
- 5.1%
- Equity multiple
- 1.28×
- Total profit
- $11,782
- Equity at exit
- $61,953
- IRR
- 8.4%
- Equity multiple
- 2.19×
- Total profit
- $49,945
- Equity at exit
- $91,438
Cash invested: $41,972 (down + closing). Projections, not guarantees.
Landlord ↔ Tenant lean methodology
- Overall (STATE)
- 90 Strongly Landlord-Friendly
- State Louisiana
- 90 Strongly Landlord-Friendly · R+12
- County
- — inherits STATE
- City
- — inherits STATE
ZIP-level market 71327
- Home prices YoY
- 2.6%
- Active inventory
- 20
- Price-to-rent
- 11.2×
Monthly cashflow live
- Estimated rent
- $1,120 medium interval (Pro) →
- Mortgage (P&I)
- −$786
- Tax from tax record
- −$53 /mo · $638/yr
- Insurance
- −$62
- HOA
- −$0
- Vacancy / Maint / Mgmt
- −$235
- Net cashflow
- $-17
Break-even live
Sensitivity live
| Price | -10% $68 | -5% $25 | +0% $-17 | +5% $-60 | +10% $-102 |
|---|---|---|---|---|---|
| Rent | -10% $-106 | -5% $-61 | +0% $-17 | +5% $27 | +10% $71 |
| Rate | -1.0pp $58 | -0.5pp $21 | base $-17 | +0.5pp $-56 | +1.0pp $-95 |
UW: 25.0% down · 7.5% · 30yr · 1.5% tax · 5.0% vac · 8.0% maint · 8.0% mgmt
Financing live
Cash to close
- Down payment
- $37,475
- Closing costs
- $4,497
- Reserves months
- —
- Total cash needed
- —
Loan-product check · same deal, 3 products live
Conventional
25% down · 7.5% · 30yr
- Down + closing
- —
- Monthly P&I
- —
- Monthly cashflow
- —
- DSCR
- —
- Eligible?
- —
Personal DTI + credit; lowest rate.
DSCR
20% down · 8.5% · 30yr
- Down + closing
- —
- Monthly P&I
- —
- Monthly cashflow
- —
- DSCR
- —
- Eligible?
- —
No personal income docs; deal must DSCR.
Hard money
10% down · 12.0% · 12mo
- Down + closing
- —
- Monthly P&I
- —
- Monthly cashflow
- —
- DSCR
- —
- Eligible?
- —
Short-term bridge; refi at stabilization.
Listing history 14 events
-
2026-05-21status Pending
-
2026-05-08status Active
-
2026-04-16status Pending
-
2026-03-25price $149,900
-
2026-03-09price $159,000
-
2026-02-03price $164,000
-
2026-01-06$169,000 Active
-
2025-09-22price $171,000
-
2025-08-15price $175,000
-
2025-07-31$180,000 Active
-
2025-07-31$171,000 Active
-
2025-04-14$89,900 Active
-
2020-09-28soldstatus $112,000
-
2004-03-05soldstatus
ⓘ Source: listings_history table (triggers on properties + properties_extension) + one-shot
backfill from property_details.listing_events for pre-trigger history.
Tax reassessment forecast LA · Resets to sale price
- Current annual tax
- $638 · $53/mo
- Projected year-2 tax
- $824 · $69/mo
- Expected delta
- +$187/yr (+$16/mo · 29.3%)
ⓘ Screening estimate from a state-policy table — verify with the county assessor before closing.
Climate risk First Street
- Flood 1/10 Low FEMA zone X · 0% chance over 30 yrs
- Wildfire 1/10 Low
- Heat 8/10 Severe 7 d/yr ≥110°F today · 19 d/yr by 30 yrs out
- Wind 9/10 Extreme 99% chance of damaging wind over 30 yrs
- Air quality 1/10 Low 0 unhealthy d/yr today · 0 by 30 yrs out
Nearby sold comps map
Loading sold comps map…
Walkable amenities ~0.75 mi
Loading nearby amenities…
Taxation est. · year 1
- Rental income
- $13,437
- − Mortgage interest
- −$8,397
- − Property taxes
- −$638
- − Insurance
- −$750
- − Repairs & maintenance
- −$1,075
- − Management
- −$1,075
- − Depreciation
- −$4,361
- Taxable loss
- −$2,857
- Est. tax savings @ 24.0%
- +$686
- After-tax cash flow
- $481/yr
For passive investors: Depreciation is non-cash, so a rental often shows a tax loss while cash-flowing — sheltering income. Rental losses are passive: they offset passive income freely, and up to $25,000/yr can offset ordinary (W-2) income if you actively participate and your MAGI is under $100k (phasing out to $0 by $150k); unused losses carry forward. On sale, claimed depreciation is recaptured at up to 25%, and gains may owe capital-gains tax (a 1031 exchange can defer both). Figures are a year-1 estimate at your 24.0% rate — not tax advice; consult a CPA.
Schools (NCES district)
- District
- Avoyelles Parish
- NCES district ID
- 2200150
- Math proficiency
- 22% ▼ -32.00%
- Reading proficiency
- 30% ▼ -29.00%
- Median HH income
- $33,891
- Composite
- 21.32/100
- National rank
- #8378
- State rank
- #56 of 98 in LA
Livability — Cottonport
- Score
- 59/100
- State rank
- #272
- US rank
- #19797
Category grades
Schools grade is shown separately in the Schools card above.
Census & demographics
- Population (ZIP)
- 6,100
Population outlook (Avoyelles County) Hauer SSP2
- Today (2025)
- 39,084 people
- By 2030
- 37,784 · -3.3%
- By 2040
- 35,049 · -10.3%
- By 2050
- 32,225 · -17.5%
- By 2075
- 25,695 · -34.3%
- By 2100
- 18,985 · -51.4%
Race, ethnicity, and origin ACS 2023
- Neighborhood character
- Diverse neighborhood (Simpson 0.59)
- Race & ethnicity
- White 49% Black 40% Hispanic / Latino 5% Two or more races 5%
- Hispanic origin (detail)
- Mexican 3%
- Common ancestry
- Lithuanian 13% Italian 3%
- Foreign-born
- 2% · Canada
- Languages at home
- 92% English-only · Spanish 4% French/Haitian/Cajun 3% Other Indo-European 1%
Political lean MEDSL · Avoyelles
- 2024 margin
- Solid R (+43.1) · D 27.8% · R 71.0% · Other 1.2%
- 2008→2024 swing
- -20.1pp toward R · 2008: -23.1pp · 2024: -43.1pp
- All cycles
- 2024: R+43.1 2020: R+40.8 2016: R+37.0 2012: R+27.0 2008: R+23.1
Not yet ingested
- Civics
- —
Market trends
- HPI YoY
- ▲ 2.35%
- Current HPI
- 92.0693
- Rent YoY
- —
- Metro
- —
- State GDP YoY
- ▲ 3.29%
- F500 in state
- 10
Industry mix (Fortune 500 HQ in LA)
| Industry | F500 HQs | Revenue |
|---|---|---|
| Telecommunications | 2 | $23B |
|
||
| Utilities | 1 | $12B |
|
||
| Wholesale / Distribution | 1 | $5B |
|
||
| Advertising | 1 | $2B |
|
||
Price history
+33.8% since first listed14 events — show timeline
- 2026-05-21 Pending — AcadianaMLS
- 2026-05-08 Relisted — AcadianaMLS
- 2026-04-16 Pending — AcadianaMLS
- 2026-03-25 Price Changed $149,900 AcadianaMLS
- 2026-03-09 Price Changed $159,000 AcadianaMLS
- 2026-02-03 Price Changed $164,000 AcadianaMLS
- 2026-01-06 Listed $169,000 AcadianaMLS
- 2025-09-22 Price Changed $171,000 AcadianaMLS
- 2025-08-15 Price Changed $175,000 AcadianaMLS
- 2025-07-31 Listed $171,000 AcadianaMLS
- 2025-07-31 Listed $180,000 AcadianaMLS
- 2025-04-14 Listed $89,900 AcadianaMLS
- 2020-09-28 Sold (Public Records) $112,000 Public Records
- 2004-03-05 Sold (Public Records) — Public Records
Property tax history
+7.3%/yrLatest (2025): $638 · -3.7% YoY. Source: county tax records.
Cash-flow waterfall
monthlySold comps — $/sqft
last 12 mo · ≤1 miLoading sold comps…