5901 Newbrook Cir #8 · Riverbank, CA
Flood risk 1/10 · Minimal
- FEMA flood zone
- X (unshaded)
- Chance of flooding over 30 yrs
- 0.0%
- Est. flood insurance / yr
- $507 – $1,088
Fire risk 7/10 · Major
- Est. fire insurance / yr
- $659 – $1,223
Heat risk 7/10 · Major
- Hot days now (above 102°F)
- 7 days/yr
- Hot days in 30 yrs
- 15 days/yr
Wind risk 1/10 · Minimal
- Chance of severe wind over 30 yrs
- —
Air-quality risk 10/10 · Severe
- Unhealthy air days now
- 36 days/yr
- Unhealthy air days in 30 yrs
- 39 days/yr
Risk factors via First Street. Map © Google.
Why this score? — see what drove the B+ grade
The composite is a weighted blend of 9 inputs, each scored 0–100. Each bar is that input's sub-score; the figure is the points it added to the 100-point composite (weight × sub-score).
- Cash flow +30.0/30.0
- ARV discount +15.0/15.0
- 1% rule +10.0/10.0
- DSCR +10.0/10.0
- Schools +4.4/10.0
- Livability +2.9/5.0
- Rent growth +2.5/5.0
- Condition / age +2.5/5.0
- Appreciation +0.0/10.0
$115,000
🖨 Deal sheet 📄 Offer letter ✓ Due diligence
Listing remarks
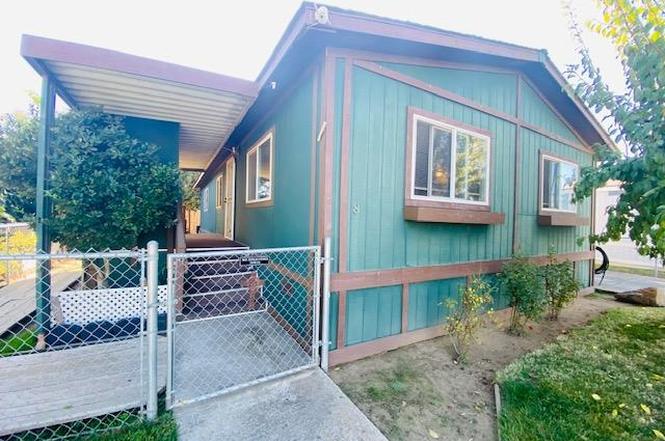
Charming 3-Bedroom Home in Quail Meadows Family Park - Riverbank, CA. Welcome to this lovely 3-bedroom, 2-bath mobile home located in the desirable Quail Meadows Family Park in the beautiful city of Riverbank, CA. Offering 1,152 sq. ft. of comfortable living space, this home features a spacious layout perfect for families or first-time homebuyers. Enjoy a nicely maintained front and backyard, complete with several fruit trees nectarine, plum, apricot, and peach plus a convenient storage shed. The extended driveway accommodates 3-4 vehicles, and there is an additional parking space located directly in front of the home. This well-kept property is move-in ready and waiting for its next homeow
Key facts
- Extended driveway
- Several fruit trees
- 3 parking spots
Tags
Property features AI
Finance
- Other: Located at 5901 Newbrook Cir #8, Riverbank, CA 95367
- Financial info: Land lease: No
- HOA & community: No homeowners association; Not a senior community
Exterior
- Parking: Attached parking
- Utilities: Public water; Public sewer; 220 volts available in laundry
- Home design: Manufactured home located in a park; Double-wide; Built in 1988
- Construction: Composition roof; Wood skirting; Fleetwood manufactured home
- Exterior features: Backyard; Fenced yard; Front yard
Interior
- Kitchen: Island; Wood countertops; Hood over range; Dishwasher; Microwave; Ice maker
- Bedrooms: 3 bedrooms
- Flooring: Carpet; Laminate; Tile; Wood
- Bathrooms: 2 full bathrooms; Tubs with showers
- Heating & cooling: Central heating; Central air conditioning
- Interior features: Open beam ceiling in living area; Porch; Pets allowed
- Laundry & utility: Washer and dryer included; Laundry hookups available; Interior laundry room; 220V outlet in laundry
Neighborhood map
What this means for you Summary
Snapshot
- This is a 3-bed/2.0-bath manufactured listed at $115k.
Deal economics
- At list price, monthly cash flow is $1k ($13k/yr) — positive.
- The deal already cash-flows at list — no discount required.
- Meets the 1% rule at list price ($2k rent vs $115k).
- Recommended offer: $101k (12.0% below list) — sets the bar for market timing.
- Cap rate 17.7% vs local median 3.0% in Riverbank — top-decile yield for the area; either an underpriced asset or a hidden risk that comps aren't pricing in. Stress-test before assuming the spread holds.
Location & tenants
- Location reads 57/100 on livability (#757 in CA) — a working-class tenant base; expect higher turnover. Strengths: housing A+, crime B+, employment B; Watch: schools F, amenities D-, commute F.
- Sylvan Union Elementary (urban): math 44% / reading 52% proficiency, ranked #457 of 1,400 in CA (top 33%) — families likely to look elsewhere, expect single-tenant / working-renter base with shorter leases.
- Market conditions: 123 active listings in the ZIP; 1 comparable units currently listed for rent nearby; solid renter incomes; 923 units permitted in Stanislaus County in 2024 (63 in 5+ unit buildings).
- This rent runs 33% of the median local income ($87k/yr) — at the standard rent-burdened threshold; future hikes will face affordability resistance.
Forward outlook
- Local home prices are declining (-3.0%/yr); year-one equity from $795 of loan paydown is wiped out by about $3k of value loss. Plan a longer hold.
- Stanislaus County population projected at +14% by 2050 — modest demand growth; plan on rents tracking national, not racing it.
- At projected returns (-3.0% appreciation + 3.0% rent growth), your $32k cash investment doubles in ~3 years — after that, you're playing with house money.
Negotiation context
- It's been on market 204 days — a 12% lower offer ($101k) is reasonable based on typical stale-listing flexibility.
Risks & watch-outs
- Climate carrying-cost: major wildfire risk; extreme-heat days projected 7→15/yr by 2055 (HVAC capex compounding) — expect insurance premiums to compound above CPI over the hold.
Questions for the listing agent
- It's been on market 204 days. Have you received any prior offers? Is the seller open to a 12% concession, seller financing, or rate buy-down credit?
- Why hasn't it sold? Are there any deal-killer items the seller is aware of (foundation, flood, title, zoning, code violations)?
- Is there a deadline driving the sale (1031 exchange, divorce, estate, relocation)? That informs how much negotiation room exists.
- Schools are F-rated, which usually means shorter tenancies and higher turnover. Who's the typical renter profile here, and what's been the actual vacancy rate?
- What's the average days-on-market for RENTAL listings here right now (not sales)? A rising rental-DOM trend means longer vacancies and softer asking-rent achievability than the comps imply.
- What's the recent tenant-quality profile in this submarket — average credit score on applications, eviction rate, late-payment / NSF rate, and stable-employment percentage? A property-management company in the area should have these aggregated.
- How much new for-sale + rental construction is in the pipeline within 1–3 miles? Heavy new supply typically softens prices + rents 12–24 months out; constrained supply supports both.
Investment metrics
- 1% rule
- 2.08% ✓
- Cap rate
- 17.67%
- Cash-on-cash
- 40.65%
- DSCR
- 2.81
- GRM
- 4.0
CMA / ARV
- ARV (on-the-fly)
- $141,696
- Comps found
- 5
Show comp detail 5 sales within ~0.75 mi
| Address | Dist | Beds/Ba | Sqft | Sold | Price | $/sf | Match |
|---|---|---|---|---|---|---|---|
| 5901 Newbrook Dr #78 | 0.15mi | 3/2.0 | 1,128 (-2%) | 2mo | $139,000 | $123 | 88 |
| 5901 Newbrook Cir | 0.04mi | 3/2.0 | 1,152 (0%) | 17mo | $105,000 | $91 | 84 |
| 5901 Newbrook Cir #28 | 0.13mi | 3/2.0 | 1,100 (-4%) | 3mo | $135,000 | $123 | 83 |
| 5901 Newbrook Cir #112 | 0.13mi | 3/2.0 | 1,152 (0%) | 13mo | $155,000 | $135 | 83 |
| 5901 Newbrook Cir #45 | 0.15mi | 2/2.0 (-1) | 992 (-14%) | 21mo | $130,000 | $131 | 48 |
Match score weights: distance 35% · size 25% · config 20% · recency 20%. Top-matched comps best support the ARV.
Projected returns pro-forma
-3.0% appreciation · 3.0% rent growth · sell at horizon
- IRR
- 37.1%
- Equity multiple
- 2.58×
- Total profit
- $50,872
- Equity at exit
- $17,147
- IRR
- 43.7%
- Equity multiple
- 5.16×
- Total profit
- $133,899
- Equity at exit
- $9,943
Cash invested: $32,200 (down + closing). Projections, not guarantees.
Landlord ↔ Tenant lean methodology
- Overall (STATE)
- 18 Strongly Tenant-Friendly
- State California
- 18 Strongly Tenant-Friendly · D+13
- County
- — inherits STATE
- City
- — inherits STATE
ZIP-level market 95367
- Active inventory
- 123
- Price-to-rent
- 4.0×
Monthly cashflow live
- Estimated rent
- $2,387 medium interval (Pro) →
- Mortgage (P&I)
- −$603
- Tax est. 1.5%
- −$144 /mo · $1,725/yr
- Insurance
- −$48
- HOA
- −$0
- Vacancy / Maint / Mgmt
- −$501
- Net cashflow
- $1,091
Break-even live
UW: 25.0% down · 7.5% · 30yr · 1.5% tax · 5.0% vac · 8.0% maint · 8.0% mgmt
Financing live
Cash to close
- Down payment
- $28,750
- Closing costs
- $3,450
- Reserves months
- —
- Total cash needed
- —
Loan-product check · same deal, 3 products live
Conventional
25% down · 7.5% · 30yr
- Down + closing
- —
- Monthly P&I
- —
- Monthly cashflow
- —
- DSCR
- —
- Eligible?
- —
Personal DTI + credit; lowest rate.
DSCR
20% down · 8.5% · 30yr
- Down + closing
- —
- Monthly P&I
- —
- Monthly cashflow
- —
- DSCR
- —
- Eligible?
- —
No personal income docs; deal must DSCR.
Hard money
10% down · 12.0% · 12mo
- Down + closing
- —
- Monthly P&I
- —
- Monthly cashflow
- —
- DSCR
- —
- Eligible?
- —
Short-term bridge; refi at stabilization.
Rent comps 1 comps
| Address | Beds | Baths | Sqft | Rent | $/sqft | DOM | Units | Dist |
|---|---|---|---|---|---|---|---|---|
| 2918 Stanislaus St Riverbank, CA | 3.0 | 2.0 | 971 | $1,950 | $2.01 | 13d | 1 | 0.82mi |
Listing history 11 events
-
2026-06-13statusdays on market $115,000 Pending 204 DOM
-
2026-06-10days on market $115,000 Active 202 DOM
-
2026-06-09days on market $115,000 Active 201 DOM
-
2026-06-08days on market $115,000 Active 200 DOM
-
2026-06-07days on market $115,000 Active 199 DOM
-
2026-06-05days on market $115,000 Active 196 DOM
-
2026-06-03days on market $115,000 Active 195 DOM
-
2026-06-02days on market $115,000 Active 194 DOM
-
2026-06-01days on market $115,000 Active 193 DOM
-
2026-05-31days on market $115,000 Active 192 DOM
-
2026-05-30days on market $115,000 Active 191 DOM
ⓘ Source: listings_history table (triggers on properties + properties_extension) + one-shot
backfill from property_details.listing_events for pre-trigger history.
Climate risk First Street
- Flood 1/10 Low FEMA zone X (unshaded) · 0% chance over 30 yrs
- Wildfire 7/10 Severe
- Heat 7/10 Severe 7 d/yr ≥102°F today · 15 d/yr by 30 yrs out
- Wind 1/10 Low
- Air quality 10/10 Extreme 36 unhealthy d/yr today · 39 by 30 yrs out
Nearby sold comps map
Loading sold comps map…
Walkable amenities ~0.75 mi
Loading nearby amenities…
Taxation est. · year 1
- Rental income
- $28,640
- − Mortgage interest
- −$6,442
- − Property taxes
- −$1,725
- − Insurance
- −$575
- − Repairs & maintenance
- −$2,291
- − Management
- −$2,291
- − Depreciation
- −$3,345
- Taxable income
- $11,971
- Est. tax owed @ 24.0%
- −$2,873
- After-tax cash flow
- $10,216/yr
For passive investors: Depreciation is non-cash, so a rental often shows a tax loss while cash-flowing — sheltering income. Rental losses are passive: they offset passive income freely, and up to $25,000/yr can offset ordinary (W-2) income if you actively participate and your MAGI is under $100k (phasing out to $0 by $150k); unused losses carry forward. On sale, claimed depreciation is recaptured at up to 25%, and gains may owe capital-gains tax (a 1031 exchange can defer both). Figures are a year-1 estimate at your 24.0% rate — not tax advice; consult a CPA.
Schools (NCES district)
- District
- Sylvan Union Elementary
- NCES district ID
- 0638670
- Math proficiency
- 44% ▲ 2.00%
- Reading proficiency
- 52% ▬ 0.00%
- Median HH income
- $61,181
- Composite
- 44.28/100
- National rank
- #6167
- State rank
- #457 of 1400 in CA
Livability — Riverbank
- Score
- 57/100
- State rank
- #757
- US rank
- #22107
Category grades
Schools grade is shown separately in the Schools card above.
Census & demographics
- Census place
- Riverbank, CA
- County
- Stanislaus County · 445,786 people
- City population
- 25,593
- Metro
- Modesto, CA
- Population (ZIP)
- 25,593
- Household income
- $87,487
- Rent vs Own
- Severe rent burden
- 615.0
Population outlook (Stanislaus County) Hauer SSP2
- Today (2025)
- 579,493 people
- By 2030
- 598,000 · +3.2%
- By 2040
- 630,930 · +8.9%
- By 2050
- 658,300 · +13.6%
- By 2075
- 712,363 · +22.9%
- By 2100
- 719,805 · +24.2%
Race, ethnicity, and origin ACS 2023
- Neighborhood character
- Diverse neighborhood (Simpson 0.55)
- Race & ethnicity
- Hispanic / Latino 59% White 31% Two or more races 29% Asian 5% Native American 2% Black 2%
- Hispanic origin (detail)
- Mexican 55% Puerto Rican 2%
- Common ancestry
- Lithuanian 2% Russian 2% Iranian 1%
- Foreign-born
- 21% · Canada, China
- Languages at home
- 50% English-only · Spanish 43% Tagalog/Filipino 2% Vietnamese 1%
Political lean MEDSL · Stanislaus
- 2024 margin
- R (+11.0) · D 43.2% · R 54.2% · Other 2.6%
- 2008→2024 swing
- -12.7pp toward R · 2008: 1.7pp · 2024: -11.0pp
- All cycles
- 2024: R+11.0 2020: D+0.8 2016: D+0.6 2012: D+0.7 2008: D+1.7
Not yet ingested
- Civics
- —
Market trends
- HPI YoY
- ▼ -218.95%
- Current HPI
- 310.4493
- Rent YoY
- —
- Metro
- Modesto, CA
- State GDP YoY
- ▲ 3.21%
- F500 in state
- 116
Industry mix (Fortune 500 HQ in CA)
| Industry | F500 HQs | Revenue |
|---|---|---|
| Technology | 27 | $1,492B |
|
||
| Financial Services | 3 | $174B |
|
||
| Retail | 3 | $44B |
|
||
| Insurance | 3 | $26B |
|
||
| Media / Entertainment | 2 | $115B |
|
||
| Pharmaceuticals / Biotech | 2 | $62B |
|
||
Cash-flow waterfall
monthlySold comps — $/sqft
last 12 mo · ≤1 miLoading sold comps…