688 Vista Lago Cir · Palm Desert, CA
Flood risk 1/10 · Minimal
- FEMA flood zone
- X (unshaded)
- Chance of flooding over 30 yrs
- 0.0%
- Est. flood insurance / yr
- $507 – $1,088
Fire risk 4/10 · Minor
- Est. fire insurance / yr
- $659 – $1,223
Heat risk 9/10 · Severe
- Hot days now (above 114°F)
- 5 days/yr
- Hot days in 30 yrs
- 14 days/yr
Wind risk 1/10 · Minimal
- Chance of severe wind over 30 yrs
- —
Air-quality risk 4/10 · Minor
- Unhealthy air days now
- 5 days/yr
- Unhealthy air days in 30 yrs
- 7 days/yr
Risk factors via First Street. Map © Google.
Why this score? — see what drove the D- grade
The composite is a weighted blend of 9 inputs, each scored 0–100. Each bar is that input's sub-score; the figure is the points it added to the 100-point composite (weight × sub-score).
- Cash flow +13.1/30.0
- 1% rule +6.4/10.0
- ARV discount +4.9/15.0
- DSCR +3.9/10.0
- Schools +3.8/10.0
- Livability +2.6/5.0
- Condition / age +2.5/5.0
- Rent growth +2.4/5.0
- Appreciation +0.0/10.0
$429,000
🖨 Deal sheet (PDF) 📄 Offer letter ✓ Due diligence
Listing remarks MLS
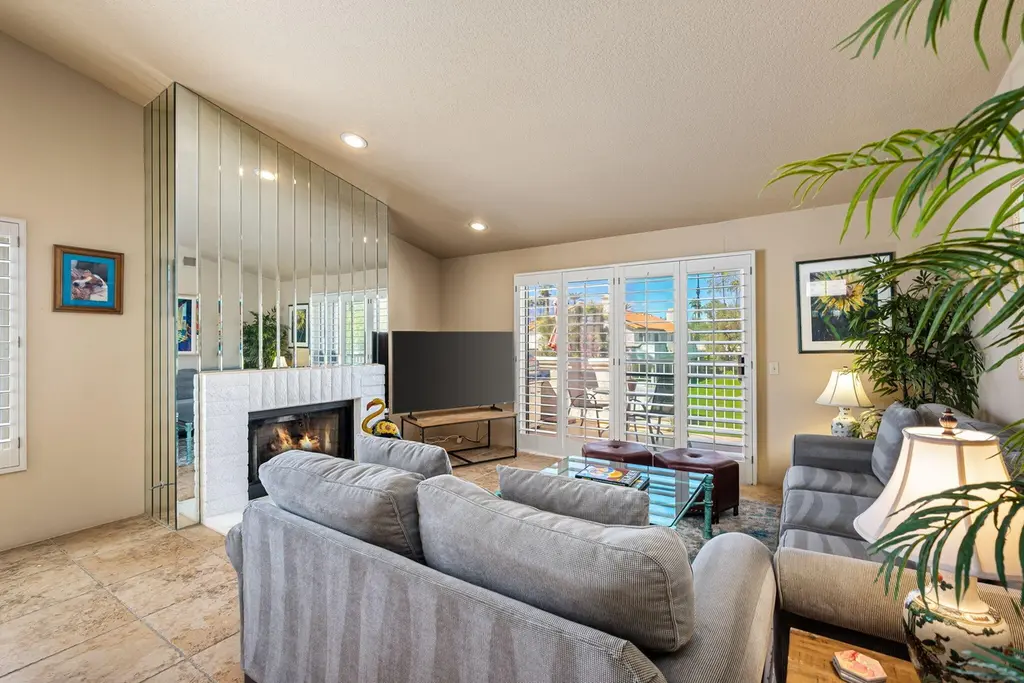
Very clean and well maintained upper level villa. Three bedrooms, two baths + powder room, in a spacious 1,814 SF. Home features high ceilings, walk-in closets, kitchen nook, large balcony over looking greenbelt and pool, with mountain views and a two car garage. Unit is well priced and furnished!
Key facts
- Furnished home
- Tennis
- Pickleball
Tags
Property features AI
Finance
- Other: Managed by Desert Falls Villas; Complex contains approximately 1,000 units; Planned urban development; Directions: Enter at gate on Country Club Dr, 1111 Desert Falls Parkway
- Financial info: Listing terms: Cash or Conventional
- HOA & community: Desert Falls Villas community management; Monthly HOA dues ($891); HOA amenities include clubhouse, fitness center, gated community with guard, golf, community pool and spa, and tennis; Association fees include clubhouse access; Call for association pet rules; pets permitted
Exterior
- Parking: Two covered parking spaces; Two-car garage; Guest parking onsite
- Security: Gated community with 24-hour guard
- Utilities: Public/district water; Sewer in street; Electric service available
- Home design: Residential condominium, attached; Two total floors in building; unit on second floor; Faces west; One-level living within the unit
- Construction: Hard coat stucco exterior; Lot level/flat
- Exterior features: Balcony; End unit; Sliding glass doors; Exterior security lights; Landscaped grounds; Street lighting and paved/asphalt streets; Greenbelt location; Mountain and greenbelt views
Interior
- Kitchen: Built-in and freestanding cooking appliances; Microwave; Free-standing electric range/oven; Range hood; Formica counters; Dishwasher; Garbage disposal; Refrigerator
- Bedrooms: Balcony access from living/bed (second floor entry noted)
- Flooring: Ceramic tile floors
- Bathrooms: Two full bathrooms; One half bathroom; Shower stall; Linen closet; Double vanity(s)
- Heating & cooling: Central heat; Central A/C
- Interior features: High ceilings (9 feet+); Furnished; Foyer entry; Double-pane windows with plantation shutters and screens; Built-ins; Vented exhaust fan; Cable TV
- Laundry & utility: Washer and dryer in unit; Electric dryer hookup
Neighborhood map
What this means for you Summary
Snapshot
- This is a 3-bed/2.5-bath condo listed at $429k.
Deal economics
- At list price, monthly cash flow is $-14 ($-170/yr) — negative.
- To cash-flow at today's rent, offer at most $426k (0.6% below list).
- Meets the 1% rule at list price ($5k rent vs $429k).
- Recommended offer: $426k (0.6% below list) — sets the bar for cash-flow.
- Cap rate 6.3% vs local median 3.5% in Palm Desert — top-decile yield for the area; either an underpriced asset or a hidden risk that comps aren't pricing in. Stress-test before assuming the spread holds.
Location & tenants
- Location reads 51/100 on livability (#1,050 in CA) — a working-class tenant base; expect higher turnover. Strengths: schools A-, employment B+, housing B; Watch: crime D, amenities F, commute F.
- Desert Sands Unified (suburban): math 31% / reading 56% proficiency, ranked #199 of 517 in CA (top 38%) — families likely to look elsewhere, expect single-tenant / working-renter base with shorter leases.
- Market conditions: Rents soft (-0.3%/yr); 635 active listings in the ZIP; 40 comparable units currently listed for rent nearby; rentals lingering (median 45d on market — plan ~5-8 weeks vacancy on turnover, expect pricing pressure); 75% of comp listings sitting > 30 days — soft ceiling on asking rent; solid renter incomes; 9,195 units permitted in Riverside County in 2024 (1,512 in 5+ unit buildings).
- At $4,870/mo this rent would consume 66% of the median local household income ($88k/yr) (locally 1181% of renters already pay >50% of income on rent) — very limited rent-growth headroom before tenants either downsize or default.
Forward outlook
- Local home prices are declining (-3.0%/yr); year-one equity from $3k of loan paydown is wiped out by about $13k of value loss. Plan a longer hold.
- Riverside County population projected at +22% by 2050 — long-run rental-demand tailwind backs the buy-and-hold thesis.
Negotiation context
- Only 6 days on market — expect competitive offers; lowballing is unlikely to land.
- 5 sale attempts since 22y ago with the ask held roughly flat each time — persistent listings suggest the price (not the market) is what's stuck; bring a comps-based counter.
Risks & watch-outs
- Climate carrying-cost: extreme-heat days projected 5→14/yr by 2055 (HVAC capex compounding) — expect insurance premiums to compound above CPI over the hold.
Questions for the listing agent
- What do current leases actually rent for vs. the listed asking? Can we see a recent rent roll and the last 12 months of T-12 income?
- What does the HOA fee cover, when was the last increase, and are there any pending special assessments or reserve-fund shortfalls?
- Any open or pending special assessments — roof, HVAC, plumbing, elevator, façade? What's the per-unit balance and payoff schedule, and is the seller paying it off at close or rolling it to the buyer?
- Is there a deadline driving the sale (1031 exchange, divorce, estate, relocation)? That informs how much negotiation room exists.
- Schools are A-rated — typically a magnet for longer-tenancy family renters. What's the average tenant stay here, and is there a school-zone premium baked into asking?
- Crime grade is D in this area — have there been break-ins, vandalism, or insurance claims at this property in the last 3 years? What carrier currently insures it and at what premium?
- The area grade is low — what's the realistic commute time and amenity access for the typical tenant pool here? Any planned neighborhood developments (good or bad) we should know about?
- What's the average days-on-market for RENTAL listings here right now (not sales)? A rising rental-DOM trend means longer vacancies and softer asking-rent achievability than the comps imply.
- What's the recent tenant-quality profile in this submarket — average credit score on applications, eviction rate, late-payment / NSF rate, and stable-employment percentage? A property-management company in the area should have these aggregated.
- How much new apartment / multifamily construction is in the pipeline within 1–3 miles? Heavy new supply (>2% of stock underway) typically softens rents 12–24 months out; light construction supports rent growth.
Investment metrics
- 1% rule
- 1.14% ✓
- Cap rate
- 6.25%
- Cash-on-cash
- -0.14%
- DSCR
- 0.99
- GRM
- 7.3
CMA / ARV
- ARV (median comp)
- $405,229
- List price
- $429,000
- Delta
- 8.33%
- Verdict
- FAIR
- Comps
- 20 within 1.0 mi
Projected returns pro-forma
-3.0% appreciation · 0.0% rent growth · sell at horizon
- IRR
- -20.9%
- Equity multiple
- 0.30×
- Total profit
- $-84,067
- Equity at exit
- $63,965
- IRR
- -27.2%
- Equity multiple
- -0.06×
- Total profit
- $-126,984
- Equity at exit
- $37,092
Cash invested: $120,120 (down + closing). Projections, not guarantees.
Landlord ↔ Tenant lean methodology
- Overall (STATE)
- 18 Strongly Tenant-Friendly
- State California
- 18 Strongly Tenant-Friendly · D+13
- County
- — inherits STATE
- City
- — inherits STATE
ZIP-level market 92211
- Rents YoY
- -0.3%
- Active inventory
- 635
- Price-to-rent
- 7.3×
Monthly cashflow live
- Estimated rent
- $4,870 high interval (Pro) →
- Mortgage (P&I)
- −$2,250
- Tax from tax record
- −$542 /mo · $6,502/yr
- Insurance
- −$179
- HOA
- −$891
- Vacancy / Maint / Mgmt
- −$1,023
- Net cashflow
- $-14
Break-even live
Sensitivity live
| Price | -10% $229 | -5% $107 | +0% $-14 | +5% $-136 | +10% $-257 |
|---|---|---|---|---|---|
| Rent | -10% $-399 | -5% $-207 | +0% $-14 | +5% $178 | +10% $371 |
| Rate | -1.0pp $202 | -0.5pp $95 | base $-14 | +0.5pp $-125 | +1.0pp $-238 |
UW: 25.0% down · 7.5% · 30yr · 1.5% tax · 5.0% vac · 8.0% maint · 8.0% mgmt
Financing live
Cash to close
- Down payment
- $107,250
- Closing costs
- $12,870
- Reserves months
- —
- Total cash needed
- —
Loan-product check · same deal, 3 products live
Conventional
25% down · 7.5% · 30yr
- Down + closing
- —
- Monthly P&I
- —
- Monthly cashflow
- —
- DSCR
- —
- Eligible?
- —
Personal DTI + credit; lowest rate.
DSCR
20% down · 8.5% · 30yr
- Down + closing
- —
- Monthly P&I
- —
- Monthly cashflow
- —
- DSCR
- —
- Eligible?
- —
No personal income docs; deal must DSCR.
Hard money
10% down · 12.0% · 12mo
- Down + closing
- —
- Monthly P&I
- —
- Monthly cashflow
- —
- DSCR
- —
- Eligible?
- —
Short-term bridge; refi at stabilization.
Rent comps 40 comps
| Address | Beds | Baths | Sqft | Rent | $/sqft | DOM | Units | Dist |
|---|---|---|---|---|---|---|---|---|
| 709 Vista Lago Cir N Palm Desert, CA | 2.0 | 2.0 | 1360 | $2,700 | $1.99 | 45d | 1 | 0.05mi |
| 651 Vista Lago Cir N Palm Desert, CA | 2.0 | 2.0 | 1330 | $5,700 | $4.29 | 45d | 1 | 0.08mi |
| 259 Vista Royale Cir W Palm Desert, CA | 2.0 | 2.0 | 1330 | $5,600 | $4.21 | 45d | 1 | 0.17mi |
| 237 Vista Royale Cir W Palm Desert, CA | 3.0 | 2.5 | 1814 | $6,200 | $3.42 | 45d | 1 | 0.19mi |
| 248 Vista Royale Cir W Palm Desert, CA | 2.0 | 2.0 | 1330 | $4,999 | $3.76 | 45d | 1 | 0.21mi |
| 221 Vista Royale Cir W Palm Desert, CA | 2.0 | 2.5 | 1360 | $5,900 | $4.34 | 25d | 1 | 0.23mi |
| 221 Vista Royale Cir E Palm Desert, CA | 2.0 | 2.0 | 1360 | $5,900 | $4.34 | 25d | 1 | 0.25mi |
| 726 Vista Lago Dr N Palm Desert, CA | 3.0 | 2.5 | 1814 | $4,900 | $2.70 | 45d | 1 | 0.26mi |
| 319 Vista Royale Dr Palm Desert, CA | 3.0 | 2.5 | 1814 | $2,900 | $1.60 | 45d | 1 | 0.28mi |
| 778 Montana Vista Dr Palm Desert, CA | 3.0 | 2.5 | 1814 | $6,500 | $3.58 | 45d | 1 | 0.28mi |
| 781 Montana Vista Dr Palm Desert, CA | 2.0 | 2.0 | 1330 | $6,000 | $4.51 | 45d | 1 | 0.29mi |
| 551 Desert Falls Dr E Palm Desert, CA | 2.0 | 2.0 | 1330 | $5,500 | $4.14 | 45d | 1 | 0.30mi |
| 260 Vista Royale Cir E Palm Desert, CA | 4.0 | 3.0 | 2236 | $8,000 | $3.58 | 45d | 1 | 0.32mi |
| 270 Vista Royale Cir E Palm Desert, CA | 3.0 | 2.5 | 1814 | $3,250 | $1.79 | 45d | 1 | 0.33mi |
| 270 Vista Royale Cir E Palm Desert, CA | 3.0 | 2.5 | 1814 | $3,250 | $1.79 | 6d | 1 | 0.33mi |
| 274 Vista Royale Cir E Palm Desert, CA | 3.0 | 2.5 | 1814 | $2,900 | $1.60 | 25d | 1 | 0.34mi |
| 491 Desert Falls Dr N Palm Desert, CA | 2.0 | 2.0 | 1360 | $6,500 | $4.78 | 45d | 1 | 0.41mi |
| 127 Villa Ct Palm Desert, CA | 2.0 | 2.0 | 1330 | $6,800 | $5.11 | 45d | 1 | 0.42mi |
| 139 Villa Ct Palm Desert, CA | 2.0 | 2.0 | 1330 | $6,200 | $4.66 | 45d | 1 | 0.45mi |
| 474 Evergreen Ash Palm Desert, CA | 2.0 | 2.0 | 1330 | $2,850 | $2.14 | 25d | 1 | 0.47mi |
| 116 Avellino Cir Palm Desert, CA | 2.0 | 2.0 | 1426 | $6,200 | $4.35 | 45d | 1 | 0.50mi |
| 272 Desert Falls Dr E Palm Desert, CA | 2.0 | 2.0 | 1330 | $6,250 | $4.70 | 45d | 1 | 0.50mi |
| 207 Desert Falls Cir Palm Desert, CA | 2.0 | 2.0 | 1330 | $6,200 | $4.66 | 45d | 1 | 0.50mi |
| 187 Desert Falls Cir Palm Desert, CA | 3.0 | 2.5 | 1814 | $5,999 | $3.31 | 45d | 1 | 0.51mi |
| 189 Desert Falls Cir Palm Desert, CA | 2.0 | 2.5 | 1814 | $6,500 | $3.58 | 45d | 1 | 0.51mi |
| 107 Avellino Cir Palm Desert, CA | 2.0 | 2.0 | 1528 | $5,900 | $3.86 | 45d | 1 | 0.53mi |
| 216 Desert Falls Dr E Palm Desert, CA | 2.0 | 2.0 | 1330 | $3,250 | $2.44 | 45d | 1 | 0.53mi |
| 156 Falls Ct Palm Desert, CA | 3.0 | 2.5 | 1814 | $6,000 | $3.31 | 45d | 1 | 0.53mi |
| 100 Brandigo Cir Palm Desert, CA | 2.0 | 2.0 | 1609 | $4,500 | $2.80 | 21d | 1 | 0.54mi |
| 182 Desert Falls Cir Palm Desert, CA | 2.0 | 2.0 | 1330 | $6,200 | $4.66 | 45d | 1 | 0.54mi |
| 199 Desert Falls Dr E Palm Desert, CA | 2.0 | 2.0 | 1330 | $6,200 | $4.66 | 45d | 1 | 0.55mi |
| 101 Avellino Cir Palm Desert, CA | 2.0 | 2.0 | 1500 | $3,000 | $2.00 | 23d | 1 | 0.55mi |
| 37600 College Dr Palm Desert, CA | 1.0–3.0 | 1.0–2.5 | 1195 | $2,910 | $2.44 | 0d | 20 | 0.56mi |
| 432 Desert Falls Dr N Palm Desert, CA | 3.0 | 2.5 | 1814 | $4,800 | $2.65 | 45d | 1 | 0.56mi |
| 413 Desert Falls Dr N Palm Desert, CA | 2.0 | 2.0 | 1330 | $6,200 | $4.66 | 45d | 1 | 0.58mi |
| 160 Desert Falls Cir Palm Desert, CA | 2.0 | 2.0 | 1330 | $4,000 | $3.01 | 3d | 1 | 0.60mi |
| 164 Desert Falls Dr E Palm Desert, CA | 2.0 | 2.0 | 1330 | $3,000 | $2.26 | 45d | 1 | 0.64mi |
| 136 Desert Falls Dr E Palm Desert, CA | 3.0 | 2.5 | 1814 | $3,200 | $1.76 | 45d | 1 | 0.70mi |
| 607 Calle Vibrante Palm Desert, CA | 3.0 | 2.5 | 1873 | $2,700 | $1.44 | 0d | 1 | 0.71mi |
| 607 Calle Vibrante Palm Desert, CA | 3.0 | 2.0 | 1873 | $2,895 | $1.55 | 45d | 1 | 0.71mi |
HOA detail condo
- Monthly dues
- $891 · $10,692/yr
- Likely covers
- pool
- Assessments
- None detected in remarks — confirm with the listing agent.
Listing history 18 events
-
2026-06-21days on market $429,000 Active 6 DOM
-
2026-06-18days on market $429,000 Active 3 DOM
-
2026-06-17days on market $429,000 Active 2 DOM
-
2026-06-15pricedays on market $429,000 Active 1 DOM
-
2026-05-31days on market $439,000 Active 223 DOM
-
2026-04-03price $439,000 1084-char remark
-
2026-03-28price $424,000 1084-char remark
-
2025-10-20$439,000 Active 1084-char remark
-
2025-05-21$6,500
-
2022-07-08soldstatus $450,000 Closed 298-char remark
Show marketing remark (298 chars)
Very clean and well maintained upper level villa. Three bedrooms, two baths + powder room, in a spacious 1,814 SF. Home features high ceilings, walk-in closets, kitchen nook, large balcony over looking greenbelt and pool, with mountain views and a two car garage. Unit is well priced and furnished!
-
2022-07-08soldstatus $450,000
Show marketing remark (298 chars)
Very clean and well maintained upper level villa. Three bedrooms, two baths + powder room, in a spacious 1,814 SF. Home features high ceilings, walk-in closets, kitchen nook, large balcony over looking greenbelt and pool, with mountain views and a two car garage. Unit is well priced and furnished!
-
2022-06-08historical Active Under Contract 298-char remark
Show marketing remark (298 chars)
Very clean and well maintained upper level villa. Three bedrooms, two baths + powder room, in a spacious 1,814 SF. Home features high ceilings, walk-in closets, kitchen nook, large balcony over looking greenbelt and pool, with mountain views and a two car garage. Unit is well priced and furnished!
-
2022-05-03$475,000 Active 298-char remark
Show marketing remark (298 chars)
Very clean and well maintained upper level villa. Three bedrooms, two baths + powder room, in a spacious 1,814 SF. Home features high ceilings, walk-in closets, kitchen nook, large balcony over looking greenbelt and pool, with mountain views and a two car garage. Unit is well priced and furnished!
-
2005-02-18soldstatus $355,000
-
2004-12-29historical
-
2004-05-30$364,000
-
2000-05-25soldstatus $190,000
-
1992-12-11soldstatus $152,000
ⓘ Source: listings_history table (triggers on properties + properties_extension) + one-shot
backfill from property_details.listing_events for pre-trigger history.
Tax reassessment forecast CA · Resets to sale price
- Current annual tax
- $6,502 · $542/mo
- Projected year-2 tax
- $6,502 · $542/mo
- Expected delta
- $0/yr ($0/mo · 0.0%)
ⓘ Screening estimate from a state-policy table — verify with the county assessor before closing.
Climate risk First Street
- Flood 1/10 Low FEMA zone X (unshaded) · 0% chance over 30 yrs
- Wildfire 4/10 Moderate
- Heat 9/10 Extreme 5 d/yr ≥114°F today · 14 d/yr by 30 yrs out
- Wind 1/10 Low
- Air quality 4/10 Moderate 5 unhealthy d/yr today · 7 by 30 yrs out
Nearby sold comps map
Loading sold comps map…
Walkable amenities ~0.75 mi
Loading nearby amenities…
Taxation est. · year 1
- Rental income
- $58,438
- − Mortgage interest
- −$24,031
- − Property taxes
- −$6,502
- − Insurance
- −$2,145
- − Repairs & maintenance
- −$4,675
- − Management
- −$4,675
- − HOA
- −$10,692
- − Depreciation
- −$12,480
- Taxable loss
- −$6,762
- Est. tax savings @ 24.0%
- +$1,623
- After-tax cash flow
- $1,453/yr
For passive investors: Depreciation is non-cash, so a rental often shows a tax loss while cash-flowing — sheltering income. Rental losses are passive: they offset passive income freely, and up to $25,000/yr can offset ordinary (W-2) income if you actively participate and your MAGI is under $100k (phasing out to $0 by $150k); unused losses carry forward. On sale, claimed depreciation is recaptured at up to 25%, and gains may owe capital-gains tax (a 1031 exchange can defer both). Figures are a year-1 estimate at your 24.0% rate — not tax advice; consult a CPA.
Schools (NCES district)
- District
- Desert Sands Unified
- NCES district ID
- 0611110
- Math proficiency
- 31% ▼ -4.00%
- Reading proficiency
- 56% ▲ 7.00%
- Median HH income
- $54,957
- Composite
- 37.77/100
- National rank
- #4346
- State rank
- #199 of 517 in CA
Livability — Palm Desert
- Score
- 51/100
- State rank
- #1050
- US rank
- #25164
Category grades
Schools grade is shown separately in the Schools card above.
Census & demographics
- Census place
- Palm Desert, CA
- County
- Riverside County · 2,287,001 people
- City population
- 58,615
- Metro
- Riverside-San Bernardino-Ontario, CA
- Population (ZIP)
- 28,092
- Household income
- $88,477
- Rent vs Own
- Severe rent burden
- 1181.0
Population outlook (Riverside County) Hauer SSP2
- Today (2025)
- 2,664,475 people
- By 2030
- 2,802,692 · +5.2%
- By 2040
- 3,050,904 · +14.5%
- By 2050
- 3,256,783 · +22.2%
- By 2075
- 3,655,058 · +37.2%
- By 2100
- 3,766,594 · +41.4%
Race, ethnicity, and origin ACS 2023
- Neighborhood character
- Predominantly White (75%)
- Race & ethnicity
- White 75% Hispanic / Latino 16% Two or more races 11% Asian 4% Black 3% Native American 1%
- Hispanic origin (detail)
- Mexican 12%
- Common ancestry
- Scotch-Irish 3% Slovak 3% Romanian 3%
- Foreign-born
- 16% · Canada, China
- Languages at home
- 85% English-only · Spanish 9% Other Indo-European 2% Tagalog/Filipino 1%
Political lean MEDSL · Riverside
- 2024 margin
- Toss-up / Even · D 48.0% · R 49.3% · Other 2.6%
- 2008→2024 swing
- -3.6pp toward R · 2008: 2.3pp · 2024: -1.3pp
- All cycles
- 2024: R+1.3 2020: D+8.0 2016: D+4.3 2012: R+0.4 2008: D+2.3
Not yet ingested
- Civics
- —
Market trends
- HPI YoY
- ▼ -166.92%
- Current HPI
- 233.4619
- Rent YoY
- ▼ -0.30%
- Metro
- Riverside-San Bernardino-Ontario, CA
- State GDP YoY
- ▲ 3.21%
- F500 in state
- 116
Industry mix (Fortune 500 HQ in CA)
| Industry | F500 HQs | Revenue |
|---|---|---|
| Technology | 27 | $1,492B |
|
||
| Financial Services | 3 | $174B |
|
||
| Retail | 3 | $44B |
|
||
| Insurance | 3 | $26B |
|
||
| Media / Entertainment | 2 | $115B |
|
||
| Pharmaceuticals / Biotech | 2 | $62B |
|
||
Price history
+182.2% since first listed16 events — show timeline
- 2026-06-15 Listed $429,000 TheMLS
- 2026-06-01 Rental Removed $6,500 CRMLS
- 2026-06-01 Listing Removed — GPSMLS
- 2026-04-03 Price Changed $439,000 GPSMLS
- 2026-03-28 Price Changed $424,000 GPSMLS
- 2025-10-20 Listed $439,000 GPSMLS
- 2025-05-21 Listed for Rent $6,500 CRMLS
- 2022-07-08 Sold (Public Records) $450,000 Public Records
- 2022-07-08 Sold (MLS) $450,000 GPSMLS
- 2022-06-08 Contingent — GPSMLS
- 2022-05-03 Listed $475,000 GPSMLS
- 2005-02-18 Sold (Public Records) $355,000 Public Records
- 2004-12-29 Listing Removed — GPSMLS
- 2004-05-30 Listed $364,000 GPSMLS
- 2000-05-25 Sold (Public Records) $190,000 Public Records
- 1992-12-11 Sold (Public Records) $152,000 Public Records
Property tax history
+2.2%/yrLatest (2025): $6,502 · +2.7% YoY. Source: county tax records.
Cash-flow waterfall
monthlySold comps — $/sqft
last 12 mo · ≤1 miLoading sold comps…