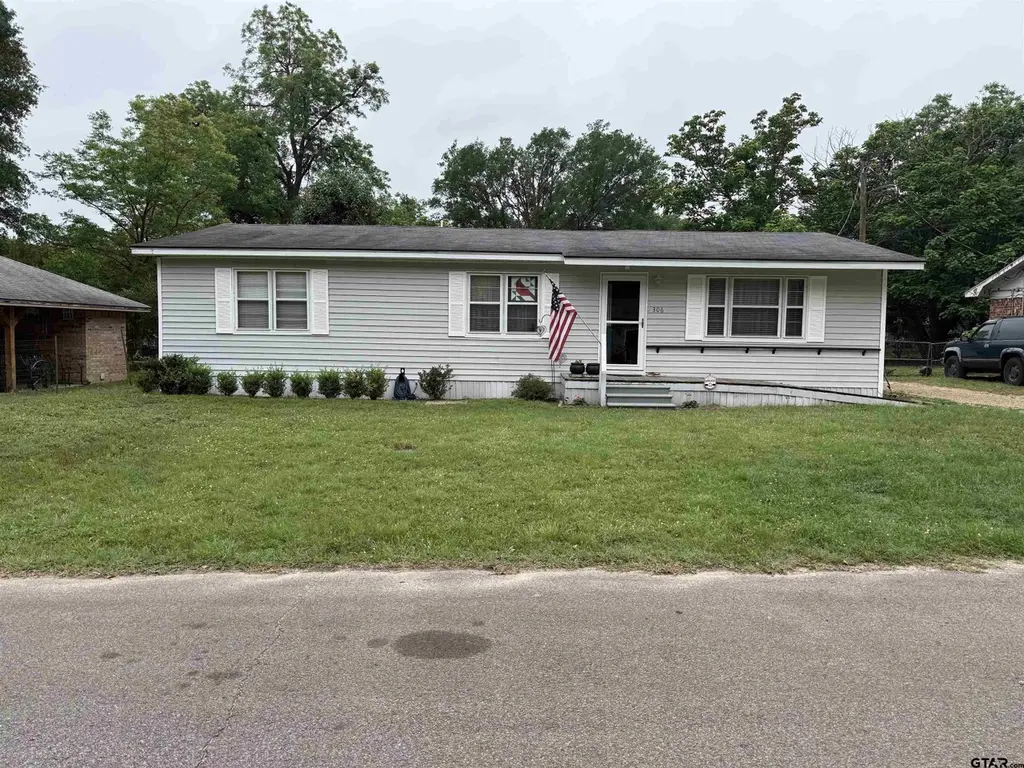
306 Floyd St · Winnsboro, TX
Flood risk 1/10 · Minimal
- FEMA flood zone
- X (unshaded)
- Chance of flooding over 30 yrs
- 0.0%
- Est. flood insurance / yr
- $507 – $1,088
Fire risk 4/10 · Minor
- Est. fire insurance / yr
- $1,222 – $2,270
Heat risk 7/10 · Major
- Hot days now (above 110°F)
- 7 days/yr
- Hot days in 30 yrs
- 24 days/yr
Wind risk 6/10 · Moderate
- Chance of severe wind over 30 yrs
- 27.0%
Air-quality risk 2/10 · Minimal
- Unhealthy air days now
- 0 days/yr
- Unhealthy air days in 30 yrs
- 1 days/yr
Risk factors via First Street. Map © Google.
Why this score? — see what drove the B+ grade
The composite is a weighted blend of 9 inputs, each scored 0–100. Each bar is that input's sub-score; the figure is the points it added to the 100-point composite (weight × sub-score).
- Cash flow +30.0/30.0
- ARV discount +15.0/15.0
- DSCR +10.0/10.0
- 1% rule +9.9/10.0
- Schools +3.6/10.0
- Livability +3.5/5.0
- Rent growth +2.5/5.0
- Condition / age +2.5/5.0
- Appreciation +0.0/10.0
$149,500
🖨 Deal sheet 📄 Offer letter ✓ Due diligence
Listing remarks
Charming 3BR-2BA home in the heart of Winnsboro, Texas. This little gem y offers an open kitchen & dining area, two comfortable living spaces, and a spacious backyard with room for a garden. Enjoy the covered porch plus a large storage building-workshop with attached covered parking for your lawn equipment, along with a convenient wrap-around drive leading into a two car carport. Located just minutes from historic downtown Winnsboro, you’ll have easy access to local dining, shopping, and the seasonal Winnsboro Farmers’ Market held on Saturdays from April through October in the downtown area. Area hospitals and schools are within a comfortable drive, and you’re approx
Key facts
- Covered porch
- Spacious backyard
- Dining area
Tags
Property features AI
Exterior
- Parking: Gravel parking
- Security: Smoke detector(s)
- Utilities: Public water; Public sewer; Cable available
- Home design: Single family detached residence; One story
- Construction: Aluminum siding; Shingle siding; Vinyl siding; Composition roof
- Exterior features: Covered patio/porch; Deck; Porch; Chain link fencing; Storage; Workshop; Satellite dish
Interior
- Kitchen: Electric oven; Electric range; Refrigerator
- Flooring: Carpet; Laminate
- Bathrooms: 2 full bathrooms
- Heating & cooling: Central heating (natural gas); Space heater; Central air; Ceiling fans; Window units
- Interior features: Pantry; Smoke detectors
- Laundry & utility: Gas water heater
Neighborhood map
What this means for you Summary
Snapshot
- This is a 3-bed/2.0-bath single-family listed at $150k.
Deal economics
- At list price, monthly cash flow is $734 ($9k/yr) — positive.
- The deal already cash-flows at list — no discount required.
- Meets the 1% rule at list price ($2k rent vs $150k).
- Recommended offer: $147k (1.5% below list) — sets the bar for market timing.
- Cap rate 12.2% vs local median 3.8% in Winnsboro — top-decile yield for the area; either an underpriced asset or a hidden risk that comps aren't pricing in. Stress-test before assuming the spread holds.
Location & tenants
- Location reads 69/100 on livability (#416 in TX) — a middle-class / working-renter tenant base. Strengths: cost of living A+, housing A+, crime B; Watch: employment D+, amenities F, commute F.
- Winnsboro ISD (town): math 46% / reading 40% proficiency, ranked #330 of 826 in TX (top 40%) — families likely to look elsewhere, expect single-tenant / working-renter base with shorter leases.
- Zoned schools: Winnsboro El (355 students, 71% FRL); Winnsboro J H (math 48% / reading 40%, grade D, #512 of 1,662 statewide, top 32%, 360 students, 53% FRL); Winnsboro H S (math 67% / reading 62%, grade B-, #199 of 1,632 statewide, top 14%, 492 students, 65% FRL).
- Market conditions: 217 active listings in the ZIP; 1 comparable units currently listed for rent nearby; 72 units permitted in Wood County in 2024 (29 in 5+ unit buildings).
Forward outlook
- Local home prices are declining (-3.0%/yr); year-one equity from $1k of loan paydown is wiped out by about $4k of value loss. Plan a longer hold.
- Wood County population projected at +12% by 2050 — modest demand growth; plan on rents tracking national, not racing it.
- At projected returns (-3.0% appreciation + 3.0% rent growth), your $42k cash investment doubles in ~6 years — after that, you're playing with house money.
Negotiation context
- It's been on market 15 days — a 2% lower offer ($147k) is reasonable based on typical stale-listing flexibility.
Risks & watch-outs
- Climate carrying-cost: major wind risk, 27% chance of damaging wind over 30y; extreme-heat days projected 7→24/yr by 2055 (HVAC capex compounding) — expect insurance premiums to compound above CPI over the hold.
Questions for the listing agent
- Is there a deadline driving the sale (1031 exchange, divorce, estate, relocation)? That informs how much negotiation room exists.
- What's the average days-on-market for RENTAL listings here right now (not sales)? A rising rental-DOM trend means longer vacancies and softer asking-rent achievability than the comps imply.
- What's the recent tenant-quality profile in this submarket — average credit score on applications, eviction rate, late-payment / NSF rate, and stable-employment percentage? A property-management company in the area should have these aggregated.
- How much new for-sale + rental construction is in the pipeline within 1–3 miles? Heavy new supply typically softens prices + rents 12–24 months out; constrained supply supports both.
Investment metrics
- 1% rule
- 1.49% ✓
- Cap rate
- 12.18%
- Cash-on-cash
- 21.03%
- DSCR
- 1.94
- GRM
- 5.6
CMA / ARV
- ARV (on-the-fly)
- $204,442
- Comps found
- 12
Show comp detail 12 sales within ~0.75 mi
| Address | Dist | Beds/Ba | Sqft | Sold | Price | $/sf | Match |
|---|---|---|---|---|---|---|---|
| 504 N Main St | 0.25mi | 3/2.0 | 1,710 (-0%) | 2mo | $245,888 | $144 | 86 |
| 308 Jeannine St | 0.18mi | 3/2.0 | 1,615 (-6%) | 6mo | $236,900 | $147 | 77 |
| 911 N Walnut St | 0.17mi | 2/1.0 (-1) | 1,760 (+2%) | 11mo | $138,000 | $78 | 70 |
| 919 Sherrill St | 0.17mi | 3/2.0 | 1,824 (+6%) | 17mo | $237,000 | $130 | 68 |
| 205 S Main St | 0.50mi | 3/2.5 | 1,815 (+6%) | 3mo | $189,000 | $104 | 63 |
| 1011 N Main St | 0.36mi | 3/1.5 | 1,538 (-10%) | 1mo | $210,000 | $137 | 63 |
| 104 E Pine St | 0.20mi | 3/1.5 | 1,884 (+10%) | 16mo | $197,500 | $105 | 59 |
| 300 S Beech St | 0.49mi | 2/2.0 (-1) | 1,871 (+9%) | 2mo | $169,900 | $91 | 56 |
| 409 W Myrtle St | 0.69mi | 3/2.0 | 1,708 (-1%) | 14mo | $269,500 | $158 | 55 |
| 207 E Cedar St | 0.55mi | 3/2.0 | 1,586 (-8%) | 15mo | $169,900 | $107 | 49 |
| 203 E Cedar St | 0.56mi | 4/2.0 (+1) | 1,586 (-8%) | 15mo | $189,500 | $119 | 44 |
| 408 N Post Oak | 0.66mi | 3/2.0 | 1,512 (-12%) | 11mo | $168,000 | $111 | 40 |
Match score weights: distance 35% · size 25% · config 20% · recency 20%. Top-matched comps best support the ARV.
Projected returns pro-forma
-3.0% appreciation · 3.0% rent growth · sell at horizon
- IRR
- 13.5%
- Equity multiple
- 1.54×
- Total profit
- $22,538
- Equity at exit
- $22,291
- IRR
- 22.3%
- Equity multiple
- 2.91×
- Total profit
- $79,932
- Equity at exit
- $12,926
Cash invested: $41,860 (down + closing). Projections, not guarantees.
Landlord ↔ Tenant lean methodology
- Overall (STATE)
- 87 Strongly Landlord-Friendly
- State Texas
- 87 Strongly Landlord-Friendly · R+5
- County
- — inherits STATE
- City
- — inherits STATE
ZIP-level market 75494
- Home prices YoY
- -10.9%
- Active inventory
- 217
- Price-to-rent
- 5.6×
Monthly cashflow live
- Estimated rent
- $2,235 medium interval (Pro) →
- Mortgage (P&I)
- −$784
- Tax from tax record
- −$186 /mo · $2,228/yr
- Insurance
- −$62
- HOA
- −$0
- Vacancy / Maint / Mgmt
- −$469
- Net cashflow
- $734
Break-even live
UW: 25.0% down · 7.5% · 30yr · 1.5% tax · 5.0% vac · 8.0% maint · 8.0% mgmt
Financing live
Cash to close
- Down payment
- $37,375
- Closing costs
- $4,485
- Reserves months
- —
- Total cash needed
- —
Loan-product check · same deal, 3 products live
Conventional
25% down · 7.5% · 30yr
- Down + closing
- —
- Monthly P&I
- —
- Monthly cashflow
- —
- DSCR
- —
- Eligible?
- —
Personal DTI + credit; lowest rate.
DSCR
20% down · 8.5% · 30yr
- Down + closing
- —
- Monthly P&I
- —
- Monthly cashflow
- —
- DSCR
- —
- Eligible?
- —
No personal income docs; deal must DSCR.
Hard money
10% down · 12.0% · 12mo
- Down + closing
- —
- Monthly P&I
- —
- Monthly cashflow
- —
- DSCR
- —
- Eligible?
- —
Short-term bridge; refi at stabilization.
Rent comps 1 comps
| Address | Beds | Baths | Sqft | Rent | $/sqft | DOM | Units | Dist |
|---|---|---|---|---|---|---|---|---|
| 305 S Mill St Winnsboro, TX | 4.0 | 2.0 | 1954 | $2,235 | $1.14 | 43d | 1 | 0.57mi |
Listing history 14 events
-
2026-06-18days on market $149,500 Active 15 DOM
-
2026-06-17days on market $149,500 Active 14 DOM
-
2026-06-16days on market $149,500 Active 13 DOM
-
2026-06-15days on market $149,500 Active 12 DOM
-
2026-06-15days on market $149,500 Active 11 DOM
-
2026-06-13days on market $149,500 Active 10 DOM
-
2026-06-12days on market $149,500 Active 9 DOM
-
2026-06-09days on market $149,500 Active 6 DOM
-
2026-06-08days on market $149,500 Active 5 DOM
-
2026-06-08days on market $149,500 Active 4 DOM
-
2026-06-07days on market $149,500 Active 3 DOM
-
2026-06-04$149,500 Active 1 DOM
-
2026-06-02remarks 677-char remark
-
2026-06-02$149,500 Active 1 DOM
ⓘ Source: listings_history table (triggers on properties + properties_extension) + one-shot
backfill from property_details.listing_events for pre-trigger history.
Tax reassessment forecast TX · Resets to sale price
- Current annual tax
- $2,228 · $186/mo
- Projected year-2 tax
- $2,736 · $228/mo
- Expected delta
- +$508/yr (+$42/mo · 22.8%)
ⓘ Screening estimate from a state-policy table — verify with the county assessor before closing.
Climate risk First Street
- Flood 1/10 Low FEMA zone X (unshaded) · 0% chance over 30 yrs
- Wildfire 4/10 Moderate
- Heat 7/10 Severe 7 d/yr ≥110°F today · 24 d/yr by 30 yrs out
- Wind 6/10 Major 27% chance of damaging wind over 30 yrs
- Air quality 2/10 Low 0 unhealthy d/yr today · 1 by 30 yrs out
Nearby sold comps map
Loading sold comps map…
Walkable amenities ~0.75 mi
Loading nearby amenities…
Taxation est. · year 1
- Rental income
- $26,820
- − Mortgage interest
- −$8,374
- − Property taxes
- −$2,228
- − Insurance
- −$748
- − Repairs & maintenance
- −$2,146
- − Management
- −$2,146
- − Depreciation
- −$4,349
- Taxable income
- $6,830
- Est. tax owed @ 24.0%
- −$1,639
- After-tax cash flow
- $7,165/yr
For passive investors: Depreciation is non-cash, so a rental often shows a tax loss while cash-flowing — sheltering income. Rental losses are passive: they offset passive income freely, and up to $25,000/yr can offset ordinary (W-2) income if you actively participate and your MAGI is under $100k (phasing out to $0 by $150k); unused losses carry forward. On sale, claimed depreciation is recaptured at up to 25%, and gains may owe capital-gains tax (a 1031 exchange can defer both). Figures are a year-1 estimate at your 24.0% rate — not tax advice; consult a CPA.
Schools (NCES district)
- District
- Winnsboro ISD
- NCES district ID
- 4846200
- Math proficiency
- 46% ▼ -4.00%
- Reading proficiency
- 40% ▼ -10.00%
- Median HH income
- $40,192
- Composite
- 36.07/100
- National rank
- #4769
- State rank
- #330 of 826 in TX
Livability — Winnsboro
- Score
- 69/100
- State rank
- #416
- US rank
- #8564
Category grades
Schools grade is shown separately in the Schools card above.
Census & demographics
- Census place
- Winnsboro, TX
- Population (ZIP)
- 11,685
Population outlook (Wood County) Hauer SSP2
- Today (2025)
- 46,480 people
- By 2030
- 47,796 · +2.8%
- By 2040
- 50,142 · +7.9%
- By 2050
- 52,122 · +12.1%
- By 2075
- 57,033 · +22.7%
- By 2100
- 56,418 · +21.4%
Race, ethnicity, and origin ACS 2023
- Neighborhood character
- Predominantly White (82%)
- Race & ethnicity
- White 82% Hispanic / Latino 13% Two or more races 10% Black 1% Asian 1%
- Hispanic origin (detail)
- Mexican 12%
- Common ancestry
- Serbian 2% Iranian 2% Slovak 1%
- Foreign-born
- 7% · Canada, South Korea
- Languages at home
- 89% English-only · Spanish 8% German/W. Germanic 1% Arabic 1%
Political lean MEDSL · Wood
- 2024 margin
- Solid R (+69.7) · D 14.8% · R 84.6%
- 2008→2024 swing
- -15.5pp toward R · 2008: -54.2pp · 2024: -69.7pp
- All cycles
- 2024: R+69.7 2020: R+68.2 2016: R+70.0 2012: R+64.2 2008: R+54.2
Not yet ingested
- Civics
- —
Market trends
- HPI YoY
- ▼ -28.64%
- Current HPI
- 234.6203
- Rent YoY
- —
- Metro
- —
- State GDP YoY
- ▲ 3.95%
- F500 in state
- 110
Industry mix (Fortune 500 HQ in TX)
| Industry | F500 HQs | Revenue |
|---|---|---|
| Energy | 16 | $1,198B |
|
||
| Technology | 5 | $198B |
|
||
| Engineering / Construction | 4 | $72B |
|
||
| Energy Services | 3 | $60B |
|
||
| Utilities | 3 | $41B |
|
||
| Healthcare | 2 | $330B |
|
||
Price history
4 events — show timeline
- 2026-06-02 Listed $149,500 GTAR
- 2009-12-09 Sold (Public Records) — Public Records
- 2009-12-09 Sold (Public Records) — Public Records
- 1999-03-10 Sold (Public Records) — Public Records
Property tax history
+5.3%/yrLatest (2025): $2,228 · +7.4% YoY. Source: county tax records.
Cash-flow waterfall
monthlySold comps — $/sqft
last 12 mo · ≤1 miLoading sold comps…