615 E Buchanan St · Litchfield, IL
Flood risk 1/10 · Minimal
- FEMA flood zone
- X
- Chance of flooding over 30 yrs
- 0.0%
- Est. flood insurance / yr
- $473 – $860
Fire risk 1/10 · Minimal
- Est. fire insurance / yr
- $804 – $1,492
Heat risk 4/10 · Minor
- Hot days now (above 106°F)
- 7 days/yr
- Hot days in 30 yrs
- 21 days/yr
Wind risk 2/10 · Minimal
- Chance of severe wind over 30 yrs
- 1.0%
Air-quality risk 3/10 · Minor
- Unhealthy air days now
- 2 days/yr
- Unhealthy air days in 30 yrs
- 4 days/yr
Risk factors via First Street. Map © Google.
Why this score? — see what drove the B+ grade
The composite is a weighted blend of 9 inputs, each scored 0–100. Each bar is that input's sub-score; the figure is the points it added to the 100-point composite (weight × sub-score).
- Cash flow +30.0/30.0
- ARV discount +15.0/15.0
- 1% rule +10.0/10.0
- DSCR +10.0/10.0
- Livability +3.4/5.0
- Rent growth +2.5/5.0
- Condition / age +2.5/5.0
- Schools +2.1/10.0
- Appreciation +0.0/10.0
$55,000
🖨 Deal sheet (PDF) 📄 Offer letter ✓ Due diligence
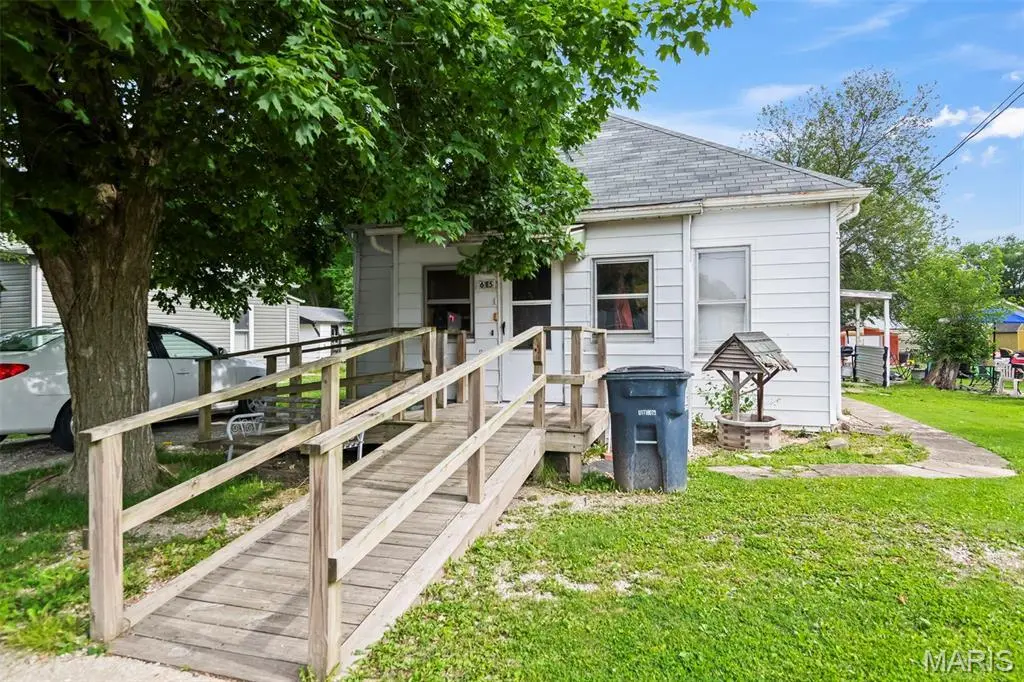
Listing remarks
Cute, cozy, and full of potential! This 2 bedroom, 1 bathroom home offers a functional layout with a good sized living room, roomy dining area, and a kitchen with plenty of cabinet space. The wheelchair-accessible ramp provides easy entry, while the covered side area and mature shade tree add extra charm outside. You’ll love the large detached garage—perfect for storage, projects, hobbies, or keeping all the “I’ll use this someday” items organized. The home also features a main level laundry area and a bathroom with recent renovations. All plumbing and water lines under the home have been updated. Affordable and ready for you!
Key facts
- Covered side area
- Mature shade tree
- Recent renovations
Tags
Property features AI
Finance
- Other: Living area reported as 915 (above grade); Property type: Residential
- Financial info: Lease not considered; No home warranty indicated; Seller may consider concessions
Exterior
- Parking: 1-car garage
- Utilities: Public water; Public sewer; Electric service by Ameren; Electricity available
- Home design: Single-family residence; One story
- Construction: Aluminum siding
- Exterior features: Back yard; Lot dimensions approximately 50 x 131
Interior
- Kitchen: Gas oven; Refrigerator; Kitchen (15x10)
- Bedrooms: 2 bedrooms on the main level (10x11 and 10x10)
- Bathrooms: 1 full bathroom on the main level (8x5)
- Heating & cooling: Forced air heating; Central air conditioning
- Interior features: Gas oven; Refrigerator; Crawl space basement
Neighborhood map
What this means for you Summary
Snapshot
- This is a 2-bed/1.0-bath single-family listed at $55k.
Deal economics
- At list price, monthly cash flow is $219 ($3k/yr) — positive.
- The deal already cash-flows at list — no discount required.
- Meets the 1% rule at list price ($874 rent vs $55k).
- Cap rate 11.1% vs local median 4.5% in Litchfield — top-decile yield for the area; either an underpriced asset or a hidden risk that comps aren't pricing in. Stress-test before assuming the spread holds.
Location & tenants
- Location reads 68/100 on livability (#448 in IL) — a middle-class / working-renter tenant base. Strengths: cost of living A+, housing A+, health & safety A+; Watch: crime C-, employment D+, amenities F.
- Litchfield CUSD 12 (town): math 15% / reading 34% proficiency, ranked #359 of 620 in IL (top 58%) — low school quality limits family demand, transient renter base, plan for 1-2y turnover.
- Zoned schools: Madison Park Elem School (179 students, 0% FRL); Litchfield Middle School (math 12% / reading 43%, grade F, #295 of 665 statewide, top 45%, 246 students, 0% FRL); Litchfield Senior High School (math 22% / reading 27%, grade F, #256 of 693 statewide, top 44%, 411 students, 0% FRL) — zoned schools average 0% FRL vs 49% district-wide (49 pts lower); this property's tenant base skews higher-income than the district average.
- Market conditions: 59 active listings in the ZIP; 12 units permitted in Montgomery County in 2024 (0 in 5+ unit buildings).
Forward outlook
- Local home prices are declining (-3.0%/yr); year-one equity from $380 of loan paydown is wiped out by about $2k of value loss. Plan a longer hold.
- Montgomery County population projected at -20% by 2050 — secular population decline; favor cash flow + early exit over multi-decade hold.
- At projected returns (-3.0% appreciation + 3.0% rent growth), your $15k cash investment doubles in ~7 years — after that, you're playing with house money.
Negotiation context
- Only 12 days on market — expect competitive offers; lowballing is unlikely to land.
Risks & watch-outs
- Watch-outs: property tax is 3.5% of price; built in 1905 — expect roof / HVAC / electrical / plumbing capex.
Questions for the listing agent
- Built in 1905 — when were the roof, HVAC, electrical panel, plumbing, and water heater last replaced?
- Property tax is high relative to price — has the assessment been appealed recently, and will the sale trigger a re-assessment?
- Is there a deadline driving the sale (1031 exchange, divorce, estate, relocation)? That informs how much negotiation room exists.
- Schools are F-rated, which usually means shorter tenancies and higher turnover. Who's the typical renter profile here, and what's been the actual vacancy rate?
- What's the average days-on-market for RENTAL listings here right now (not sales)? A rising rental-DOM trend means longer vacancies and softer asking-rent achievability than the comps imply.
- What's the recent tenant-quality profile in this submarket — average credit score on applications, eviction rate, late-payment / NSF rate, and stable-employment percentage? A property-management company in the area should have these aggregated.
- How much new for-sale + rental construction is in the pipeline within 1–3 miles? Heavy new supply typically softens prices + rents 12–24 months out; constrained supply supports both.
Investment metrics
- 1% rule
- 1.59% ✓
- Cap rate
- 11.08%
- Cash-on-cash
- 17.09%
- DSCR
- 1.76
- GRM
- 5.2
CMA / ARV
- ARV (on-the-fly)
- $105,225
- Comps found
- 12
Show comp detail 12 sales within ~0.75 mi
| Address | Dist | Beds/Ba | Sqft | Sold | Price | $/sf | Match |
|---|---|---|---|---|---|---|---|
| 821 S Chestnut St | 0.13mi | 2/1.0 | 871 (-5%) | 6mo | $116,900 | $134 | 81 |
| 614 E Tyler Ave | 0.09mi | 2/1.0 | 811 (-11%) | 1mo | $82,000 | $101 | 76 |
| 124 W Buchanan St | 0.42mi | 2/1.0 | 884 (-3%) | 4mo | $27,000 | $31 | 71 |
| 405 S Van Buren St | 0.24mi | 1/1.0 (-1) | 934 (+2%) | 14mo | $70,000 | $75 | 69 |
| 708 S Jefferson St | 0.46mi | 2/1.0 | 864 (-6%) | 2mo | $99,000 | $115 | 68 |
| 818 S Franklin St | 0.13mi | 3/1.0 (+1) | 1,043 (+14%) | 2mo | $129,900 | $125 | 64 |
| 832 S Franklin St | 0.17mi | 2/2.0 | 1,000 (+9%) | 14mo | $110,000 | $110 | 61 |
| 705 N Locust St | 0.71mi | 2/1.0 | 888 (-3%) | 2mo | $102,000 | $115 | 60 |
| 430 S Jackson St | 0.23mi | 2/1.0 | 1,036 (+13%) | 9mo | $123,500 | $119 | 60 |
| 128 E Columbia St | 0.29mi | 2/1.0 | 778 (-15%) | 13mo | $20,000 | $26 | 51 |
| 909 N Chestnut St | 0.74mi | 2/1.0 | 980 (+7%) | 9mo | $99,900 | $102 | 46 |
| 702 N Franklin St | 0.63mi | 2/1.0 | 1,026 (+12%) | 13mo | $169,000 | $165 | 39 |
Match score weights: distance 35% · size 25% · config 20% · recency 20%. Top-matched comps best support the ARV.
Projected returns pro-forma
-3.0% appreciation · 3.0% rent growth · sell at horizon
- IRR
- 8.5%
- Equity multiple
- 1.33×
- Total profit
- $5,124
- Equity at exit
- $8,201
- IRR
- 17.8%
- Equity multiple
- 2.48×
- Total profit
- $22,728
- Equity at exit
- $4,755
Cash invested: $15,400 (down + closing). Projections, not guarantees.
Landlord ↔ Tenant lean methodology
- Overall (STATE)
- 43 Moderately Tenant-Leaning
- State Illinois
- 43 Moderately Tenant-Leaning · D+7
- County
- — inherits STATE
- City
- — inherits STATE
ZIP-level market 62056
- Home prices YoY
- -26.5%
- Active inventory
- 59
- Price-to-rent
- 5.2×
Monthly cashflow live
- Estimated rent
- $874 medium interval (Pro) →
- Mortgage (P&I)
- −$288
- Tax from tax record
- −$160 /mo · $1,915/yr
- Insurance
- −$23
- HOA
- −$0
- Vacancy / Maint / Mgmt
- −$183
- Net cashflow
- $219
Break-even live
Sensitivity live
| Price | -10% $250 | -5% $235 | +0% $219 | +5% $204 | +10% $188 |
|---|---|---|---|---|---|
| Rent | -10% $150 | -5% $185 | +0% $219 | +5% $254 | +10% $288 |
| Rate | -1.0pp $247 | -0.5pp $233 | base $219 | +0.5pp $205 | +1.0pp $191 |
UW: 25.0% down · 7.5% · 30yr · 1.5% tax · 5.0% vac · 8.0% maint · 8.0% mgmt
Financing live
Cash to close
- Down payment
- $13,750
- Closing costs
- $1,650
- Reserves months
- —
- Total cash needed
- —
Loan-product check · same deal, 3 products live
Conventional
25% down · 7.5% · 30yr
- Down + closing
- —
- Monthly P&I
- —
- Monthly cashflow
- —
- DSCR
- —
- Eligible?
- —
Personal DTI + credit; lowest rate.
DSCR
20% down · 8.5% · 30yr
- Down + closing
- —
- Monthly P&I
- —
- Monthly cashflow
- —
- DSCR
- —
- Eligible?
- —
No personal income docs; deal must DSCR.
Hard money
10% down · 12.0% · 12mo
- Down + closing
- —
- Monthly P&I
- —
- Monthly cashflow
- —
- DSCR
- —
- Eligible?
- —
Short-term bridge; refi at stabilization.
Listing history 9 events
-
2026-06-08days on market $55,000 Active 12 DOM
-
2026-06-07days on market $55,000 Active 11 DOM
-
2026-06-07days on market $55,000 Active 10 DOM
-
2026-06-04days on market $55,000 Active 7 DOM
-
2026-06-02days on market $55,000 Active 6 DOM
-
2026-06-01days on market $55,000 Active 5 DOM
-
2026-05-31days on market $55,000 Active 4 DOM
-
2026-05-31days on market $55,000 Active 3 DOM
-
2026-05-27$55,000 Active
ⓘ Source: listings_history table (triggers on properties + properties_extension) + one-shot
backfill from property_details.listing_events for pre-trigger history.
Tax reassessment forecast IL · Partial reset (capped growth)
- Current annual tax
- $1,915 · $160/mo
- Projected year-2 tax
- $1,915 · $160/mo
- Expected delta
- $0/yr ($0/mo · 0.0%)
ⓘ Screening estimate from a state-policy table — verify with the county assessor before closing.
Climate risk First Street
- Flood 1/10 Low FEMA zone X · 0% chance over 30 yrs
- Wildfire 1/10 Low
- Heat 4/10 Moderate 7 d/yr ≥106°F today · 21 d/yr by 30 yrs out
- Wind 2/10 Low 100% chance of damaging wind over 30 yrs
- Air quality 3/10 Moderate 2 unhealthy d/yr today · 4 by 30 yrs out
Nearby sold comps map
Loading sold comps map…
Walkable amenities ~0.75 mi
Loading nearby amenities…
Taxation est. · year 1
- Rental income
- $10,484
- − Mortgage interest
- −$3,081
- − Property taxes
- −$1,915
- − Insurance
- −$275
- − Repairs & maintenance
- −$839
- − Management
- −$839
- − Depreciation
- −$1,600
- Taxable income
- $1,936
- Est. tax owed @ 24.0%
- −$465
- After-tax cash flow
- $2,167/yr
For passive investors: Depreciation is non-cash, so a rental often shows a tax loss while cash-flowing — sheltering income. Rental losses are passive: they offset passive income freely, and up to $25,000/yr can offset ordinary (W-2) income if you actively participate and your MAGI is under $100k (phasing out to $0 by $150k); unused losses carry forward. On sale, claimed depreciation is recaptured at up to 25%, and gains may owe capital-gains tax (a 1031 exchange can defer both). Figures are a year-1 estimate at your 24.0% rate — not tax advice; consult a CPA.
Schools (NCES district)
- District
- Litchfield CUSD 12
- NCES district ID
- 1723250
- Math proficiency
- 15% ▼ -5.00%
- Reading proficiency
- 34% ▼ -8.00%
- Median HH income
- $43,133
- Composite
- 20.91/100
- National rank
- #8485
- State rank
- #359 of 620 in IL
Livability — Litchfield
- Score
- 68/100
- State rank
- #448
- US rank
- #9263
Category grades
Schools grade is shown separately in the Schools card above.
Census & demographics
- Census place
- Litchfield, IL
- City population
- 8,591
- Population (ZIP)
- 8,591
Population outlook (Montgomery County) Hauer SSP2
- Today (2025)
- 27,471 people
- By 2030
- 26,410 · -3.9%
- By 2040
- 24,233 · -11.8%
- By 2050
- 21,948 · -20.1%
- By 2075
- 16,686 · -39.3%
- By 2100
- 11,369 · -58.6%
Race, ethnicity, and origin ACS 2023
- Neighborhood character
- Predominantly White (99%)
- Race & ethnicity
- White 99%
- Common ancestry
- Slovak 3% Lithuanian 2% Romanian 1%
- Foreign-born
- 1%
Political lean MEDSL · Montgomery
- 2024 margin
- Solid R (+44.0) · D 27.1% · R 71.1% · Other 1.8%
- 2008→2024 swing
- -46.7pp toward R · 2008: 2.6pp · 2024: -44.0pp
- All cycles
- 2024: R+44.0 2020: R+41.0 2016: R+40.0 2012: R+14.2 2008: D+2.6
Not yet ingested
- Civics
- —
Market trends
- HPI YoY
- ▼ -53.86%
- Current HPI
- 149.5766
- Rent YoY
- —
- Metro
- —
- State GDP YoY
- ▲ 1.59%
- F500 in state
- 60
Industry mix (Fortune 500 HQ in IL)
| Industry | F500 HQs | Revenue |
|---|---|---|
| Insurance | 4 | $201B |
|
||
| Consumer Goods | 4 | $87B |
|
||
| Industrial Machinery | 3 | $64B |
|
||
| Healthcare | 2 | $55B |
|
||
| Retail / Pharmacy | 1 | $148B |
|
||
| Agriculture / Food | 1 | $86B |
|
||
Price history
1 event — show timeline
- 2026-05-27 Listed $55,000 MARIS as Distributed by MLS Grid
Property tax history
+7.9%/yrLatest (2024): $1,915 · +4.9% YoY. Source: county tax records.
Cash-flow waterfall
monthlySold comps — $/sqft
last 12 mo · ≤1 miLoading sold comps…