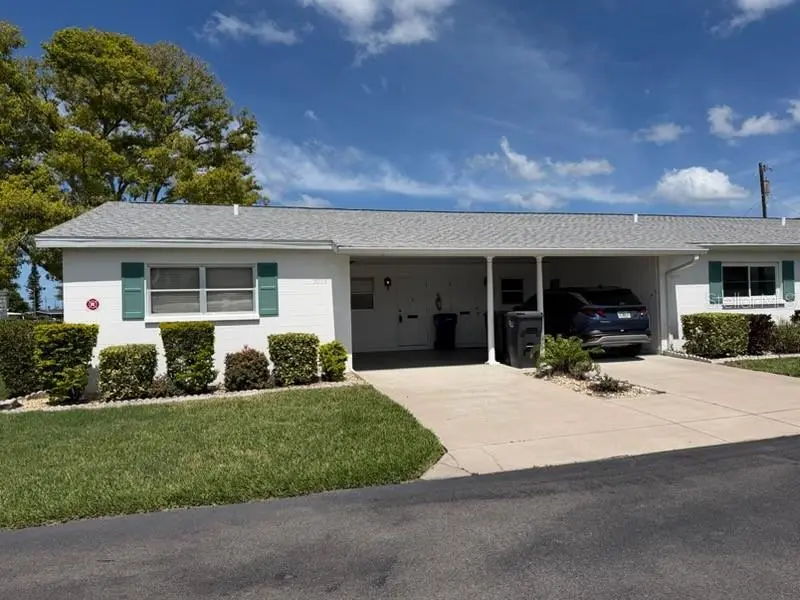
5973 Hibiscus Dr · Bayshore Gardens, FL
Flood risk 1/10 · Minimal
- FEMA flood zone
- X (unshaded)
- Chance of flooding over 30 yrs
- 0.0%
- Est. flood insurance / yr
- $507 – $1,088
Fire risk 1/10 · Minimal
- Est. fire insurance / yr
- $947 – $1,759
Heat risk 10/10 · Severe
- Hot days now (above 106°F)
- 7 days/yr
- Hot days in 30 yrs
- 31 days/yr
Wind risk 10/10 · Severe
- Chance of severe wind over 30 yrs
- 99.0%
Air-quality risk 2/10 · Minimal
- Unhealthy air days now
- 1 days/yr
- Unhealthy air days in 30 yrs
- 2 days/yr
Risk factors via First Street. Map © Google.
Why this score? — see what drove the C- grade
The composite is a weighted blend of 9 inputs, each scored 0–100. Each bar is that input's sub-score; the figure is the points it added to the 100-point composite (weight × sub-score).
- Cash flow +17.0/30.0
- 1% rule +9.2/10.0
- ARV discount +7.5/15.0
- DSCR +5.3/10.0
- Schools +4.4/10.0
- Livability +4.1/5.0
- Condition / age +2.5/5.0
- Rent growth +1.1/5.0
- Appreciation +0.0/10.0
$103,500
🖨 Deal sheet 📄 Offer letter ✓ Due diligence
Listing remarks
Opportunity Knocks!! Where can you find a nice 2-bedroom, 1 bath villa with an attached carport, updated kitchen and bath in a convenient location for this super price? Tile floor throughout, granite countertops in kitchen, inside full-size, stackable washer & dryer, 2 walk-in closets, and ceiling fans in almost every room. Large community pool has recently been refinished. The water sparkles and invites you to jump in. Enjoy a friendly game of shuffleboard or participate in some of the Clubhouse activities. This is a very active senior community. Located just west of US41 (14th St W) near the Sarasota Bradenton International Airport. Drive south to Downtown Sarasota with all its rest
Key facts
- Parking
- Community pool
- Built 1980
Property features AI
Finance
- Other: Unit is unfurnished; Third-party listing; Directions: Take US41 (14th St W) to the traffic light at Bayshore Gardens Parkway, turn west toward the Gulf, travel about 1/4 mile to Hibiscus, turn right — villa is immediately on the left.
- Financial info: Total monthly fees $467; Total annual fees $5,604; Lease restrictions apply
- HOA & community: Association: Danni; Monthly condo fee $467 (includes cable TV, common area taxes, pool, escrow reserves, fidelity bond, insurance, internet, structure and grounds maintenance, management, private road, recreational facilities); Buyer approval required; Clubhouse and pool; Community mailbox; Deed restrictions; Senior community; No pets allowed; Association approval required for buyers
Exterior
- Parking: Assigned covered parking; Driveway; Carport (1 space)
- Utilities: Public water; Public sewer; Cable connected; Sewer connected; Water connected
- Home design: Attached villa; One story; Faces east; Completed condition; Homestead exemption
- Construction: Block construction; Shingle roof; Slab foundation; Built as a villa (residential)
- Exterior features: Corner lot; Landscaped; Paved; Private maintained road
Interior
- Kitchen: Cooktop; Range; Microwave; Dishwasher; Disposal; Refrigerator; Solid surface and stone counters
- Bedrooms: 2 bedrooms
- Flooring: Ceramic tile
- Bathrooms: 1 full bathroom
- Heating & cooling: Central heating (electric); Central air
- Interior features: Ceiling fans; Living room/dining room combo; Solid surface counters; Stone counters; Walk-in closets; Window shades
- Laundry & utility: Washer and dryer included; Inside laundry; Electric water heater
Neighborhood map
What this means for you Summary
Snapshot
- This is a 2-bed/2.0-bath condo listed at $104k.
Deal economics
- At list price, monthly cash flow is $70 ($838/yr) — positive.
- The deal already cash-flows at list — no discount required.
- Meets the 1% rule at list price ($1k rent vs $104k).
- Cap rate 7.1% vs local median 4.7% in Bayshore Gardens — top-decile yield for the area; either an underpriced asset or a hidden risk that comps aren't pricing in. Stress-test before assuming the spread holds.
Location & tenants
- Location reads 82/100 on livability (#72 in FL, #1,180 nationally) — a professional / high-income tenant draw. Strengths: cost of living A+, housing A+, health & safety A+; Watch: crime C-, commute C-, employment F.
- Manatee (suburban): math 54% / reading 50% proficiency, ranked #26 of 73 in FL (top 36%) — acceptable for families but not a draw, mixed tenant base, ~2y average lease.
- Zoned schools: Bayshore Elementary School (math 51% / reading 36%, grade F, #1,345 of 2,144 statewide, top 64%, 701 students, 72% FRL); Bayshore High School (math 17% / reading 26%, grade F, #546 of 667 statewide, top 82%, 1,435 students, 65% FRL) — zoned schools average 68% FRL vs 51% district-wide (18 pts higher); higher-poverty schools than district average — tighter screening recommended.
- Zoned-school proficiency averages 32% at this address vs 52% district-wide (-20 pts) — the specific schools serving this property underperform the Manatee average; the district grade overstates school quality for this exact location.
- Market conditions: Rents falling (-5.5%/yr); 361 active listings in the ZIP; 40 comparable units currently listed for rent nearby; rentals at typical pace (median 24d on market — plan ~3-4 weeks tenant-placement turnaround); 7,472 units permitted in Manatee County in 2024 (1,782 in 5+ unit buildings).
- This rent runs 39% of the median local income ($45k/yr) — at the standard rent-burdened threshold; future hikes will face affordability resistance.
Forward outlook
- Local home prices are declining (-3.0%/yr); year-one equity from $716 of loan paydown is wiped out by about $3k of value loss. Plan a longer hold.
- Manatee County population projected at +43% by 2050 — long-run rental-demand tailwind backs the buy-and-hold thesis.
Negotiation context
- Only 5 days on market — expect competitive offers; lowballing is unlikely to land.
- Current owner paid $53k; list at $104k implies a 97% gain — meaningful room to come down on a strong offer.
Risks & watch-outs
- Watch-outs: HOA is 32% of rent.
- Climate carrying-cost: severe wind risk, 99% chance of damaging wind over 30y; extreme-heat days projected 7→31/yr by 2055 (HVAC capex compounding) — expect insurance premiums to compound above CPI over the hold.
Questions for the listing agent
- What does the HOA fee cover, when was the last increase, and are there any pending special assessments or reserve-fund shortfalls?
- Any open or pending special assessments — roof, HVAC, plumbing, elevator, façade? What's the per-unit balance and payoff schedule, and is the seller paying it off at close or rolling it to the buyer?
- Is there a deadline driving the sale (1031 exchange, divorce, estate, relocation)? That informs how much negotiation room exists.
- Schools are F-rated, which usually means shorter tenancies and higher turnover. Who's the typical renter profile here, and what's been the actual vacancy rate?
- What's the average days-on-market for RENTAL listings here right now (not sales)? A rising rental-DOM trend means longer vacancies and softer asking-rent achievability than the comps imply.
- What's the recent tenant-quality profile in this submarket — average credit score on applications, eviction rate, late-payment / NSF rate, and stable-employment percentage? A property-management company in the area should have these aggregated.
- How much new apartment / multifamily construction is in the pipeline within 1–3 miles? Heavy new supply (>2% of stock underway) typically softens rents 12–24 months out; light construction supports rent growth.
Investment metrics
- 1% rule
- 1.42% ✓
- Cap rate
- 7.10%
- Cash-on-cash
- 2.89%
- DSCR
- 1.13
- GRM
- 5.9
CMA / ARV
No comps found within radius.
Projected returns pro-forma
-3.0% appreciation · 0.0% rent growth · sell at horizon
- IRR
- -16.6%
- Equity multiple
- 0.44×
- Total profit
- $-16,364
- Equity at exit
- $15,432
- IRR
- -19.7%
- Equity multiple
- 0.17×
- Total profit
- $-24,095
- Equity at exit
- $8,949
Cash invested: $28,980 (down + closing). Projections, not guarantees.
Landlord ↔ Tenant lean methodology
- Overall (STATE)
- 87 Strongly Landlord-Friendly
- State Florida
- 87 Strongly Landlord-Friendly · R+3
- County
- — inherits STATE
- City
- — inherits STATE
ZIP-level market 34207
- Rents YoY
- -5.5%
- Active inventory
- 361
- Price-to-rent
- 5.9×
Monthly cashflow live
- Estimated rent
- $1,465 high interval (Pro) →
- Mortgage (P&I)
- −$543
- Tax from tax record
- −$35 /mo · $417/yr
- Insurance
- −$43
- HOA
- −$467
- Vacancy / Maint / Mgmt
- −$308
- Net cashflow
- $70
Break-even live
UW: 25.0% down · 7.5% · 30yr · 1.5% tax · 5.0% vac · 8.0% maint · 8.0% mgmt
Financing live
Cash to close
- Down payment
- $25,875
- Closing costs
- $3,105
- Reserves months
- —
- Total cash needed
- —
Loan-product check · same deal, 3 products live
Conventional
25% down · 7.5% · 30yr
- Down + closing
- —
- Monthly P&I
- —
- Monthly cashflow
- —
- DSCR
- —
- Eligible?
- —
Personal DTI + credit; lowest rate.
DSCR
20% down · 8.5% · 30yr
- Down + closing
- —
- Monthly P&I
- —
- Monthly cashflow
- —
- DSCR
- —
- Eligible?
- —
No personal income docs; deal must DSCR.
Hard money
10% down · 12.0% · 12mo
- Down + closing
- —
- Monthly P&I
- —
- Monthly cashflow
- —
- DSCR
- —
- Eligible?
- —
Short-term bridge; refi at stabilization.
Rent comps 40 comps
| Address | Beds | Baths | Sqft | Rent | $/sqft | DOM | Units | Dist |
|---|---|---|---|---|---|---|---|---|
| 5996 Hibiscus Dr #6 Bradenton, FL | 2.0 | 1.0 | 865 | $1,550 | $1.79 | 16d | 1 | 0.12mi |
| 6043 Coral Way Bradenton, FL | 2.0 | 1.0 | 865 | $1,700 | $1.97 | 16d | 1 | 0.21mi |
| 2713 60th Avenue Dr W Bradenton, FL | 2.0 | 2.0 | 1076 | $2,000 | $1.86 | 23d | 1 | 0.32mi |
| 2423 60th Ave W Unit K29 Bradenton, FL | 2.0 | 2.0 | 1026 | $1,495 | $1.46 | 23d | 1 | 0.34mi |
| 2547 60th Ave W Unit L-36 Bradenton, FL | 1.0 | 1.0 | 576 | $1,100 | $1.91 | 16d | 1 | 0.34mi |
| 5906 Garden Ln Unit A22 Bradenton, FL | 2.0 | 2.0 | 840 | $1,200 | $1.43 | 3d | 1 | 0.35mi |
| 2028 Canal Dr Unit M26 Bradenton, FL | 1.0 | 1.0 | 576 | $1,050 | $1.82 | 10d | 1 | 0.41mi |
| 5896 Palm Ln Unit C27 Bradenton, FL | 2.0 | 2.0 | 966 | $1,400 | $1.45 | 23d | 1 | 0.42mi |
| 5955 Palm Ln Unit A33 Bradenton, FL | 2.0 | 1.0 | 744 | $1,150 | $1.55 | 14d | 1 | 0.42mi |
| 5858 Welcome Rd Unit J23 Bradenton, FL | 2.0 | 1.0 | 744 | $1,150 | $1.55 | 3d | 1 | 0.46mi |
| 1874 Sunny Dr Unit F32 Bradenton, FL | 2.0 | 1.0 | 744 | $950 | $1.28 | 23d | 1 | 0.47mi |
| 1839 Sunny Dr Unit E36 Bradenton, FL | 1.0 | 1.0 | 576 | $1,350 | $2.34 | 23d | 1 | 0.48mi |
| 1825 Flamingo Blvd Unit O26 Bradenton, FL | 1.0 | 1.0 | 576 | $1,000 | $1.74 | 23d | 1 | 0.48mi |
| 5820 21st St W Bradenton, FL | 3.0 | 2.0 | 1116 | $1,995 | $1.79 | 3d | 1 | 0.49mi |
| 1875 Sunny Dr Unit G32 Bradenton, FL | 1.0 | 1.0 | 576 | $1,100 | $1.91 | 23d | 1 | 0.50mi |
| 1859 Restful Dr Unit L26 Bradenton, FL | 1.0 | 1.0 | 576 | $1,150 | $2.00 | 23d | 1 | 0.51mi |
| 5888 17th St W Unit C23 Bradenton, FL | 1.0 | 1.0 | 576 | $1,100 | $1.91 | 23d | 1 | 0.53mi |
| 1807 Restful Dr Unit N4 Bradenton, FL | 2.0 | 1.0 | 733 | $1,150 | $1.57 | 3d | 1 | 0.54mi |
| 1566 Pleasant Rd Unit J24 Bradenton, FL | 2.0 | 1.0 | 733 | $1,150 | $1.57 | 23d | 1 | 0.57mi |
| 5908 17th St W Unit C36 Bradenton, FL | 1.0 | 1.0 | 576 | $950 | $1.65 | 16d | 1 | 0.58mi |
| 6033 34th St W Bradenton, FL | 2.0 | 2.0 | 942 | $1,550 | $1.64 | 3d | 3 | 0.59mi |
| 6033 34th St W Bradenton, FL | 2.0 | 2.0 | 942 | $1,625 | $1.73 | 2d | 2 | 0.59mi |
| 6033 34th St W Bradenton, FL | 2.0 | 2.0 | 996 | $1,500 | $1.51 | 23d | 2 | 0.59mi |
| 3304 McDill Rd Bradenton, FL | 2.0 | 1.0 | 1044 | $1,695 | $1.62 | 11d | 1 | 0.60mi |
| 6050 34th St W Bradenton, FL | 1.0–2.0 | 1.0 | 734 | $1,610 | $2.19 | 1d | 19 | 0.71mi |
| 1009 W 63rd AVE Bradenton, FL | 2.0 | 2.0 | 815 | $1,495 | $1.83 | 16d | 1 | 0.81mi |
| 3851 59th Ave W Unit 3851 Bradenton, FL | 2.0 | 2.0 | 912 | $1,500 | $1.64 | 23d | 1 | 0.85mi |
| 2305 69th Ave W Bradenton, FL | 2.0 | 2.0 | 1038 | $1,775 | $1.71 | 23d | 1 | 0.86mi |
| 3843 59th Ave W Bradenton, FL | 2.0 | 2.0 | 912 | $1,200 | $1.32 | 23d | 1 | 0.86mi |
| 3848 59th Ave W Bradenton, FL | 2.0 | 2.0 | 912 | $1,395 | $1.53 | 23d | 1 | 0.88mi |
| 5513 18th St W Bradenton, FL | 2.0 | 1.0 | 1000 | $1,499 | $1.50 | 23d | 1 | 0.88mi |
| 3533 59th Ave W Unit 3533 Bradenton, FL | 2.0 | 2.0 | 912 | $1,500 | $1.64 | 16d | 1 | 0.92mi |
| 3773 59th Ave W Bradenton, FL | 2.0 | 2.0 | 912 | $1,595 | $1.75 | 23d | 1 | 0.93mi |
| 3545 59th Ave W #3545 Bradenton, FL | 3.0 | 2.0 | 1037 | $1,600 | $1.54 | 16d | 1 | 0.93mi |
| 3775 59th Ave W Unit 3775 Bradenton, FL | 2.0 | 2.0 | 912 | $3,500 | $3.84 | 23d | 1 | 0.93mi |
| 3527 59th Ave W Unit 3527 Bradenton, FL | 2.0 | 2.0 | 912 | $1,400 | $1.54 | 23d | 1 | 0.94mi |
| 5531 16th St W Unit 5537 Bradenton, FL | 2.0 | 1.0 | 750 | $1,650 | $2.20 | 3d | 1 | 0.95mi |
| 3774 59th Ave W Unit 3774 Bradenton, FL | 2.0 | 2.0 | 912 | $1,350 | $1.48 | 23d | 1 | 0.96mi |
| 3739 59th Ave W Unit 3739 Bradenton, FL | 2.0 | 2.0 | 912 | $1,575 | $1.73 | 16d | 1 | 0.96mi |
| 3646 59th Ave W Unit 3646 Bradenton, FL | 2.0 | 2.0 | 912 | $1,400 | $1.54 | 3d | 1 | 0.99mi |
HOA detail condo
- Monthly dues
- $467 · $5,604/yr
- Likely covers
- waterpool
- Assessments
- None detected in remarks — confirm with the listing agent.
Listing history 6 events
-
2026-06-18days on market $103,500 Active 5 DOM
-
2026-06-17days on market $103,500 Active 4 DOM
-
2026-06-16days on market $103,500 Active 3 DOM
-
2026-06-15days on market $103,500 Active 2 DOM
-
2026-06-13remarks 695-char remark
-
2026-06-13$103,500 Active 1 DOM
ⓘ Source: listings_history table (triggers on properties + properties_extension) + one-shot
backfill from property_details.listing_events for pre-trigger history.
Tax reassessment forecast FL · Resets to sale price
- Current annual tax
- $417 · $35/mo
- Projected year-2 tax
- $859 · $72/mo
- Expected delta
- +$442/yr (+$37/mo · 105.8%)
ⓘ Screening estimate from a state-policy table — verify with the county assessor before closing.
Climate risk First Street
- Flood 1/10 Low FEMA zone X (unshaded) · 0% chance over 30 yrs
- Wildfire 1/10 Low
- Heat 10/10 Extreme 7 d/yr ≥106°F today · 31 d/yr by 30 yrs out
- Wind 10/10 Extreme 99% chance of damaging wind over 30 yrs
- Air quality 2/10 Low 1 unhealthy d/yr today · 2 by 30 yrs out
Nearby sold comps map
Loading sold comps map…
Walkable amenities ~0.75 mi
Loading nearby amenities…
Taxation est. · year 1
- Rental income
- $17,583
- − Mortgage interest
- −$5,798
- − Property taxes
- −$417
- − Insurance
- −$518
- − Repairs & maintenance
- −$1,407
- − Management
- −$1,407
- − HOA
- −$5,604
- − Depreciation
- −$3,011
- Taxable loss
- −$578
- Est. tax savings @ 24.0%
- +$139
- After-tax cash flow
- $977/yr
For passive investors: Depreciation is non-cash, so a rental often shows a tax loss while cash-flowing — sheltering income. Rental losses are passive: they offset passive income freely, and up to $25,000/yr can offset ordinary (W-2) income if you actively participate and your MAGI is under $100k (phasing out to $0 by $150k); unused losses carry forward. On sale, claimed depreciation is recaptured at up to 25%, and gains may owe capital-gains tax (a 1031 exchange can defer both). Figures are a year-1 estimate at your 24.0% rate — not tax advice; consult a CPA.
Schools (NCES district)
- District
- Manatee
- NCES district ID
- 1201230
- Math proficiency
- 54% ▼ -6.00%
- Reading proficiency
- 50% ▼ -2.00%
- Median HH income
- $49,607
- Composite
- 44.43/100
- National rank
- #2806
- State rank
- #26 of 73 in FL
Livability — Bayshore Gardens
- Score
- 82/100
- State rank
- #72
- US rank
- #1180
Category grades
Schools grade is shown separately in the Schools card above.
Census & demographics
- Census place
- Bayshore Gardens, FL
- County
- Manatee County · 416,364 people
- City population
- 33,840
- Metro
- North Port-Sarasota-Bradenton, FL
- Population (ZIP)
- 34,081
- Household income
- $45,010
- Rent vs Own
- Severe rent burden
- 1474.0
Population outlook (Manatee County) Hauer SSP2
- Today (2025)
- 447,342 people
- By 2030
- 488,911 · +9.3%
- By 2040
- 567,934 · +27.0%
- By 2050
- 637,995 · +42.6%
- By 2075
- 781,970 · +74.8%
- By 2100
- 848,272 · +89.6%
Race, ethnicity, and origin ACS 2023
- Neighborhood character
- Diverse neighborhood (Simpson 0.57)
- Race & ethnicity
- White 58% Hispanic / Latino 29% Two or more races 13% Black 7%
- Hispanic origin (detail)
- Mexican 12% Puerto Rican 4% Cuban 3% Dominican 1%
- Common ancestry
- Lithuanian 3% Romanian 2% Slovak 2%
- Foreign-born
- 16% · Canada, Jamaica
- Languages at home
- 74% English-only · Spanish 22% Other Indo-European 1% French/Haitian/Cajun 1%
Political lean MEDSL · Manatee
- 2024 margin
- Strong R (+23.5) · D 37.9% · R 61.4%
- 2008→2024 swing
- -16.5pp toward R · 2008: -7.0pp · 2024: -23.5pp
- All cycles
- 2024: R+23.5 2020: R+16.1 2016: R+17.1 2012: R+12.5 2008: R+7.0
Not yet ingested
- Civics
- —
Market trends
- HPI YoY
- ▼ -305.32%
- Current HPI
- 369.9899
- Rent YoY
- ▼ -5.50%
- Metro
- North Port-Sarasota-Bradenton, FL
- State GDP YoY
- ▲ 3.28%
- F500 in state
- 36
Industry mix (Fortune 500 HQ in FL)
| Industry | F500 HQs | Revenue |
|---|---|---|
| Industrial Technology | 2 | $29B |
|
||
| Insurance | 2 | $17B |
|
||
| Retail | 1 | $60B |
|
||
| Technology Distribution | 1 | $58B |
|
||
| Homebuilding | 1 | $35B |
|
||
| Technology Manufacturing | 1 | $35B |
|
||
Price history
+179.7% since first listed4 events — show timeline
- 2026-06-13 Listed $103,500 Stellar MLS as Distributed by MLS Grid
- 2002-08-23 Sold (Public Records) $52,600 Public Records
- 1999-08-19 Sold (Public Records) $35,500 Public Records
- 1987-04-02 Sold (Public Records) $37,000 Public Records
Property tax history
+7.3%/yrLatest (2025): $417 · +8.8% YoY. Source: county tax records.
Cash-flow waterfall
monthlySold comps — $/sqft
last 12 mo · ≤1 miLoading sold comps…