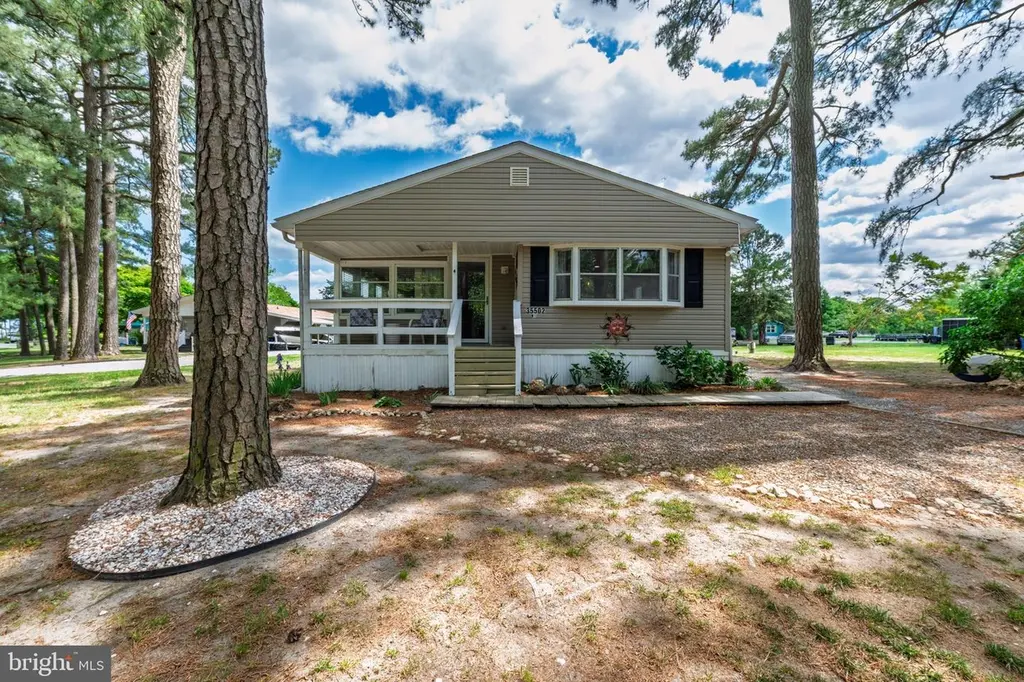
35502 E Harbor Dr · Long Neck, DE
Flood risk 7/10 · Major
- FEMA flood zone
- AE
- Chance of flooding over 30 yrs
- 0.95%
- Est. flood insurance / yr
- $2,026 – $9,024
Fire risk 2/10 · Minimal
- Est. fire insurance / yr
- $476 – $884
Heat risk 8/10 · Major
- Hot days now (above 100°F)
- 7 days/yr
- Hot days in 30 yrs
- 18 days/yr
Wind risk 8/10 · Major
- Chance of severe wind over 30 yrs
- 80.0%
Air-quality risk 2/10 · Minimal
- Unhealthy air days now
- 1 days/yr
- Unhealthy air days in 30 yrs
- 1 days/yr
Risk factors via First Street. Map © Google.
Why this score? — see what drove the C grade
The composite is a weighted blend of 9 inputs, each scored 0–100. Each bar is that input's sub-score; the figure is the points it added to the 100-point composite (weight × sub-score).
- Cash flow +27.0/30.0
- DSCR +9.4/10.0
- 1% rule +7.3/10.0
- Livability +3.5/5.0
- Schools +2.9/10.0
- Rent growth +2.5/5.0
- Condition / age +2.5/5.0
- ARV discount +0.0/15.0
- Appreciation +0.0/10.0
$169,800
🖨 Deal sheet (PDF) 📄 Offer letter ✓ Due diligence
Listing remarks
Welcome to easy coastal living in the desirable White House Beach community. This recently updated 3‑bedroom, 2‑bath home offers a bright, comfortable layout that feels instantly welcoming the moment you step inside. The living area flows smoothly into the kitchen and bedrooms, creating a space that works beautifully for everyday living or a relaxing beach retreat. Set in a well‑loved neighborhood known for its laid‑back lifestyle, water access, and proximity to marinas, dining, and local conveniences, this home delivers strong value for anyone seeking a low‑maintenance, move‑in‑ready option at the beach. A solid choice for full‑time living, a second home, or an easy coastal getaway. Contin
Key facts
- Screened in porch
- Move in ready
- Water access
Tags
Property features AI
Finance
- Financial info: Land lease: $871 monthly (approximately 1 year remaining)
- HOA & community: Community amenities include basketball courts, boat slip, and beach; Pets allowed with no restrictions
Exterior
- Parking: Driveway parking; Two driveway spaces; Two total garage/parking spaces
- Utilities: Public water; Public sewer; Electric service for heating/cooling/hot water
- Home design: Manufactured home; Single-story living implied (all bedrooms and baths on main level)
- Construction: Asphalt roof
- Exterior features: Vinyl siding; Above-grade and below-grade structures noted; Located outside city limits; Federal flood zone
Interior
- Bedrooms: Three main-level bedrooms
- Bathrooms: Two full bathrooms (both on main level)
- Heating & cooling: Electric heating; Electric cooling; Electric hot water
- Interior features: Office; No basement; Accessibility features present
Neighborhood map
What this means for you Summary
Snapshot
- This is a 3-bed/2.0-bath manufactured listed at $170k.
Deal economics
- At list price, monthly cash flow is $17 ($209/yr) — positive.
- The deal already cash-flows at list — no discount required.
- Meets the 1% rule at list price ($2k rent vs $170k).
- Recommended offer: $165k (3.0% below list) — sets the bar for market timing.
- Cap rate 9.7% vs local median 3.4% in Long Neck — top-decile yield for the area; either an underpriced asset or a hidden risk that comps aren't pricing in. Stress-test before assuming the spread holds.
Location & tenants
- Location reads 69/100 on livability (#30 in DE) — a middle-class / working-renter tenant base. Strengths: cost of living A+, housing A+, crime A-; Watch: employment D+, amenities F, commute F.
- Indian River School District (rural): math 25% / reading 41% proficiency, ranked #14 of 26 in DE (top 54%) — families likely to look elsewhere, expect single-tenant / working-renter base with shorter leases.
- Zoned schools: Long Neck Elementary School (math 22% / reading 35%, grade F, #57 of 105 statewide, top 55%, 693 students, 0% FRL); Millsboro Middle School (math 24% / reading 42%, grade F, #14 of 36 statewide, top 37%, 771 students, 0% FRL); Sussex Central High School (math 23% / reading 42%, grade F, #24 of 40 statewide, top 59%, 2,039 students, 0% FRL) — zoned schools average 0% FRL vs 49% district-wide (49 pts lower); this property's tenant base skews higher-income than the district average.
- Market conditions: 870 active listings in the ZIP; solid renter incomes; 4,354 units permitted in Sussex County in 2024 (344 in 5+ unit buildings).
- This rent runs 32% of the median local income ($78k/yr) — at the standard rent-burdened threshold; future hikes will face affordability resistance.
Forward outlook
- Local home prices are declining (-3.0%/yr); year-one equity from $1k of loan paydown is wiped out by about $5k of value loss. Plan a longer hold.
- Sussex County population projected at +25% by 2050 — long-run rental-demand tailwind backs the buy-and-hold thesis.
Negotiation context
- It's been on market 34 days — a 3% lower offer ($165k) is reasonable based on typical stale-listing flexibility.
- 2 sale attempts with the ask held roughly flat each time — persistent listings suggest the price (not the market) is what's stuck; bring a comps-based counter.
Risks & watch-outs
- Watch-outs: flood insurance adds $460/mo.
- Climate carrying-cost: in FEMA flood zone AE (mandatory federal flood insurance); severe wind risk, 80% chance of damaging wind over 30y; extreme-heat days projected 7→18/yr by 2055 (HVAC capex compounding) — expect insurance premiums to compound above CPI over the hold.
Questions for the listing agent
- It's been on market 34 days. Have you received any prior offers? Is the seller open to a 3% concession, seller financing, or rate buy-down credit?
- What's the actual annual flood-insurance premium (NFIP or private), and is the property in a SFHA with mandatory coverage?
- Is there a deadline driving the sale (1031 exchange, divorce, estate, relocation)? That informs how much negotiation room exists.
- Schools are F-rated, which usually means shorter tenancies and higher turnover. Who's the typical renter profile here, and what's been the actual vacancy rate?
- What's the average days-on-market for RENTAL listings here right now (not sales)? A rising rental-DOM trend means longer vacancies and softer asking-rent achievability than the comps imply.
- What's the recent tenant-quality profile in this submarket — average credit score on applications, eviction rate, late-payment / NSF rate, and stable-employment percentage? A property-management company in the area should have these aggregated.
- How much new for-sale + rental construction is in the pipeline within 1–3 miles? Heavy new supply typically softens prices + rents 12–24 months out; constrained supply supports both.
Investment metrics
- 1% rule
- 1.23% ✓
- Cap rate
- 9.67%
- Cash-on-cash
- 12.06%
- DSCR
- 1.54
- GRM
- 6.8
CMA / ARV
- ARV (median comp)
- $133,481
- List price
- $169,800
- Delta
- 29.53%
- Verdict
- OVERPRICED
- Comps
- 20 within 1.0 mi
Projected returns pro-forma
-3.0% appreciation · 3.0% rent growth · sell at horizon
- IRR
- -15.4%
- Equity multiple
- 0.45×
- Total profit
- $-26,091
- Equity at exit
- $25,318
- IRR
- -6.5%
- Equity multiple
- 0.58×
- Total profit
- $-20,014
- Equity at exit
- $14,681
Cash invested: $47,544 (down + closing). Projections, not guarantees.
Landlord ↔ Tenant lean methodology
- Overall (STATE)
- 70 Landlord-Friendly
- State Delaware
- 70 Landlord-Friendly · D+7
- County
- — inherits STATE
- City
- — inherits STATE
ZIP-level market 19966
- Home prices YoY
- -6.4%
- Active inventory
- 870
- Price-to-rent
- 6.8×
Monthly cashflow live
- Estimated rent
- $2,090 medium interval (Pro) →
- Mortgage (P&I)
- −$890
- Tax est. 1.5%
- −$212 /mo · $2,547/yr
- Insurance
- −$71
- Flood insurance flood zone
- −$460 /mo · $5,525/yr
- HOA
- −$0
- Vacancy / Maint / Mgmt
- −$439
- Net cashflow
- $17
Break-even live
Sensitivity live
| Price | -10% $135 | -5% $76 | +0% $17 | +5% $-41 | +10% $-100 |
|---|---|---|---|---|---|
| Rent | -10% $-148 | -5% $-65 | +0% $17 | +5% $100 | +10% $183 |
| Rate | -1.0pp $103 | -0.5pp $61 | base $17 | +0.5pp $-27 | +1.0pp $-71 |
UW: 25.0% down · 7.5% · 30yr · 1.5% tax · 5.0% vac · 8.0% maint · 8.0% mgmt
Financing live
Cash to close
- Down payment
- $42,450
- Closing costs
- $5,094
- Reserves months
- —
- Total cash needed
- —
Loan-product check · same deal, 3 products live
Conventional
25% down · 7.5% · 30yr
- Down + closing
- —
- Monthly P&I
- —
- Monthly cashflow
- —
- DSCR
- —
- Eligible?
- —
Personal DTI + credit; lowest rate.
DSCR
20% down · 8.5% · 30yr
- Down + closing
- —
- Monthly P&I
- —
- Monthly cashflow
- —
- DSCR
- —
- Eligible?
- —
No personal income docs; deal must DSCR.
Hard money
10% down · 12.0% · 12mo
- Down + closing
- —
- Monthly P&I
- —
- Monthly cashflow
- —
- DSCR
- —
- Eligible?
- —
Short-term bridge; refi at stabilization.
Listing history 19 events
-
2026-06-21days on market $169,800 Active 34 DOM
-
2026-06-18days on market $169,800 Active 31 DOM
-
2026-06-17days on market $169,800 Active 30 DOM
-
2026-06-16days on market $169,800 Active 29 DOM
-
2026-06-15days on market $169,800 Active 28 DOM
-
2026-06-14days on market $169,800 Active 26 DOM
-
2026-06-13days on market $169,800 Active 25 DOM
-
2026-06-10days on market $169,800 Active 23 DOM
-
2026-06-09days on market $169,800 Active 22 DOM
-
2026-06-08days on market $169,800 Active 21 DOM
-
2026-06-07pricedays on market $169,800 Active 20 DOM
-
2026-06-02days on market $174,500 Active 15 DOM
-
2026-06-01days on market $174,500 Active 14 DOM
-
2026-05-31days on market $174,500 Active 13 DOM
-
2026-05-30days on market $174,500 Active 12 DOM
-
2026-05-18$174,500 Active 742-char remark
-
2026-05-13historical
-
2026-02-13$172,900 Active
-
2026-02-04historical
ⓘ Source: listings_history table (triggers on properties + properties_extension) + one-shot
backfill from property_details.listing_events for pre-trigger history.
Climate risk First Street
- Flood 7/10 Severe FEMA zone AE · 95% chance over 30 yrs
- Wildfire 2/10 Low
- Heat 8/10 Severe 7 d/yr ≥100°F today · 18 d/yr by 30 yrs out
- Wind 8/10 Severe 80% chance of damaging wind over 30 yrs
- Air quality 2/10 Low 1 unhealthy d/yr today · 1 by 30 yrs out
Nearby sold comps map
Loading sold comps map…
Walkable amenities ~0.75 mi
Loading nearby amenities…
Taxation est. · year 1
- Rental income
- $25,083
- − Mortgage interest
- −$9,511
- − Property taxes
- −$2,547
- − Insurance
- −$6,374
- − Repairs & maintenance
- −$2,007
- − Management
- −$2,007
- − Depreciation
- −$4,940
- Taxable loss
- −$2,303
- Est. tax savings @ 24.0%
- +$553
- After-tax cash flow
- $762/yr
For passive investors: Depreciation is non-cash, so a rental often shows a tax loss while cash-flowing — sheltering income. Rental losses are passive: they offset passive income freely, and up to $25,000/yr can offset ordinary (W-2) income if you actively participate and your MAGI is under $100k (phasing out to $0 by $150k); unused losses carry forward. On sale, claimed depreciation is recaptured at up to 25%, and gains may owe capital-gains tax (a 1031 exchange can defer both). Figures are a year-1 estimate at your 24.0% rate — not tax advice; consult a CPA.
Schools (NCES district)
- District
- Indian River School District
- NCES district ID
- 1000680
- Math proficiency
- 25% ▼ -27.00%
- Reading proficiency
- 41% ▼ -17.00%
- Median HH income
- $53,838
- Composite
- 28.99/100
- National rank
- #6620
- State rank
- #14 of 26 in DE
Livability — Long Neck
- Score
- 69/100
- State rank
- #30
- US rank
- #8720
Category grades
Schools grade is shown separately in the Schools card above.
Census & demographics
- Census place
- Long Neck, DE
- County
- Sussex County · 82,708 people
- Metro
- Salisbury, MD-DE
- Population (ZIP)
- 35,884
- Household income
- $78,305
- Rent vs Own
- Severe rent burden
- 464.0
Population outlook (Sussex County) Hauer SSP2
- Today (2025)
- 248,853 people
- By 2030
- 264,464 · +6.3%
- By 2040
- 290,980 · +16.9%
- By 2050
- 311,259 · +25.1%
- By 2075
- 352,488 · +41.6%
- By 2100
- 367,406 · +47.6%
Race, ethnicity, and origin ACS 2023
- Neighborhood character
- Predominantly White (74%)
- Race & ethnicity
- White 74% Hispanic / Latino 11% Black 8% Two or more races 7% Native American 3% Asian 1%
- Hispanic origin (detail)
- Mexican 3%
- Common ancestry
- Romanian 4% Slovak 2% Serbian 1%
- Foreign-born
- 8% · Canada, China
- Languages at home
- 88% English-only · Spanish 9% Other Indo-European 1%
Political lean MEDSL · Sussex
- 2024 margin
- R (+11.0) · D 43.9% · R 54.9% · Other 1.2%
- 2008→2024 swing
- -2.4pp toward R · 2008: -8.6pp · 2024: -11.0pp
- All cycles
- 2024: R+11.0 2020: R+11.2 2016: R+22.0 2012: R+13.0 2008: R+8.6
Not yet ingested
- Civics
- —
Market trends
- HPI YoY
- ▼ -18.26%
- Current HPI
- 268.5609
- Rent YoY
- —
- Metro
- Salisbury, MD-DE
- State GDP YoY
- —
- F500 in state
- 0
Price history
-1.8% since first listed5 events — show timeline
- 2026-06-07 Price Changed $169,800 BRIGHT MLS
- 2026-05-18 Listed $174,500 BRIGHT MLS
- 2026-05-13 Listing Removed — BRIGHT MLS
- 2026-02-13 Listed $172,900 BRIGHT MLS
- 2026-02-04 Coming Soon — BRIGHT MLS
Property tax history
-4.8%/yrLatest (2025): $238 · -37.9% YoY. Source: county tax records.
Cash-flow waterfall
monthlySold comps — $/sqft
last 12 mo · ≤1 miLoading sold comps…