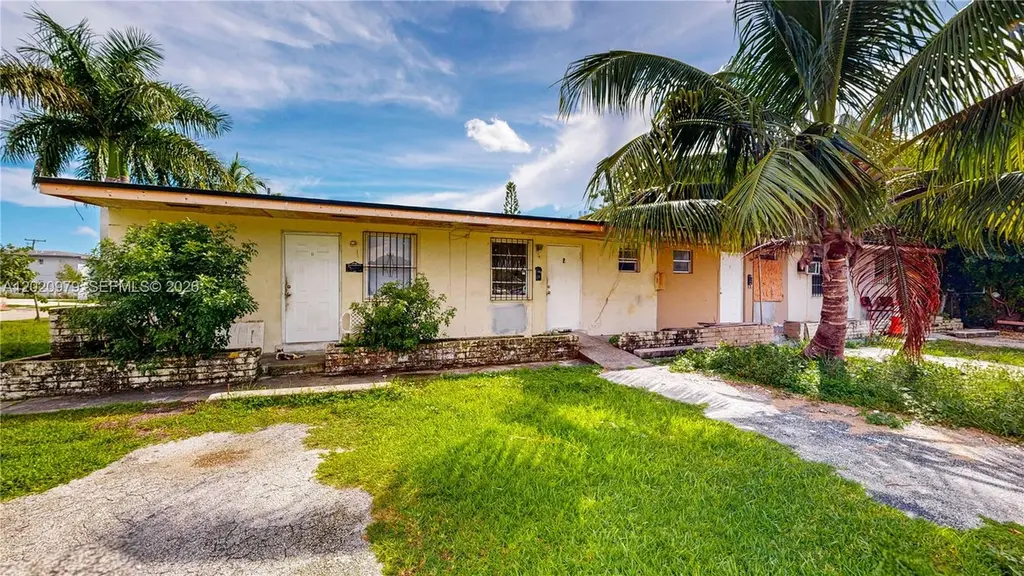
 Fourplex
1478 NW 2nd Ave · Florida City, FL
Flood risk 5/10 · Moderate
- FEMA flood zone
- X (shaded)
- Chance of flooding over 30 yrs
- 0.24%
- Est. flood insurance / yr
- $507 – $1,088
Fire risk 1/10 · Minimal
- Est. fire insurance / yr
- $947 – $1,759
Heat risk 10/10 · Severe
- Hot days now (above 107°F)
- 7 days/yr
- Hot days in 30 yrs
- 32 days/yr
Wind risk 10/10 · Severe
- Chance of severe wind over 30 yrs
- 99.0%
Air-quality risk 2/10 · Minimal
- Unhealthy air days now
- 0 days/yr
- Unhealthy air days in 30 yrs
- 1 days/yr
Risk factors via First Street. Map © Google.
Why this score? — see what drove the C+ grade
The composite is a weighted blend of 9 inputs, each scored 0–100. Each bar is that input's sub-score; the figure is the points it added to the 100-point composite (weight × sub-score).
- Cash flow +26.0/30.0
- DSCR +8.8/10.0
- ARV discount +7.5/15.0
- 1% rule +6.4/10.0
- Schools +4.2/10.0
- Livability +3.2/5.0
- Condition / age +2.5/5.0
- Rent growth +1.8/5.0
- Appreciation +0.0/10.0
$699,000
🖨 Deal sheet (PDF) 📄 Offer letter ✓ Due diligence
Multi-family units
County records classify this as Multi-Family (2-4 Unit). Listing-text estimate: 4 units. confirmed
Listing remarks
GREAT INVESTMENT OPPORTUNITY! Well-maintained fourplex featuring four spacious 1-bedroom, 1-bathroom units with open floor plans. Each unit has separate water and electric meters for added convenience and reduced owner expenses. A new roof ensures long-term durability and minimal maintenance. Prime location near US-1, the Florida Turnpike, top restaurants, shopping centers, Homestead Outlet Mall, and Downtown Homestead. Positioned at the gateway between Miami and the Florida Keys, this property offers strong rental demand and excellent income potential. Don’t miss the 3D virtual tour and floor plan. May the Force be with you!
Key facts
- Strong rental demand
- Prime location
- New roof
Tags
Property features AI
Finance
- Financial info: At least some units currently leased; Listed unit rents around $1,300 per unit
Exterior
- Parking: Total of 4 parking spaces (open parking)
- Utilities: Cable available; Public sewer
- Home design: Single-story building
- Construction: Block construction; Shingle roof; Effective year built
- Exterior features: Less than quarter acre lot; Open parking
Interior
- Kitchen: Each unit includes a kitchen
- Bedrooms: Multiple 1-bedroom units (all unfurnished)
- Flooring: Tile
- Bathrooms: Each unit has 1 full bathroom
- Heating & cooling: Cooling provided by wall/window units
- Interior features: Tile flooring; Wall/window air conditioning units
- Laundry & utility: Trash collection included in rent
Neighborhood map
What this means for you Summary
Snapshot
- This is a 4 × 1-bed/1-bath units multifamily listed at $699k.
Deal economics
- At list price, monthly cash flow is $2k ($21k/yr) — positive. Per door: $436/mo.
- The deal already cash-flows at list — no discount required.
- Meets the 1% rule at list price ($8k rent vs $699k).
- Recommended offer: $689k (1.5% below list) — sets the bar for market timing.
- Cap rate 9.3% vs local median 4.2% in Florida City — top-decile yield for the area; either an underpriced asset or a hidden risk that comps aren't pricing in. Stress-test before assuming the spread holds.
Location & tenants
- Location reads 65/100 on livability (#654 in FL) — a middle-class / working-renter tenant base. Strengths: commute A+, cost of living A+, housing A+; Watch: schools F, crime F, amenities F.
- Miami-Dade (suburban): math 45% / reading 54% proficiency, ranked #40 of 73 in FL (top 55%) — families likely to look elsewhere, expect single-tenant / working-renter base with shorter leases; 64% free/reduced lunch — lower-income household profile, screen leases tightly.
- Market conditions: Rents soft (-2.9%/yr); 615 active listings in the ZIP; 40 comparable units currently listed for rent nearby; rentals at typical pace (median 26d on market — plan ~3-4 weeks tenant-placement turnaround); 10,051 units permitted in Miami-Dade County in 2024 (7,758 in 5+ unit buildings).
- At $7,964/mo this rent would consume 203% of the median local household income ($47k/yr) (locally 1516% of renters already pay >50% of income on rent) — very limited rent-growth headroom before tenants either downsize or default.
Forward outlook
- Local home prices are declining (-3.0%/yr); year-one equity from $5k of loan paydown is wiped out by about $21k of value loss. Plan a longer hold.
- Miami-Dade County population projected at +28% by 2050 — long-run rental-demand tailwind backs the buy-and-hold thesis.
Negotiation context
- It's been on market 30 days — a 2% lower offer ($689k) is reasonable based on typical stale-listing flexibility.
- 4 sale attempts since 12y ago with the ask held roughly flat each time — persistent listings suggest the price (not the market) is what's stuck; bring a comps-based counter.
Risks & watch-outs
- Watch-outs: built in 1956 — expect roof / HVAC / electrical / plumbing capex.
- Climate carrying-cost: moderate flood risk; severe wind risk, 99% chance of damaging wind over 30y; extreme-heat days projected 7→32/yr by 2055 (HVAC capex compounding) — expect insurance premiums to compound above CPI over the hold.
Questions for the listing agent
- Can we see the unit-by-unit rent roll, current vacancy, and any below-market leases? What's the average tenancy length?
- What capital expenditures (roof, boiler, parking lot, exteriors) have been made in the last 5 years, and what's planned in the next 2?
- Built in 1956 — when were the roof, HVAC, electrical panel, plumbing, and water heater last replaced?
- Is there a deadline driving the sale (1031 exchange, divorce, estate, relocation)? That informs how much negotiation room exists.
- Schools are F-rated, which usually means shorter tenancies and higher turnover. Who's the typical renter profile here, and what's been the actual vacancy rate?
- Crime grade is F in this area — have there been break-ins, vandalism, or insurance claims at this property in the last 3 years? What carrier currently insures it and at what premium?
- What's the average days-on-market for RENTAL listings here right now (not sales)? A rising rental-DOM trend means longer vacancies and softer asking-rent achievability than the comps imply.
- What's the recent tenant-quality profile in this submarket — average credit score on applications, eviction rate, late-payment / NSF rate, and stable-employment percentage? A property-management company in the area should have these aggregated.
- How much new apartment / multifamily construction is in the pipeline within 1–3 miles? Heavy new supply (>2% of stock underway) typically softens rents 12–24 months out; light construction supports rent growth.
Investment metrics
- 1% rule
- 1.14% ✓
- Cap rate
- 9.29%
- Cash-on-cash
- 10.70%
- DSCR
- 1.48
- GRM
- 7.3
CMA / ARV
No comps found within radius.
Projected returns pro-forma
-3.0% appreciation · 0.0% rent growth · sell at horizon
- IRR
- -3.6%
- Equity multiple
- 0.87×
- Total profit
- $-25,541
- Equity at exit
- $104,223
- IRR
- 2.5%
- Equity multiple
- 1.16×
- Total profit
- $30,428
- Equity at exit
- $60,437
Cash invested: $195,720 (down + closing). Projections, not guarantees.
Landlord ↔ Tenant lean methodology
- Overall (STATE)
- 87 Strongly Landlord-Friendly
- State Florida
- 87 Strongly Landlord-Friendly · R+3
- County
- — inherits STATE
- City
- — inherits STATE
ZIP-level market 33034
- Home prices YoY
- -5.9%
- Rents YoY
- -2.9%
- Active inventory
- 615
- Price-to-rent
- 29.3×
Monthly cashflow live
- Estimated rent
- $7,964 high interval (Pro) →
- Mortgage (P&I)
- −$3,666
- Tax from tax record
- −$590 /mo · $7,080/yr
- Insurance
- −$291
- HOA
- −$0
- Vacancy / Maint / Mgmt
- −$1,672
- Net cashflow
- $1,745
Break-even live
Sensitivity live
| Price | -10% $2,140 | -5% $1,943 | +0% $1,745 | +5% $1,547 | +10% $1,349 |
|---|---|---|---|---|---|
| Rent | -10% $1,116 | -5% $1,430 | +0% $1,745 | +5% $2,059 | +10% $2,374 |
| Rate | -1.0pp $2,097 | -0.5pp $1,922 | base $1,745 | +0.5pp $1,564 | +1.0pp $1,379 |
4-unit breakdown (identical units grouped — click to expand)
| Units | Beds | Baths | Est. rent |
|---|---|---|---|
| 4× units | 1 | 1 | $7,964 |
| #1 | 1 | 1 | $1,991 |
| #2 | 1 | 1 | $1,991 |
| #3 | 1 | 1 | $1,991 |
| #4 | 1 | 1 | $1,991 |
| Total (4 units) | $7,964 | ||
UW: 25.0% down · 7.5% · 30yr · 1.5% tax · 5.0% vac · 8.0% maint · 8.0% mgmt
Financing live
Cash to close
- Down payment
- $174,750
- Closing costs
- $20,970
- Reserves months
- —
- Total cash needed
- —
Loan-product check · same deal, 3 products live
Conventional
25% down · 7.5% · 30yr
- Down + closing
- —
- Monthly P&I
- —
- Monthly cashflow
- —
- DSCR
- —
- Eligible?
- —
Personal DTI + credit; lowest rate.
DSCR
20% down · 8.5% · 30yr
- Down + closing
- —
- Monthly P&I
- —
- Monthly cashflow
- —
- DSCR
- —
- Eligible?
- —
No personal income docs; deal must DSCR.
Hard money
10% down · 12.0% · 12mo
- Down + closing
- —
- Monthly P&I
- —
- Monthly cashflow
- —
- DSCR
- —
- Eligible?
- —
Short-term bridge; refi at stabilization.
Rent comps 40 comps
| Address | Beds | Baths | Sqft | Rent | $/sqft | DOM | Units | Dist |
|---|---|---|---|---|---|---|---|---|
| 1016 NW 1st Ave Florida City, FL | 4.0 | 3.5 | 1610 | $2,795 | $1.74 | 25d | 1 | 0.16mi |
| 552 NW 7th St Florida City, FL | 3.0 | 2.5 | 1744 | $2,500 | $1.43 | 9d | 1 | 0.48mi |
| 568 NW 7th St Unit 0 Florida City, FL | 4.0 | 2.5 | 1744 | $2,600 | $1.49 | 25d | 1 | 0.49mi |
| 574 NW 7th St #1 Florida City, FL | 3.0 | 2.5 | 1766 | $2,600 | $1.47 | 25d | 1 | 0.51mi |
| 1281 NE 3rd Ave Florida City, FL | 4.0 | 3.0 | 1580 | $3,200 | $2.03 | 23d | 1 | 0.53mi |
| 1281 NE 3rd Ave Unit 1281 Florida City, FL | 4.0 | 3.0 | 1580 | $3,200 | $2.03 | 25d | 1 | 0.53mi |
| 1473 NE 5th Ave Unit 1473 Florida City, FL | 4.0 | 3.0 | 1580 | $3,250 | $2.06 | 25d | 1 | 0.62mi |
| 450 NE 12th St Florida City, FL | 4.0 | 3.0 | 1580 | $3,600 | $2.28 | 6d | 1 | 0.64mi |
| 450 NE 12th St Florida City, FL | 4.0 | 3.0 | 1580 | $3,000 | $1.90 | 18d | 1 | 0.64mi |
| 689 NW 6th St Unit 689 Florida City, FL | 4.0 | 3.0 | 1679 | $3,300 | $1.97 | 25d | 1 | 0.71mi |
| 86 NW 4th St Homestead, FL | 4.0 | 2.0 | 1702 | $3,300 | $1.94 | 18d | 1 | 0.77mi |
| 621 SE 13th Street Cir Unit 1 Homestead, FL | 3.0 | 3.5 | 1694 | $2,500 | $1.48 | 25d | 1 | 0.78mi |
| 621 SE 13th Street Cir Unit 1 Homestead, FL | 3.0 | 3.5 | 1694 | $2,500 | $1.48 | 9d | 1 | 0.78mi |
| 954 NW 14th St Homestead, FL | 3.0 | 2.0 | 2496 | $2,200 | $0.88 | 25d | 1 | 0.79mi |
| 631 SE 13th Street Cir Homestead, FL | 4.0 | 3.5 | 1850 | $3,200 | $1.73 | 25d | 1 | 0.80mi |
| 639 SE 14th Ct Homestead, FL | 3.0 | 3.5 | 2106 | $3,177 | $1.51 | 25d | 1 | 0.82mi |
| 679 SE 13th Street Cir #679 Homestead, FL | 4.0 | 3.5 | 1790 | $3,300 | $1.84 | 25d | 1 | 0.84mi |
| 656 SE 14th Ct Homestead, FL | 3.0 | 3.5 | 1746 | $2,600 | $1.49 | 25d | 1 | 0.85mi |
| 643 SE 15th St Homestead, FL | 3.0 | 2.5 | 1642 | $2,800 | $1.71 | 3d | 1 | 0.85mi |
| 643 SE 15th St Homestead, FL | 3.0 | 2.5 | 1642 | $2,850 | $1.74 | 13d | 1 | 0.85mi |
| 701 SE 13th Street Cir Homestead, FL | 4.0 | 3.5 | 1850 | $3,100 | $1.68 | 25d | 1 | 0.85mi |
| 713 SE 13th Street Cir Homestead, FL | 4.0 | 3.5 | 1742 | $2,700 | $1.55 | 4d | 1 | 0.87mi |
| 713 SE 13th Street Cir Homestead, FL | 4.0 | 3.5 | 1742 | $2,700 | $1.55 | 25d | 1 | 0.87mi |
| 708 SE 13th Ct Homestead, FL | 3.0 | 3.5 | 1694 | $2,700 | $1.59 | 6d | 1 | 0.87mi |
| 708 SE 13th Ct Homestead, FL | 3.0 | 3.5 | 1694 | $2,700 | $1.59 | 25d | 1 | 0.87mi |
| 1323 SE 7th Ter Homestead, FL | 4.0 | 3.5 | 1740 | $2,575 | $1.48 | 25d | 1 | 0.91mi |
| 1371 SE 7th Ter Homestead, FL | 4.0 | 3.5 | 1790 | $3,000 | $1.68 | 3d | 1 | 0.93mi |
| 1371 SE 7th Ter Unit 1371 Homestead, FL | 4.0 | 3.5 | 1790 | $3,000 | $1.68 | 5d | 1 | 0.93mi |
| 728 SE 14th Ct Homestead, FL | 3.0 | 3.5 | 1694 | $3,200 | $1.89 | 25d | 1 | 0.93mi |
| 1427 SE 7th Ter Unit 1427 Homestead, FL | 3.0 | 2.5 | 1642 | $2,750 | $1.67 | 25d | 1 | 0.95mi |
| 507 NE 6th Ct Florida City, FL | 5.0 | 3.0 | 2154 | $3,800 | $1.76 | 23d | 1 | 0.96mi |
| 525 NE 6th Pl Florida City, FL | 4.0 | 3.0 | 2126 | $3,600 | $1.69 | 25d | 1 | 0.99mi |
| 462 NE 6th Pl Florida City, FL | 5.0 | 3.0 | 2580 | $4,000 | $1.55 | 23d | 1 | 1.00mi |
| 213 SW 15th Pl Homestead, FL | 3.0 | 2.0 | 1606 | $2,211 | $1.38 | 0d | 1 | 1.03mi |
| 831 SE 16th Ct Homestead, FL | 3.0 | 2.5 | 1628 | $2,750 | $1.69 | 0d | 1 | 1.04mi |
| 1783 SE 7th Ter Homestead, FL | 4.0 | 3.0 | 1757 | $3,100 | $1.76 | 18d | 1 | 1.05mi |
| 1783 SE 7th Ter Homestead, FL | 4.0 | 3.0 | 1757 | $3,100 | $1.76 | 25d | 1 | 1.05mi |
| 818 SE 17th St Homestead, FL | 3.0 | 3.0 | 1712 | $2,900 | $1.69 | 25d | 1 | 1.06mi |
| 779 SE 18th St Unit 779 Florida City, FL | 3.0 | 2.5 | 1628 | $2,985 | $1.83 | 25d | 1 | 1.07mi |
| 791 SE 18th St Unit 791 Homestead, FL | 3.0 | 2.5 | 1712 | $3,200 | $1.87 | 12d | 1 | 1.08mi |
Listing history 27 events
-
2026-06-21days on market $699,000 Active 30 DOM
-
2026-06-18days on market $699,000 Active 27 DOM
-
2026-06-17days on market $699,000 Active 26 DOM
-
2026-06-16days on market $699,000 Active 25 DOM
-
2026-06-15days on market $699,000 Active 24 DOM
-
2026-06-13days on market $699,000 Active 22 DOM
-
2026-06-09days on market $699,000 Active 18 DOM
-
2026-06-08days on market $699,000 Active 17 DOM
-
2026-06-07days on market $699,000 Active 16 DOM
-
2026-06-04days on market $699,000 Active 13 DOM
-
2026-06-03days on market $699,000 Active 12 DOM
-
2026-06-02days on market $699,000 Active 11 DOM
-
2026-06-01days on market $699,000 Active 10 DOM
-
2026-05-31days on market $699,000 Active 9 DOM
-
2026-05-22$699,000 Active
-
2026-05-22historical
-
2026-02-03$699,000 Active
-
2026-02-03historical
-
2025-12-12price $699,000
-
2025-10-21$799,000 Active
-
2014-11-19soldstatus $1,275,000
-
2014-11-18historical
-
2014-09-03price $164,900
-
2014-08-16price $169,900
-
2014-07-06$179,900 Active
-
2006-07-03soldstatus $182,000
-
1975-02-01soldstatus $196,000
ⓘ Source: listings_history table (triggers on properties + properties_extension) + one-shot
backfill from property_details.listing_events for pre-trigger history.
Tax reassessment forecast FL · Resets to sale price
- Current annual tax
- $7,080 · $590/mo
- Projected year-2 tax
- $7,080 · $590/mo
- Expected delta
- $0/yr ($0/mo · 0.0%)
ⓘ Screening estimate from a state-policy table — verify with the county assessor before closing.
Climate risk First Street
- Flood 5/10 Major FEMA zone X (shaded) · 24% chance over 30 yrs
- Wildfire 1/10 Low
- Heat 10/10 Extreme 7 d/yr ≥107°F today · 32 d/yr by 30 yrs out
- Wind 10/10 Extreme 99% chance of damaging wind over 30 yrs
- Air quality 2/10 Low 0 unhealthy d/yr today · 1 by 30 yrs out
Nearby sold comps map
Loading sold comps map…
Walkable amenities ~0.75 mi
Loading nearby amenities…
Taxation est. · year 1
- Rental income
- $95,568
- − Mortgage interest
- −$39,155
- − Property taxes
- −$7,080
- − Insurance
- −$3,495
- − Repairs & maintenance
- −$7,645
- − Management
- −$7,645
- − Depreciation
- −$20,335
- Taxable income
- $10,213
- Est. tax owed @ 24.0%
- −$2,451
- After-tax cash flow
- $18,485/yr
For passive investors: Depreciation is non-cash, so a rental often shows a tax loss while cash-flowing — sheltering income. Rental losses are passive: they offset passive income freely, and up to $25,000/yr can offset ordinary (W-2) income if you actively participate and your MAGI is under $100k (phasing out to $0 by $150k); unused losses carry forward. On sale, claimed depreciation is recaptured at up to 25%, and gains may owe capital-gains tax (a 1031 exchange can defer both). Figures are a year-1 estimate at your 24.0% rate — not tax advice; consult a CPA.
Schools (NCES district)
- District
- Miami-Dade
- NCES district ID
- 1200390
- Math proficiency
- 45% ▼ -16.00%
- Reading proficiency
- 54% ▼ -5.00%
- Median HH income
- $43,928
- Composite
- 41.76/100
- National rank
- #3397
- State rank
- #40 of 73 in FL
Livability — Florida City
- Score
- 65/100
- State rank
- #654
- US rank
- #13036
Category grades
Schools grade is shown separately in the Schools card above.
Census & demographics
- Census place
- Florida City, FL
- County
- Miami-Dade County · 2,697,751 people
- City population
- 23,823
- Metro
- Miami-Fort Lauderdale-Pompano Beach, FL
- Population (ZIP)
- 23,823
- Household income
- $47,170
- Rent vs Own
- Severe rent burden
- 1516.0
Population outlook (Miami-Dade County) Hauer SSP2
- Today (2025)
- 3,126,439 people
- By 2030
- 3,325,765 · +6.4%
- By 2040
- 3,697,561 · +18.3%
- By 2050
- 4,012,134 · +28.3%
- By 2075
- 4,605,612 · +47.3%
- By 2100
- 4,866,598 · +55.7%
Race, ethnicity, and origin ACS 2023
- Neighborhood character
- Majority Hispanic (62%)
- Race & ethnicity
- Hispanic / Latino 62% Black 28% Two or more races 24% White 8%
- Hispanic origin (detail)
- Mexican 20% Puerto Rican 5% Cuban 13% Dominican 2%
- Common ancestry
- Hispanic 4%
- Foreign-born
- 34% · Canada, Dominican Republic, Guatemala
- Languages at home
- 38% English-only · Spanish 56% French/Haitian/Cajun 5%
Political lean MEDSL · Miami-Dade
- 2024 margin
- R (+11.4) · D 43.9% · R 55.4%
- 2008→2024 swing
- -27.6pp toward R · 2008: 16.1pp · 2024: -11.4pp
- All cycles
- 2024: R+11.4 2020: D+7.3 2016: D+29.6 2012: D+23.7 2008: D+16.1
Not yet ingested
- Civics
- —
Market trends
- HPI YoY
- ▼ -32.64%
- Current HPI
- 521.6856
- Rent YoY
- ▼ -2.85%
- Metro
- Miami-Fort Lauderdale-Pompano Beach, FL
- State GDP YoY
- ▲ 3.28%
- F500 in state
- 36
Industry mix (Fortune 500 HQ in FL)
| Industry | F500 HQs | Revenue |
|---|---|---|
| Industrial Technology | 2 | $29B |
|
||
| Insurance | 2 | $17B |
|
||
| Retail | 1 | $60B |
|
||
| Technology Distribution | 1 | $58B |
|
||
| Homebuilding | 1 | $35B |
|
||
| Technology Manufacturing | 1 | $35B |
|
||
Price history
+256.6% since first listed13 events — show timeline
- 2026-05-22 Listing Removed — MARMLS
- 2026-05-22 Listed $699,000 MARMLS
- 2026-02-03 Listing Removed — MARMLS
- 2026-02-03 Listed $699,000 MARMLS
- 2025-12-12 Price Changed $699,000 MARMLS
- 2025-10-21 Listed $799,000 MARMLS
- 2014-11-19 Sold (Public Records) $1,275,000 Public Records
- 2014-11-18 Listing Removed — MARMLS
- 2014-09-03 Price Changed $164,900 MARMLS
- 2014-08-16 Price Changed $169,900 MARMLS
- 2014-07-06 Listed $179,900 MARMLS
- 2006-07-03 Sold (Public Records) $182,000 Public Records
- 1975-02-01 Sold (Public Records) $196,000 Public Records
Property tax history
+7.7%/yrLatest (2025): $7,080 · +5.9% YoY. Source: county tax records.
Cash-flow waterfall
monthlySold comps — $/sqft
last 12 mo · ≤1 miLoading sold comps…