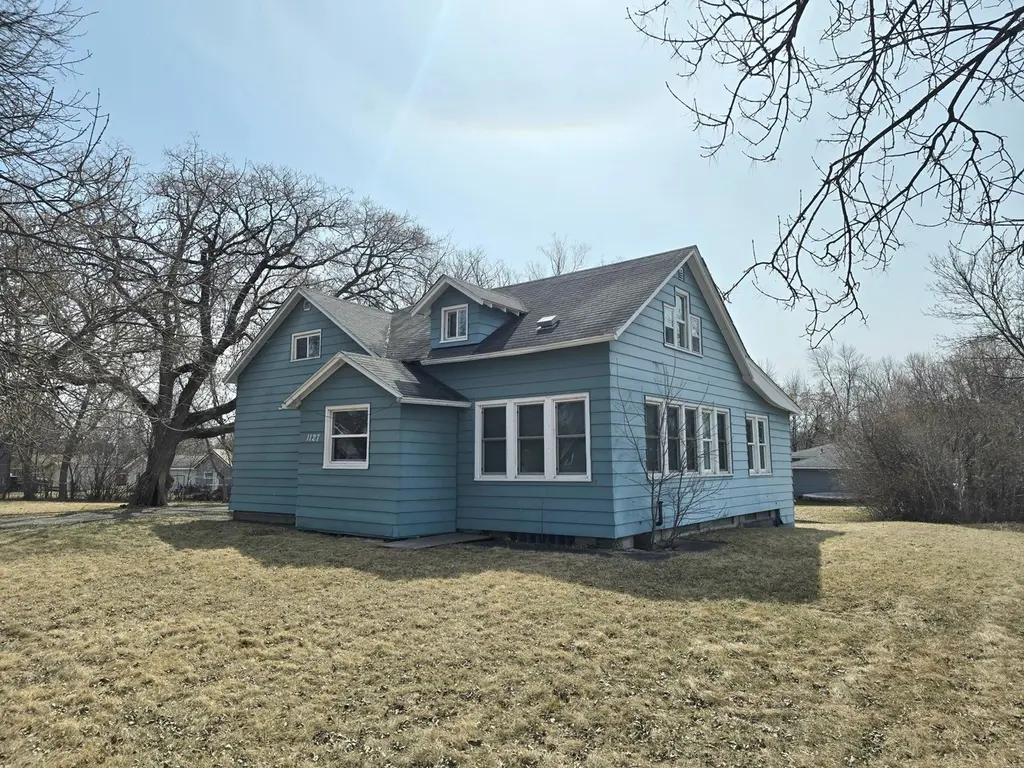
1127 7th St · International Falls, MN
Flood risk 4/10 · Minor
- FEMA flood zone
- X (unshaded)
- Chance of flooding over 30 yrs
- 0.22%
- Est. flood insurance / yr
- $507 – $1,088
Fire risk 3/10 · Minor
- Est. fire insurance / yr
- $888 – $1,650
Heat risk 1/10 · Minimal
- Hot days now (above 91°F)
- 7 days/yr
- Hot days in 30 yrs
- 12 days/yr
Wind risk 1/10 · Minimal
- Chance of severe wind over 30 yrs
- —
Air-quality risk 3/10 · Minor
- Unhealthy air days now
- 3 days/yr
- Unhealthy air days in 30 yrs
- 3 days/yr
Risk factors via First Street. Map © Google.
Why this score? — see what drove the B+ grade
The composite is a weighted blend of 9 inputs, each scored 0–100. Each bar is that input's sub-score; the figure is the points it added to the 100-point composite (weight × sub-score).
- Cash flow +30.0/30.0
- ARV discount +15.0/15.0
- DSCR +10.0/10.0
- 1% rule +8.2/10.0
- Livability +3.7/5.0
- Schools +3.6/10.0
- Rent growth +2.5/5.0
- Condition / age +2.5/5.0
- Appreciation +0.0/10.0
$100,000
🖨 Deal sheet (PDF) 📄 Offer letter ✓ Due diligence
Listing remarks MLS
Spacious 4 bedroom 2+ bath home on a very large corner lot in International Falls. Ample space here with a main level laundry room, informal dining room, and a big and bright living room. The primary bedroom with full bath is also on the main, with three bedrooms and an additional full bath upstairs. Create a garden oasis, or build another garage as this is a nearly half-acre lot!
Key facts
- Nearly half-acre lot
- Informal dining room
- Corner lot
Tags
Neighborhood map
What this means for you Summary
Snapshot
- This is a 4-bed/3.0-bath single-family listed at $100k.
Deal economics
- At list price, monthly cash flow is $379 ($5k/yr) — positive.
- The deal already cash-flows at list — no discount required.
- Meets the 1% rule at list price ($1k rent vs $100k).
- Recommended offer: $88k (12.0% below list) — sets the bar for market timing.
- Cap rate 10.8% vs local median 3.7% in International Falls — top-decile yield for the area; either an underpriced asset or a hidden risk that comps aren't pricing in. Stress-test before assuming the spread holds.
Location & tenants
- Location reads 73/100 on livability (#242 in MN) — a middle-class / working-renter tenant base. Strengths: cost of living A+, housing A+, health & safety A+; Watch: crime F, amenities D-, commute F.
- International Falls School District (town): math 40% / reading 45% proficiency, ranked #211 of 301 in MN (top 70%) — families likely to look elsewhere, expect single-tenant / working-renter base with shorter leases.
- Zoned schools: Falls Elementary (math 52% / reading 52%, grade C-, #368 of 857 statewide, top 47%, 393 students, 49% FRL); Falls Secondary (math 32% / reading 41%, grade F, #298 of 471 statewide, top 63%, 501 students, 38% FRL).
- Market conditions: 71 active listings in the ZIP; 26 units permitted in Koochiching County in 2024 (0 in 5+ unit buildings).
Forward outlook
- Local home prices are declining (-3.0%/yr); year-one equity from $691 of loan paydown is wiped out by about $3k of value loss. Plan a longer hold.
- Koochiching County population projected at -27% by 2050 — secular population decline; favor cash flow + early exit over multi-decade hold.
- At projected returns (-3.0% appreciation + 3.0% rent growth), your $28k cash investment doubles in ~8 years — after that, you're playing with house money.
Negotiation context
- It's been on market 142 days — a 12% lower offer ($88k) is reasonable based on typical stale-listing flexibility.
- 10 sale attempts since 9y ago with the ask held roughly flat each time — persistent listings suggest the price (not the market) is what's stuck; bring a comps-based counter.
- Current owner paid $85k; 18% above their basis — modest negotiation headroom, anchor on the comps not their cost.
Risks & watch-outs
- Watch-outs: built in 1925 — expect roof / HVAC / electrical / plumbing capex.
Questions for the listing agent
- It's been on market 142 days. Have you received any prior offers? Is the seller open to a 12% concession, seller financing, or rate buy-down credit?
- Built in 1925 — when were the roof, HVAC, electrical panel, plumbing, and water heater last replaced?
- Why hasn't it sold? Are there any deal-killer items the seller is aware of (foundation, flood, title, zoning, code violations)?
- Is there a deadline driving the sale (1031 exchange, divorce, estate, relocation)? That informs how much negotiation room exists.
- Crime grade is F in this area — have there been break-ins, vandalism, or insurance claims at this property in the last 3 years? What carrier currently insures it and at what premium?
- What's the average days-on-market for RENTAL listings here right now (not sales)? A rising rental-DOM trend means longer vacancies and softer asking-rent achievability than the comps imply.
- What's the recent tenant-quality profile in this submarket — average credit score on applications, eviction rate, late-payment / NSF rate, and stable-employment percentage? A property-management company in the area should have these aggregated.
- How much new for-sale + rental construction is in the pipeline within 1–3 miles? Heavy new supply typically softens prices + rents 12–24 months out; constrained supply supports both.
Investment metrics
- 1% rule
- 1.32% ✓
- Cap rate
- 10.84%
- Cash-on-cash
- 16.23%
- DSCR
- 1.72
- GRM
- 6.3
CMA / ARV
- ARV (median comp)
- $134,459
- List price
- $100,000
- Delta
- -25.63%
- Verdict
- UNDERPRICED
- Comps
- 5 within 1.0 mi
Show comp detail 1 sale within ~0.75 mi
| Address | Dist | Beds/Ba | Sqft | Sold | Price | $/sf | Match |
|---|---|---|---|---|---|---|---|
| 1000 7th St | 0.19mi | 3/2.0 (-1) | 1,456 (+14%) | 16mo | $62,500 | $43 | 45 |
Match score weights: distance 35% · size 25% · config 20% · recency 20%. Top-matched comps best support the ARV.
Projected returns pro-forma
-3.0% appreciation · 3.0% rent growth · sell at horizon
- IRR
- 7.2%
- Equity multiple
- 1.28×
- Total profit
- $7,922
- Equity at exit
- $14,910
- IRR
- 16.5%
- Equity multiple
- 2.36×
- Total profit
- $37,968
- Equity at exit
- $8,646
Cash invested: $28,000 (down + closing). Projections, not guarantees.
Landlord ↔ Tenant lean methodology
- Overall (STATE)
- 46 Balanced
- State Minnesota
- 46 Balanced · D+2
- County
- — inherits STATE
- City
- — inherits STATE
ZIP-level market 56649
- Home prices YoY
- -22.7%
- Active inventory
- 71
- Price-to-rent
- 6.3×
Monthly cashflow live
- Estimated rent
- $1,316 medium interval (Pro) →
- Mortgage (P&I)
- −$524
- Tax from tax record
- −$94 /mo · $1,134/yr
- Insurance
- −$42
- HOA
- −$0
- Lot rent
- −$0
- Vacancy / Maint / Mgmt
- −$276
- Net cashflow
- $379
Break-even live
Sensitivity live
| Price | -10% $435 | -5% $407 | +0% $379 | +5% $350 | +10% $322 |
|---|---|---|---|---|---|
| Rent | -10% $275 | -5% $327 | +0% $379 | +5% $431 | +10% $483 |
| Rate | -1.0pp $429 | -0.5pp $404 | base $379 | +0.5pp $353 | +1.0pp $327 |
UW: 25.0% down · 7.5% · 30yr · 1.5% tax · 5.0% vac · 8.0% maint · 8.0% mgmt
Financing live
Cash to close
- Down payment
- $25,000
- Closing costs
- $3,000
- Reserves months
- —
- Total cash needed
- —
Loan-product check · same deal, 3 products live
Conventional
25% down · 7.5% · 30yr
- Down + closing
- —
- Monthly P&I
- —
- Monthly cashflow
- —
- DSCR
- —
- Eligible?
- —
Personal DTI + credit; lowest rate.
DSCR
20% down · 8.5% · 30yr
- Down + closing
- —
- Monthly P&I
- —
- Monthly cashflow
- —
- DSCR
- —
- Eligible?
- —
No personal income docs; deal must DSCR.
Hard money
10% down · 12.0% · 12mo
- Down + closing
- —
- Monthly P&I
- —
- Monthly cashflow
- —
- DSCR
- —
- Eligible?
- —
Short-term bridge; refi at stabilization.
Listing history 44 events
-
2026-06-22days on market $100,000 Active 142 DOM
-
2026-06-21days on market $100,000 Active 141 DOM
-
2026-06-21days on market $100,000 Active 140 DOM
-
2026-06-18days on market $100,000 Active 138 DOM
-
2026-06-17days on market $100,000 Active 137 DOM
-
2026-06-16days on market $100,000 Active 136 DOM
-
2026-06-15days on market $100,000 Active 135 DOM
-
2026-06-13days on market $100,000 Active 133 DOM
-
2026-06-12days on market $100,000 Active 132 DOM
-
2026-06-09days on market $100,000 Active 129 DOM
-
2026-06-08days on market $100,000 Active 128 DOM
-
2026-06-07days on market $100,000 Active 127 DOM
-
2026-06-07days on market $100,000 Active 126 DOM
-
2026-06-04days on market $100,000 Active 123 DOM
-
2026-06-02days on market $100,000 Active 122 DOM
-
2026-06-01days on market $100,000 Active 121 DOM
-
2026-05-31days on market $100,000 Active 120 DOM
-
2026-05-31days on market $100,000 Active 119 DOM
-
2026-01-24status Active
-
2026-01-23$100,000 Active 383-char remark
Show marketing remark (383 chars)
Spacious 4 bedroom 2+ bath home on a very large corner lot in International Falls. Ample space here with a main level laundry room, informal dining room, and a big and bright living room. The primary bedroom with full bath is also on the main, with three bedrooms and an additional full bath upstairs. Create a garden oasis, or build another garage as this is a nearly half-acre lot!
-
2025-12-18historical
-
2025-12-16status Active
-
2025-06-16historical
-
2025-06-11status Pending
-
2025-05-06historical Contingent - Inspection
-
2025-04-22price $100,000
-
2025-04-22$100,000 Active
-
2025-04-21$10,000 Active
-
2024-07-08soldstatus $85,000
-
2024-07-03soldstatus $85,000 Closed
-
2024-07-03soldstatus $85,000 Sold
-
2024-06-28status Pending
-
2024-05-27historical Contingent - Inspection
-
2024-05-26status Pending
-
2024-05-15$85,000 Active
-
2024-05-15$85,000 Active
-
2021-10-11historical
-
2021-08-12price $53,000
-
2021-03-10$58,000 Active
-
2020-11-07historical
-
2019-11-07$68,000 Active
-
2018-04-13historical
-
2017-08-11$68,000
-
2012-06-28soldstatus $58,000
ⓘ Source: listings_history table (triggers on properties + properties_extension) + one-shot
backfill from property_details.listing_events for pre-trigger history.
Tax reassessment forecast MN · Partial reset (capped growth)
- Current annual tax
- $1,134 · $94/mo
- Projected year-2 tax
- $1,134 · $94/mo
- Expected delta
- $0/yr ($0/mo · 0.0%)
ⓘ Screening estimate from a state-policy table — verify with the county assessor before closing.
Climate risk First Street
- Flood 4/10 Moderate FEMA zone X (unshaded) · 22% chance over 30 yrs
- Wildfire 3/10 Moderate
- Heat 1/10 Low 7 d/yr ≥91°F today · 12 d/yr by 30 yrs out
- Wind 1/10 Low
- Air quality 3/10 Moderate 3 unhealthy d/yr today · 3 by 30 yrs out
Nearby sold comps map
Loading sold comps map…
Walkable amenities ~0.75 mi
Loading nearby amenities…
Taxation est. · year 1
- Rental income
- $15,788
- − Mortgage interest
- −$5,602
- − Property taxes
- −$1,134
- − Insurance
- −$500
- − Repairs & maintenance
- −$1,263
- − Management
- −$1,263
- − Depreciation
- −$2,909
- Taxable income
- $3,117
- Est. tax owed @ 24.0%
- −$748
- After-tax cash flow
- $3,797/yr
For passive investors: Depreciation is non-cash, so a rental often shows a tax loss while cash-flowing — sheltering income. Rental losses are passive: they offset passive income freely, and up to $25,000/yr can offset ordinary (W-2) income if you actively participate and your MAGI is under $100k (phasing out to $0 by $150k); unused losses carry forward. On sale, claimed depreciation is recaptured at up to 25%, and gains may owe capital-gains tax (a 1031 exchange can defer both). Figures are a year-1 estimate at your 24.0% rate — not tax advice; consult a CPA.
Schools (NCES district)
- District
- International Falls School District
- NCES district ID
- 2715000
- Math proficiency
- 40% ▼ -14.00%
- Reading proficiency
- 45% ▼ -18.00%
- Median HH income
- $42,926
- Composite
- 35.88/100
- National rank
- #4813
- State rank
- #211 of 301 in MN
Livability — International Falls
- Score
- 73/100
- State rank
- #242
- US rank
- #5197
Category grades
Schools grade is shown separately in the Schools card above.
Census & demographics
- Census place
- International Falls, MN
- Population (ZIP)
- 8,895
Population outlook (Koochiching County) Hauer SSP2
- Today (2025)
- 11,977 people
- By 2030
- 11,406 · -4.8%
- By 2040
- 10,045 · -16.1%
- By 2050
- 8,746 · -27.0%
- By 2075
- 6,363 · -46.9%
- By 2100
- 4,275 · -64.3%
Race, ethnicity, and origin ACS 2023
- Neighborhood character
- Predominantly White (90%)
- Race & ethnicity
- White 90% Two or more races 7% Native American 2% Hispanic / Latino 2%
- Common ancestry
- Portuguese 20% Lithuanian 5% Romanian 3%
- Foreign-born
- 3% · Canada
- Languages at home
- 98% English-only · Spanish 1%
Political lean MEDSL · Koochiching
- 2024 margin
- Strong R (+25.7) · D 36.4% · R 62.0% · Other 1.6%
- 2008→2024 swing
- -35.8pp toward R · 2008: 10.1pp · 2024: -25.7pp
- All cycles
- 2024: R+25.7 2020: R+21.3 2016: R+20.0 2012: D+9.5 2008: D+10.1
Not yet ingested
- Civics
- —
Market trends
- HPI YoY
- ▼ -51.62%
- Current HPI
- 176.118
- Rent YoY
- —
- Metro
- —
- State GDP YoY
- ▲ 2.41%
- F500 in state
- 34
Industry mix (Fortune 500 HQ in MN)
| Industry | F500 HQs | Revenue |
|---|---|---|
| Healthcare | 2 | $407B |
|
||
| Retail | 2 | $150B |
|
||
| Consumer Goods | 2 | $32B |
|
||
| Industrial Machinery | 2 | $6B |
|
||
| Agriculture | 1 | $40B |
|
||
| Healthcare / Medical Devices | 1 | $32B |
|
||
Price history
+72.4% since first listed26 events — show timeline
- 2026-01-24 Relisted — RAOR
- 2026-01-23 Listed $100,000 NORTHSTARMLS as Distributed by MLS Grid
- 2025-12-18 Delisted — RAOR
- 2025-12-16 Relisted — RAOR
- 2025-06-16 Delisted — RAOR
- 2025-06-11 Pending — RAOR
- 2025-05-06 Contingent — NORTHSTARMLS as Distributed by MLS Grid
- 2025-04-22 Price Changed $100,000 NORTHSTARMLS as Distributed by MLS Grid
- 2025-04-22 Listed $100,000 RAOR
- 2025-04-21 Listed $10,000 NORTHSTARMLS as Distributed by MLS Grid
- 2024-07-08 Sold (Public Records) $85,000 Public Records
- 2024-07-03 Sold (MLS) $85,000 NORTHSTARMLS as Distributed by MLS Grid
- 2024-07-03 Sold (MLS) $85,000 RAOR
- 2024-06-28 Pending — NORTHSTARMLS as Distributed by MLS Grid
- 2024-05-27 Contingent — NORTHSTARMLS as Distributed by MLS Grid
- 2024-05-26 Pending — RAOR
- 2024-05-15 Listed $85,000 RAOR
- 2024-05-15 Listed $85,000 NORTHSTARMLS as Distributed by MLS Grid
- 2021-10-11 Listing Removed — NORTHSTARMLS as Distributed by MLS Grid
- 2021-08-12 Price Changed $53,000 NORTHSTARMLS as Distributed by MLS Grid
- 2021-03-10 Listed $58,000 NORTHSTARMLS as Distributed by MLS Grid
- 2020-11-07 Listing Removed — NORTHSTARMLS as Distributed by MLS Grid
- 2019-11-07 Listed $68,000 NORTHSTARMLS as Distributed by MLS Grid
- 2018-04-13 Listing Removed — NORTHSTARMLS as Distributed by MLS Grid
- 2017-08-11 Listed $68,000 NORTHSTARMLS as Distributed by MLS Grid
- 2012-06-28 Sold (Public Records) $58,000 Public Records
Property tax history
+9.3%/yrLatest (2026): $1,134 · +7.4% YoY. Source: county tax records.
Cash-flow waterfall
monthlySold comps — $/sqft
last 12 mo · ≤1 miLoading sold comps…