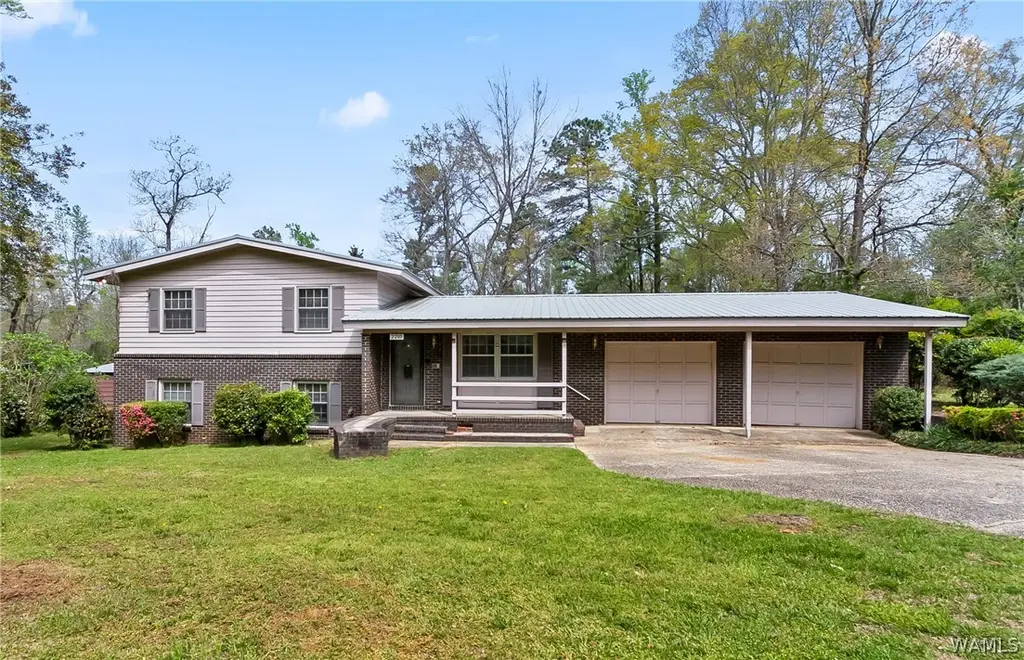
2210 Lavera Drive Dr · Tuscaloosa, AL
Flood risk 1/10 · Minimal
- FEMA flood zone
- X (unshaded)
- Chance of flooding over 30 yrs
- 0.0%
- Est. flood insurance / yr
- $473 – $860
Fire risk 3/10 · Minor
- Est. fire insurance / yr
- $916 – $1,700
Heat risk 7/10 · Major
- Hot days now (above 108°F)
- 6 days/yr
- Hot days in 30 yrs
- 17 days/yr
Wind risk 6/10 · Moderate
- Chance of severe wind over 30 yrs
- 56.0%
Air-quality risk 3/10 · Minor
- Unhealthy air days now
- 2 days/yr
- Unhealthy air days in 30 yrs
- 3 days/yr
Risk factors via First Street. Map © Google.
Why this score? — see what drove the C+ grade
The composite is a weighted blend of 9 inputs, each scored 0–100. Each bar is that input's sub-score; the figure is the points it added to the 100-point composite (weight × sub-score).
- Cash flow +22.3/30.0
- ARV discount +15.0/15.0
- DSCR +7.1/10.0
- 1% rule +4.6/10.0
- Rent growth +4.2/5.0
- Livability +3.9/5.0
- Schools +2.5/10.0
- Condition / age +2.5/5.0
- Appreciation +0.0/10.0
$199,500
🖨 Deal sheet 📄 Offer letter ✓ Due diligence
Listing remarks MLS
Spacious 4-bedroom split-level home on Lavera Drive offering 1,896 sq ft and great potential. The main level includes the kitchen, formal living room, and a sunroom overlooking the backyard. Downstairs, you’ll find a spacious den with walk-out access, providing additional living or entertaining space. The property also includes a two-car garage with expansive storage, offering plenty of room for tools, hobbies, or extra belongings. With great potential, this home presents an excellent opportunity for investors or buyers with vision to update and make it their own. Call today!
Key facts
- Kitchen
- Backyard
- Sunroom
Tags
Neighborhood map
What this means for you Summary
Snapshot
- This is a 4-bed/1.0-bath single-family listed at $200k.
Deal economics
- At list price, monthly cash flow is $329 ($4k/yr) — positive.
- The deal already cash-flows at list — no discount required.
- To meet the 1% rule (rent ≥ 1% of price), the offer needs to be $192k (3.6% below list).
- Recommended offer: $188k (6.0% below list) — sets the bar for market timing.
- Cap rate 8.3% vs local median 3.4% in Tuscaloosa — top-decile yield for the area; either an underpriced asset or a hidden risk that comps aren't pricing in. Stress-test before assuming the spread holds.
Location & tenants
- Location reads 77/100 on livability (#9 in AL, #2,909 nationally) — a middle-class / working-renter tenant base. Strengths: amenities A+, health & safety A+, cost of living A; Watch: crime F, employment D-.
- Tuscaloosa City (urban): math 19% / reading 40% proficiency, ranked #74 of 129 in AL (top 57%) — low school quality limits family demand, transient renter base, plan for 1-2y turnover.
- Market conditions: Rents rising fast (+6.8%/yr); 167 active listings in the ZIP; 9 comparable units currently listed for rent nearby; rentals at typical pace (median 21d on market — plan ~3-4 weeks tenant-placement turnaround); 622 units permitted in Tuscaloosa County in 2024 (69 in 5+ unit buildings).
- At $1,923/mo this rent would consume 47% of the median local household income ($49k/yr) (locally 1531% of renters already pay >50% of income on rent) — very limited rent-growth headroom before tenants either downsize or default.
Forward outlook
- Local home prices are declining (-3.0%/yr); year-one equity from $1k of loan paydown is wiped out by about $6k of value loss. Plan a longer hold.
- Tuscaloosa County population projected at +26% by 2050 — long-run rental-demand tailwind backs the buy-and-hold thesis.
- At projected returns (-3.0% appreciation + 6.8% rent growth), your $56k cash investment doubles in ~10 years — after that, you're playing with house money.
Negotiation context
- It's been on market 73 days — a 6% lower offer ($188k) is reasonable based on typical stale-listing flexibility.
- 2 sale attempts; this cycle's ask has dropped $28k (12%) from the opening price — seller is motivated, your offer sets the floor, not the list.
Risks & watch-outs
- Climate carrying-cost: major wind risk, 56% chance of damaging wind over 30y; extreme-heat days projected 6→17/yr by 2055 (HVAC capex compounding) — expect insurance premiums to compound above CPI over the hold.
Questions for the listing agent
- It's been on market 73 days. Have you received any prior offers? Is the seller open to a 6% concession, seller financing, or rate buy-down credit?
- Built in 1965 — when were the roof, HVAC, electrical panel, plumbing, and water heater last replaced?
- Why hasn't it sold? Are there any deal-killer items the seller is aware of (foundation, flood, title, zoning, code violations)?
- Is there a deadline driving the sale (1031 exchange, divorce, estate, relocation)? That informs how much negotiation room exists.
- Crime grade is F in this area — have there been break-ins, vandalism, or insurance claims at this property in the last 3 years? What carrier currently insures it and at what premium?
- What's the average days-on-market for RENTAL listings here right now (not sales)? A rising rental-DOM trend means longer vacancies and softer asking-rent achievability than the comps imply.
- What's the recent tenant-quality profile in this submarket — average credit score on applications, eviction rate, late-payment / NSF rate, and stable-employment percentage? A property-management company in the area should have these aggregated.
- How much new for-sale + rental construction is in the pipeline within 1–3 miles? Heavy new supply typically softens prices + rents 12–24 months out; constrained supply supports both.
Investment metrics
- 1% rule
- 0.96% ✗
- Cap rate
- 8.27%
- Cash-on-cash
- 7.07%
- DSCR
- 1.31
- GRM
- 8.6
CMA / ARV
- ARV (median comp)
- $255,903
- List price
- $199,500
- Delta
- -22.04%
- Verdict
- UNDERPRICED
- Comps
- 20 within 1.0 mi
Show comp detail 12 sales within ~0.75 mi
| Address | Dist | Beds/Ba | Sqft | Sold | Price | $/sf | Match |
|---|---|---|---|---|---|---|---|
| 2237 Lavera Dr | 0.06mi | 3/1.0 (-1) | 1,234 (+4%) | 4mo | $155,000 | $126 | 83 |
| 1432 20th Ave E | 0.18mi | 3/1.0 (-1) | 1,154 (-3%) | 2mo | $165,000 | $143 | 80 |
| 1630 23rd Ave Ave E | 0.11mi | 4/3.0 | 1,208 (+2%) | 6mo | $117,000 | $97 | 79 |
| 1402 14th St E | 0.53mi | 3/1.0 (-1) | 1,200 (+1%) | 0mo | $194,900 | $162 | 68 |
| 1816 24th Ave E | 0.21mi | 3/1.5 (-1) | 1,228 (+3%) | 12mo | $180,000 | $147 | 68 |
| 1401 14th St E | 0.52mi | 3/2.0 (-1) | 1,206 (+2%) | 5mo | $144,500 | $120 | 60 |
| 1613 18th Ave E | 0.25mi | 3/2.0 (-1) | 1,320 (+11%) | 2mo | $192,000 | $145 | 59 |
| 1913 14th Street St E | 0.29mi | 3/1.0 (-1) | 1,088 (-8%) | 12mo | $167,500 | $154 | 58 |
| 1309 13th St E | 0.60mi | 4/2.0 | 1,200 (+1%) | 11mo | $195,000 | $163 | 57 |
| 1135 14th Place Pl E | 0.66mi | 3/2.0 (-1) | 1,216 (+2%) | 0mo | $225,000 | $185 | 56 |
| 2726 Loop Rd | 0.73mi | 3/2.0 (-1) | 1,175 (-1%) | 4mo | $200,000 | $170 | 52 |
| 1119 23rd Ave Ave E | 0.44mi | 3/2.0 (-1) | 1,056 (-11%) | 11mo | $195,000 | $185 | 43 |
Match score weights: distance 35% · size 25% · config 20% · recency 20%. Top-matched comps best support the ARV.
Projected returns pro-forma
-3.0% appreciation · 6.81% rent growth · sell at horizon
- IRR
- -1.7%
- Equity multiple
- 0.93×
- Total profit
- $-3,794
- Equity at exit
- $29,746
- IRR
- 11.3%
- Equity multiple
- 2.03×
- Total profit
- $57,316
- Equity at exit
- $17,249
Cash invested: $55,860 (down + closing). Projections, not guarantees.
Landlord ↔ Tenant lean methodology
- Overall (STATE)
- 90 Strongly Landlord-Friendly
- State Alabama
- 90 Strongly Landlord-Friendly · R+15
- County
- — inherits STATE
- City
- — inherits STATE
ZIP-level market 35404
- Rents YoY
- 6.8%
- Active inventory
- 167
- Price-to-rent
- 8.6×
Monthly cashflow live
- Estimated rent
- $1,923 high interval (Pro) →
- Mortgage (P&I)
- −$1,046
- Tax from tax record
- −$61 /mo · $730/yr
- Insurance
- −$83
- HOA
- −$0
- Vacancy / Maint / Mgmt
- −$404
- Net cashflow
- $329
Break-even live
UW: 25.0% down · 7.5% · 30yr · 1.5% tax · 5.0% vac · 8.0% maint · 8.0% mgmt
Financing live
Cash to close
- Down payment
- $49,875
- Closing costs
- $5,985
- Reserves months
- —
- Total cash needed
- —
Loan-product check · same deal, 3 products live
Conventional
25% down · 7.5% · 30yr
- Down + closing
- —
- Monthly P&I
- —
- Monthly cashflow
- —
- DSCR
- —
- Eligible?
- —
Personal DTI + credit; lowest rate.
DSCR
20% down · 8.5% · 30yr
- Down + closing
- —
- Monthly P&I
- —
- Monthly cashflow
- —
- DSCR
- —
- Eligible?
- —
No personal income docs; deal must DSCR.
Hard money
10% down · 12.0% · 12mo
- Down + closing
- —
- Monthly P&I
- —
- Monthly cashflow
- —
- DSCR
- —
- Eligible?
- —
Short-term bridge; refi at stabilization.
Rent comps 9 comps
| Address | Beds | Baths | Sqft | Rent | $/sqft | DOM | Units | Dist |
|---|---|---|---|---|---|---|---|---|
| 1722 13th St E Tuscaloosa, AL | 3.0 | 1.0 | 1200 | $1,100 | $0.92 | 43d | 1 | 0.46mi |
| 1010 23rd Ave E Tuscaloosa, AL | 3.0 | 2.0 | 1251 | $1,500 | $1.20 | 43d | 1 | 0.54mi |
| 927 Kicker Rd Tuscaloosa, AL | 3.0 | 3.0 | 1412 | $3,075 | $2.18 | 20d | 2 | 0.65mi |
| 1305 12th St E Tuscaloosa, AL | 4.0 | 2.0 | 1377 | $1,615 | $1.17 | 20d | 1 | 0.66mi |
| 30 Beverly Hts Tuscaloosa, AL | 3.0 | 2.0 | 1100 | $2,100 | $1.91 | 13d | 1 | 0.76mi |
| 3218 Veterans Memorial Pkwy Tuscaloosa, AL | 3.0 | 3.0–3.5 | 1484 | $1,950 | $1.31 | 20d | 1 | 0.85mi |
| 1901 5th Ave E Tuscaloosa, AL | 3.0 | 3.0 | 1336 | $2,300 | $1.72 | 20d | 1 | 1.22mi |
| 302 22nd St E Tuscaloosa, AL | 3.0 | 2.0 | 1150 | $1,475 | $1.28 | 20d | 1 | 1.42mi |
| 3550 Crescent Gardens Dr Tuscaloosa, AL | 3.0 | 2.0 | 1116 | $1,575 | $1.41 | 43d | 1 | 1.48mi |
Listing history 19 events
-
2026-06-18days on market $199,500 Active 73 DOM
-
2026-06-17days on market $199,500 Active 72 DOM
-
2026-06-16days on market $199,500 Active 71 DOM
-
2026-06-15days on market $199,500 Active 70 DOM
-
2026-06-14days on market $199,500 Active 68 DOM
-
2026-06-13pricedays on market $199,500 Active 67 DOM
-
2026-06-10days on market $218,000 Active 65 DOM
-
2026-06-09days on market $218,000 Active 64 DOM
-
2026-06-08days on market $218,000 Active 63 DOM
-
2026-06-07days on market $218,000 Active 62 DOM
-
2026-06-05days on market $218,000 Active 59 DOM
-
2026-06-03days on market $218,000 Active 58 DOM
-
2026-06-02days on market $218,000 Active 57 DOM
-
2026-06-01days on market $218,000 Active 56 DOM
-
2026-05-31days on market $218,000 Active 55 DOM
-
2026-05-30days on market $218,000 Active 54 DOM
-
2026-04-27status Active 588-char remark
Show marketing remark (588 chars)
Spacious 4-bedroom split-level home on Lavera Drive offering 1,896 sq ft and great potential. The main level includes the kitchen, formal living room, and a sunroom overlooking the backyard. Downstairs, you’ll find a spacious den with walk-out access, providing additional living or entertaining space. The property also includes a two-car garage with expansive storage, offering plenty of room for tools, hobbies, or extra belongings. With great potential, this home presents an excellent opportunity for investors or buyers with vision to update and make it their own. Call today!
-
2026-04-15status Pending 588-char remark
Show marketing remark (588 chars)
Spacious 4-bedroom split-level home on Lavera Drive offering 1,896 sq ft and great potential. The main level includes the kitchen, formal living room, and a sunroom overlooking the backyard. Downstairs, you’ll find a spacious den with walk-out access, providing additional living or entertaining space. The property also includes a two-car garage with expansive storage, offering plenty of room for tools, hobbies, or extra belongings. With great potential, this home presents an excellent opportunity for investors or buyers with vision to update and make it their own. Call today!
-
2026-03-25$228,000 Active 588-char remark
Show marketing remark (588 chars)
Spacious 4-bedroom split-level home on Lavera Drive offering 1,896 sq ft and great potential. The main level includes the kitchen, formal living room, and a sunroom overlooking the backyard. Downstairs, you’ll find a spacious den with walk-out access, providing additional living or entertaining space. The property also includes a two-car garage with expansive storage, offering plenty of room for tools, hobbies, or extra belongings. With great potential, this home presents an excellent opportunity for investors or buyers with vision to update and make it their own. Call today!
ⓘ Source: listings_history table (triggers on properties + properties_extension) + one-shot
backfill from property_details.listing_events for pre-trigger history.
Tax reassessment forecast AL · Resets to sale price
- Current annual tax
- $730 · $61/mo
- Projected year-2 tax
- $818 · $68/mo
- Expected delta
- +$88/yr (+$7/mo · 12.1%)
ⓘ Screening estimate from a state-policy table — verify with the county assessor before closing.
Climate risk First Street
- Flood 1/10 Low FEMA zone X (unshaded) · 0% chance over 30 yrs
- Wildfire 3/10 Moderate
- Heat 7/10 Severe 6 d/yr ≥108°F today · 17 d/yr by 30 yrs out
- Wind 6/10 Major 56% chance of damaging wind over 30 yrs
- Air quality 3/10 Moderate 2 unhealthy d/yr today · 3 by 30 yrs out
Nearby sold comps map
Loading sold comps map…
Walkable amenities ~0.75 mi
Loading nearby amenities…
Taxation est. · year 1
- Rental income
- $23,078
- − Mortgage interest
- −$11,175
- − Property taxes
- −$730
- − Insurance
- −$998
- − Repairs & maintenance
- −$1,846
- − Management
- −$1,846
- − Depreciation
- −$5,804
- Taxable income
- $680
- Est. tax owed @ 24.0%
- −$163
- After-tax cash flow
- $3,787/yr
For passive investors: Depreciation is non-cash, so a rental often shows a tax loss while cash-flowing — sheltering income. Rental losses are passive: they offset passive income freely, and up to $25,000/yr can offset ordinary (W-2) income if you actively participate and your MAGI is under $100k (phasing out to $0 by $150k); unused losses carry forward. On sale, claimed depreciation is recaptured at up to 25%, and gains may owe capital-gains tax (a 1031 exchange can defer both). Figures are a year-1 estimate at your 24.0% rate — not tax advice; consult a CPA.
Schools (NCES district)
- District
- Tuscaloosa City
- NCES district ID
- 0103360
- Math proficiency
- 19% ▼ -24.00%
- Reading proficiency
- 40% ▼ -1.00%
- Median HH income
- $37,474
- Composite
- 24.51/100
- National rank
- #7647
- State rank
- #74 of 129 in AL
Livability — Tuscaloosa
- Score
- 77/100
- State rank
- #9
- US rank
- #2909
Category grades
Schools grade is shown separately in the Schools card above.
Census & demographics
- Census place
- Tuscaloosa, AL
- County
- Tuscaloosa County · 206,491 people
- City population
- 134,228
- Metro
- Tuscaloosa, AL
- Population (ZIP)
- 22,445
- Household income
- $48,932
- Rent vs Own
- Severe rent burden
- 1531.0
Population outlook (Tuscaloosa County) Hauer SSP2
- Today (2025)
- 228,293 people
- By 2030
- 240,551 · +5.4%
- By 2040
- 263,856 · +15.6%
- By 2050
- 286,491 · +25.5%
- By 2075
- 335,783 · +47.1%
- By 2100
- 370,520 · +62.3%
Race, ethnicity, and origin ACS 2023
- Neighborhood character
- Diverse neighborhood (Simpson 0.59)
- Race & ethnicity
- Black 46% White 44% Hispanic / Latino 8% Two or more races 5% Asian 1%
- Hispanic origin (detail)
- Mexican 8%
- Common ancestry
- Italian 2% Slovak 1% Serbian 1%
- Foreign-born
- 6% · Canada, South Korea
- Languages at home
- 91% English-only · Spanish 7%
Political lean MEDSL · Tuscaloosa
- 2024 margin
- Strong R (+20.4) · D 39.4% · R 59.8%
- 2008→2024 swing
- -4.4pp toward R · 2008: -16.0pp · 2024: -20.4pp
- All cycles
- 2024: R+20.4 2020: R+14.8 2016: R+19.5 2012: R+17.4 2008: R+16.0
Not yet ingested
- Civics
- —
Market trends
- HPI YoY
- ▼ -103.00%
- Current HPI
- 170.026
- Rent YoY
- ▲ 6.81%
- Metro
- Tuscaloosa, AL
- State GDP YoY
- ▲ 2.94%
- F500 in state
- 4
Industry mix (Fortune 500 HQ in AL)
| Industry | F500 HQs | Revenue |
|---|---|---|
| Financial Services | 1 | $8B |
|
||
| Healthcare | 1 | $5B |
|
||
Price history
3 events — show timeline
- 2026-04-27 Relisted — WAMLS
- 2026-04-15 Pending — WAMLS
- 2026-03-25 Listed $228,000 WAMLS
Property tax history
+5.6%/yrLatest (2025): $730 · +7.1% YoY. Source: county tax records.
Cash-flow waterfall
monthlySold comps — $/sqft
last 12 mo · ≤1 miLoading sold comps…