 Duplex
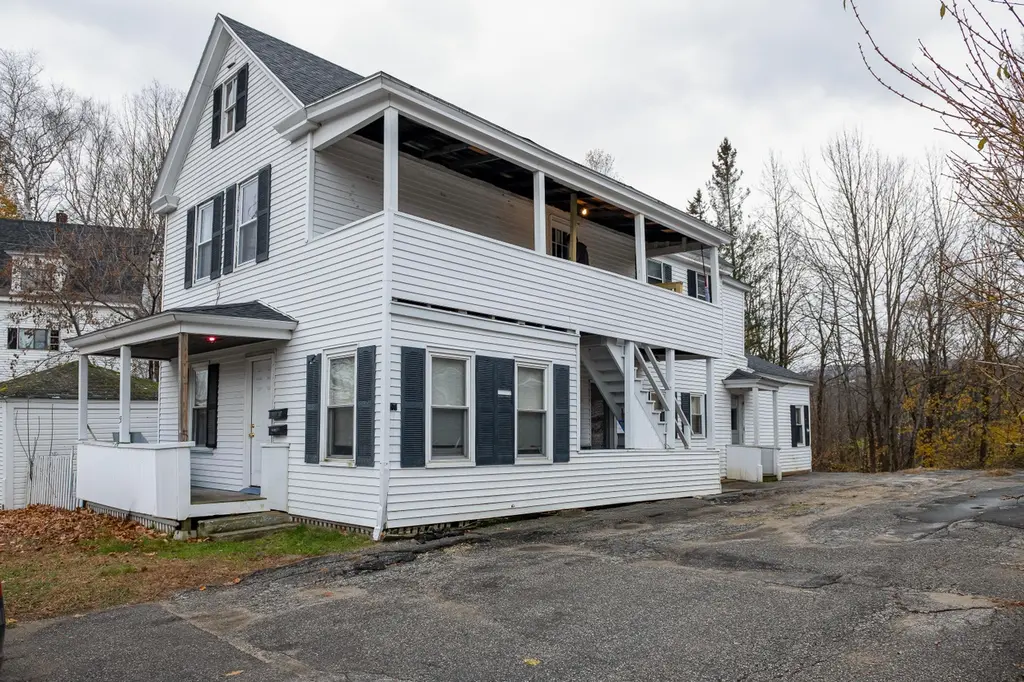
55 Osgood Ave · Mexico, ME
Flood risk No data
- FEMA flood zone
- —
- Chance of flooding over 30 yrs
- —
- Est. flood insurance / yr
- —
Fire risk No data
- Est. fire insurance / yr
- —
Heat risk No data
- Hot days now (above threshold)
- —
- Hot days in 30 yrs
- —
Wind risk No data
- Chance of severe wind over 30 yrs
- —
Air-quality risk No data
- Unhealthy air days now
- —
- Unhealthy air days in 30 yrs
- —
Risk factors via First Street. Map © Google.
Why this score? — see what drove the B- grade
The composite is a weighted blend of 9 inputs, each scored 0–100. Each bar is that input's sub-score; the figure is the points it added to the 100-point composite (weight × sub-score).
- Cash flow +30.0/30.0
- 1% rule +10.0/10.0
- DSCR +10.0/10.0
- Schools +6.3/10.0
- Appreciation +3.8/10.0
- Livability +3.8/5.0
- Rent growth +2.5/5.0
- Condition / age +2.5/5.0
- ARV discount +0.5/15.0
$165,000
🖨 Deal sheet 📄 Offer letter ✓ Due diligence
Multi-family units
County records classify this as Multi-Family (2-4 Unit). Listing-text estimate: 2 units. confirmed
Listing remarks MLS
Nice 2 family, fully rented and turn key to add to a growing portfolio! Recent upgrades include new electric service, tenants pay their own electric, new roof and second floor has been refreshed for the current tenants.
Key facts
- New electric service
- Fully rented
- New roof
Tags
Neighborhood map
What this means for you Summary
Snapshot
- This is a 2 × 2-bed/1.0-bath units multifamily listed at $165k.
Deal economics
- At list price, monthly cash flow is $1k ($14k/yr) — positive. Per door: $595/mo.
- The deal already cash-flows at list — no discount required.
- Meets the 1% rule at list price ($3k rent vs $165k).
- Recommended offer: $145k (12.0% below list) — sets the bar for market timing.
- Cap rate 14.9% vs local median 7.1% in Mexico — top-decile yield for the area; either an underpriced asset or a hidden risk that comps aren't pricing in. Stress-test before assuming the spread holds.
Location & tenants
- Location reads 76/100 on livability (#35 in ME, #3,803 nationally) — a middle-class / working-renter tenant base. Strengths: crime A+, cost of living A+, health & safety A+; Watch: commute D+, schools D-, amenities F.
- RSU 10 (rural): math 72% / reading 79% proficiency, ranked #107 of 112 in ME (top 96%) — strong family-tenant draw, lease renewals of 3-5y typical.
- Market conditions: 34 active listings in the ZIP; 1 comparable units currently listed for rent nearby; 329 units permitted in Oxford County in 2024 (0 in 5+ unit buildings).
Forward outlook
- Local home prices are declining (-2.4%/yr); year-one equity from $1k of loan paydown is wiped out by about $4k of value loss. Plan a longer hold.
- Oxford County population projected at -21% by 2050 — secular population decline; favor cash flow + early exit over multi-decade hold.
- At projected returns (-2.4% appreciation + 3.0% rent growth), your $46k cash investment doubles in ~4 years — after that, you're playing with house money.
Negotiation context
- It's been on market 211 days — a 12% lower offer ($145k) is reasonable based on typical stale-listing flexibility.
- 3 sale attempts since 7y ago with the ask held roughly flat each time — persistent listings suggest the price (not the market) is what's stuck; bring a comps-based counter.
- Current owner paid $72k; list at $165k implies a 128% gain — meaningful room to come down on a strong offer.
Risks & watch-outs
- Watch-outs: built in 1900 — expect roof / HVAC / electrical / plumbing capex.
Questions for the listing agent
- It's been on market 211 days. Have you received any prior offers? Is the seller open to a 12% concession, seller financing, or rate buy-down credit?
- Can we see the unit-by-unit rent roll, current vacancy, and any below-market leases? What's the average tenancy length?
- What capital expenditures (roof, boiler, parking lot, exteriors) have been made in the last 5 years, and what's planned in the next 2?
- Built in 1900 — when were the roof, HVAC, electrical panel, plumbing, and water heater last replaced?
- Why hasn't it sold? Are there any deal-killer items the seller is aware of (foundation, flood, title, zoning, code violations)?
- Is there a deadline driving the sale (1031 exchange, divorce, estate, relocation)? That informs how much negotiation room exists.
- Schools are D-rated, which usually means shorter tenancies and higher turnover. Who's the typical renter profile here, and what's been the actual vacancy rate?
- What's the average days-on-market for RENTAL listings here right now (not sales)? A rising rental-DOM trend means longer vacancies and softer asking-rent achievability than the comps imply.
- What's the recent tenant-quality profile in this submarket — average credit score on applications, eviction rate, late-payment / NSF rate, and stable-employment percentage? A property-management company in the area should have these aggregated.
- How much new apartment / multifamily construction is in the pipeline within 1–3 miles? Heavy new supply (>2% of stock underway) typically softens rents 12–24 months out; light construction supports rent growth.
Investment metrics
- 1% rule
- 1.77% ✓
- Cap rate
- 14.94%
- Cash-on-cash
- 30.89%
- DSCR
- 2.37
- GRM
- 4.7
CMA / ARV
- ARV (median comp)
- $142,712
- List price
- $165,000
- Delta
- 15.62%
- Verdict
- OVERPRICED
- Comps
- 17 within 1.0 mi
Show comp detail 2 sales within ~0.75 mi
| Address | Dist | Beds/Ba | Sqft | Sold | Price | $/sf | Match |
|---|---|---|---|---|---|---|---|
| 544 Hancock St | 0.30mi | 3/2.0 (-1) | 1,680 (+4%) | 12mo | $185,000 | $110 | 65 |
| 7 Pleasant St Unit 6,7,8 | 0.73mi | 5/2.0 (+1) | 1,830 (+13%) | 5mo | $180,000 | $98 | 36 |
Match score weights: distance 35% · size 25% · config 20% · recency 20%. Top-matched comps best support the ARV.
Projected returns pro-forma
-2.39% appreciation · 3.0% rent growth · sell at horizon
- IRR
- 26.9%
- Equity multiple
- 2.15×
- Total profit
- $53,284
- Equity at exit
- $29,113
- IRR
- 33.7%
- Equity multiple
- 4.20×
- Total profit
- $147,768
- Equity at exit
- $22,137
Cash invested: $46,200 (down + closing). Projections, not guarantees.
Landlord ↔ Tenant lean methodology
- Overall (STATE)
- 41 Moderately Tenant-Leaning
- State Maine
- 41 Moderately Tenant-Leaning · D+2
- County
- — inherits STATE
- City
- — inherits STATE
ZIP-level market 04257
- Home prices YoY
- -0.9%
- Active inventory
- 34
- Price-to-rent
- 9.4×
Monthly cashflow live
- Estimated rent
- $2,920 medium interval (Pro) →
- Mortgage (P&I)
- −$865
- Tax from tax record
- −$183 /mo · $2,201/yr
- Insurance
- −$69
- HOA
- −$0
- Vacancy / Maint / Mgmt
- −$613
- Net cashflow
- $1,189
Break-even live
2-unit breakdown (identical units grouped — click to expand)
| Units | Beds | Baths | Est. rent |
|---|---|---|---|
| 2× units | 2 | 1 | $2,920 |
| #1 | 2 | 1 | $1,460 |
| #2 | 2 | 1 | $1,460 |
| Total (2 units) | $2,920 | ||
UW: 25.0% down · 7.5% · 30yr · 1.5% tax · 5.0% vac · 8.0% maint · 8.0% mgmt
Financing live
Cash to close
- Down payment
- $41,250
- Closing costs
- $4,950
- Reserves months
- —
- Total cash needed
- —
Loan-product check · same deal, 3 products live
Conventional
25% down · 7.5% · 30yr
- Down + closing
- —
- Monthly P&I
- —
- Monthly cashflow
- —
- DSCR
- —
- Eligible?
- —
Personal DTI + credit; lowest rate.
DSCR
20% down · 8.5% · 30yr
- Down + closing
- —
- Monthly P&I
- —
- Monthly cashflow
- —
- DSCR
- —
- Eligible?
- —
No personal income docs; deal must DSCR.
Hard money
10% down · 12.0% · 12mo
- Down + closing
- —
- Monthly P&I
- —
- Monthly cashflow
- —
- DSCR
- —
- Eligible?
- —
Short-term bridge; refi at stabilization.
Rent comps 1 comps
| Address | Beds | Baths | Sqft | Rent | $/sqft | DOM | Units | Dist |
|---|---|---|---|---|---|---|---|---|
| 37 Erchles St Unit 1 Rumford, ME | 4.0 | 1.0 | 1440 | $1,650 | $1.15 | 44d | 1 | 0.52mi |
Listing history 22 events
-
2026-06-18days on market $165,000 Active 211 DOM
-
2026-06-17days on market $165,000 Active 210 DOM
-
2026-06-16days on market $165,000 Active 209 DOM
-
2026-06-15days on market $165,000 Active 208 DOM
-
2026-06-13days on market $165,000 Active 206 DOM
-
2026-06-12days on market $165,000 Active 205 DOM
-
2026-06-09days on market $165,000 Active 202 DOM
-
2026-06-08days on market $165,000 Active 201 DOM
-
2026-06-07days on market $165,000 Active 200 DOM
-
2026-06-07days on market $165,000 Active 199 DOM
-
2026-06-04days on market $165,000 Active 196 DOM
-
2026-06-02days on market $165,000 Active 195 DOM
-
2026-06-01days on market $165,000 Active 194 DOM
-
2026-05-31days on market $165,000 Active 193 DOM
-
2026-05-31days on market $165,000 Active 192 DOM
-
2025-11-19$165,000 Active 219-char remark
Show marketing remark (219 chars)
Nice 2 family, fully rented and turn key to add to a growing portfolio! Recent upgrades include new electric service, tenants pay their own electric, new roof and second floor has been refreshed for the current tenants.
-
2021-12-14soldstatus $72,500 Closed 156-char remark
Show marketing remark (156 chars)
Why rent when you can own! This duplex is the perfect opportunity to own and have your tenant pay the mortgage. Don't wait because this will not last long!
-
2021-11-01status Pending 156-char remark
Show marketing remark (156 chars)
Why rent when you can own! This duplex is the perfect opportunity to own and have your tenant pay the mortgage. Don't wait because this will not last long!
-
2021-10-22$89,900 Active 156-char remark
Show marketing remark (156 chars)
Why rent when you can own! This duplex is the perfect opportunity to own and have your tenant pay the mortgage. Don't wait because this will not last long!
-
2020-04-01soldstatus $25,000 Closed
-
2020-02-04status Pending - Continue to Show
-
2019-09-25$48,900 Active
ⓘ Source: listings_history table (triggers on properties + properties_extension) + one-shot
backfill from property_details.listing_events for pre-trigger history.
Tax reassessment forecast ME · Partial reset (capped growth)
- Current annual tax
- $2,201 · $183/mo
- Projected year-2 tax
- $2,222 · $185/mo
- Expected delta
- +$22/yr (+$2/mo · 1.0%)
ⓘ Screening estimate from a state-policy table — verify with the county assessor before closing.
Nearby sold comps map
Loading sold comps map…
Walkable amenities ~0.75 mi
Loading nearby amenities…
Taxation est. · year 1
- Rental income
- $35,040
- − Mortgage interest
- −$9,243
- − Property taxes
- −$2,201
- − Insurance
- −$825
- − Repairs & maintenance
- −$2,803
- − Management
- −$2,803
- − Depreciation
- −$4,800
- Taxable income
- $12,365
- Est. tax owed @ 24.0%
- −$2,968
- After-tax cash flow
- $11,305/yr
For passive investors: Depreciation is non-cash, so a rental often shows a tax loss while cash-flowing — sheltering income. Rental losses are passive: they offset passive income freely, and up to $25,000/yr can offset ordinary (W-2) income if you actively participate and your MAGI is under $100k (phasing out to $0 by $150k); unused losses carry forward. On sale, claimed depreciation is recaptured at up to 25%, and gains may owe capital-gains tax (a 1031 exchange can defer both). Figures are a year-1 estimate at your 24.0% rate — not tax advice; consult a CPA.
Schools (NCES district)
- District
- RSU 10
- NCES district ID
- 2314795
- Math proficiency
- 72% ▲ 50.00%
- Reading proficiency
- 79% ▲ 34.00%
- Median HH income
- $37,647
- Composite
- 62.72/100
- National rank
- #671
- State rank
- #107 of 112 in ME
Livability — Mexico
- Score
- 76/100
- State rank
- #35
- US rank
- #3803
Category grades
Schools grade is shown separately in the Schools card above.
Census & demographics
- Census place
- Mexico, ME
- Population (ZIP)
- 2,772
Population outlook (Oxford County) Hauer SSP2
- Today (2025)
- 55,853 people
- By 2030
- 54,190 · -3.0%
- By 2040
- 49,484 · -11.4%
- By 2050
- 43,958 · -21.3%
- By 2075
- 32,308 · -42.2%
- By 2100
- 21,858 · -60.9%
Race, ethnicity, and origin ACS 2023
- Neighborhood character
- Predominantly White (97%)
- Race & ethnicity
- White 97% Two or more races 2%
- Common ancestry
- Lithuanian 22% Italian 3% Slovak 3%
- Foreign-born
- 0% · Canada
- Languages at home
- 98% English-only · French/Haitian/Cajun 2%
Political lean MEDSL · Oxford
- 2024 margin
- R (+12.9) · D 42.7% · R 55.6% · Other 1.7%
- 2008→2024 swing
- -28.9pp toward R · 2008: 16.0pp · 2024: -12.9pp
- All cycles
- 2024: R+12.9 2020: R+8.8 2016: R+13.0 2012: D+14.9 2008: D+16.0
Not yet ingested
- Civics
- —
Market trends
- HPI YoY
- ▼ -2.39%
- Current HPI
- 263.5537
- Rent YoY
- —
- Metro
- —
- State GDP YoY
- —
- F500 in state
- 0
Price history
+237.4% since first listed7 events — show timeline
- 2025-11-19 Listed $165,000 MREIS
- 2021-12-14 Sold (MLS) $72,500 MREIS
- 2021-11-01 Pending — MREIS
- 2021-10-22 Listed $89,900 MREIS
- 2020-04-01 Sold (MLS) $25,000 MREIS
- 2020-02-04 Pending — MREIS
- 2019-09-25 Listed $48,900 MREIS
Property tax history
+1.2%/yrLatest (2024): $2,201 · -0.7% YoY. Source: county tax records.
Cash-flow waterfall
monthlySold comps — $/sqft
last 12 mo · ≤1 miLoading sold comps…