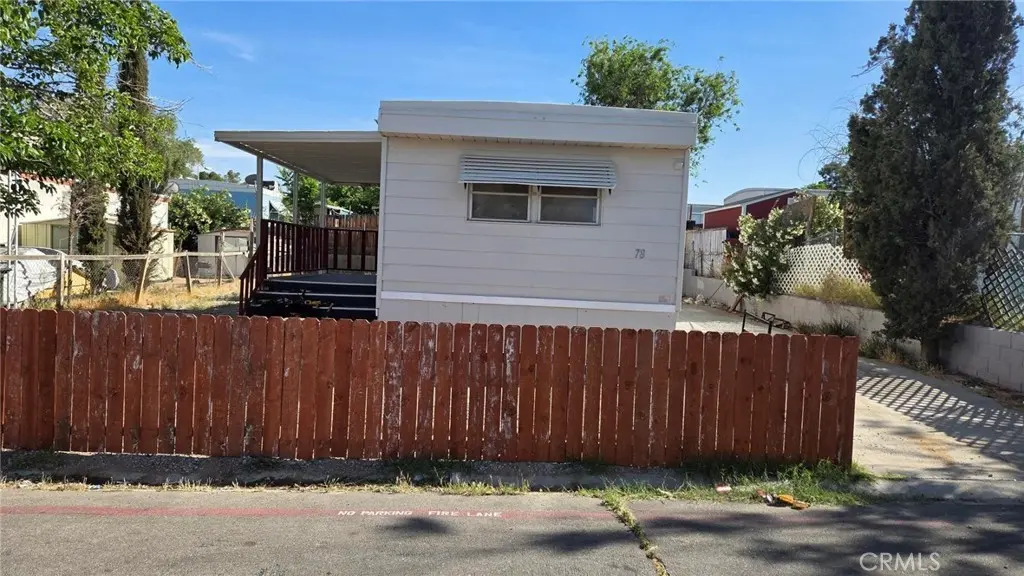
1000 Windy Pass #78 · Barstow, CA
Flood risk 1/10 · Minimal
- FEMA flood zone
- X (unshaded)
- Chance of flooding over 30 yrs
- 0.0%
- Est. flood insurance / yr
- $507 – $1,088
Fire risk 4/10 · Minor
- Est. fire insurance / yr
- $659 – $1,223
Heat risk 8/10 · Major
- Hot days now (above 103°F)
- 3 days/yr
- Hot days in 30 yrs
- 10 days/yr
Wind risk 1/10 · Minimal
- Chance of severe wind over 30 yrs
- —
Air-quality risk 6/10 · Moderate
- Unhealthy air days now
- 11 days/yr
- Unhealthy air days in 30 yrs
- 15 days/yr
Risk factors via First Street. Map © Google.
Why this score? — see what drove the D- grade
The composite is a weighted blend of 9 inputs, each scored 0–100. Each bar is that input's sub-score; the figure is the points it added to the 100-point composite (weight × sub-score).
- Cash flow +15.0/30.0
- 1% rule +5.0/10.0
- DSCR +5.0/10.0
- Livability +3.2/5.0
- Rent growth +3.1/5.0
- Condition / age +2.5/5.0
- Schools +1.4/10.0
- ARV discount +0.0/15.0
- Appreciation +0.0/10.0
$37,000
🖨 Deal sheet (PDF) 📄 Offer letter ✓ Due diligence
Listing remarks MLS
Located in the desirable Sunrise Pass Community in Barstow, this well-maintained 2 bedroom, 1 bath home offers an affordable opportunity for homeownership. Featuring approximately 720 square feet of living space, this home includes a newer Painting, updated Kitchen and bathroom, indoor laundry hookups and a fenced yard providing added privacy and outdoor space. Sunrise Pass Community amenities include a pool, clubhouse and community laundry facilities. Conveniently located near shopping dining and freeway access. Space rent is $775 per month. Park approval required.
Key facts
- Clubhouse
- Fenced yard
- Updated kitchen
Tags
Neighborhood map
What this means for you Summary
Snapshot
- This is a 3-bed/2.0-bath manufactured listed at $37k.
Deal economics
- At list price, monthly cash flow is $1k ($12k/yr) — positive.
- The deal already cash-flows at list — no discount required.
- Meets the 1% rule at list price ($2k rent vs $37k).
- Recommended offer: $36k (3.0% below list) — sets the bar for market timing.
- Cap rate 38.8% vs local median 4.6% in Barstow — top-decile yield for the area; either an underpriced asset or a hidden risk that comps aren't pricing in. Stress-test before assuming the spread holds.
Location & tenants
- Location reads 63/100 on livability (#444 in CA) — a middle-class / working-renter tenant base. Strengths: commute A+, housing A+; Watch: amenities C-, health & safety C-, schools F.
- Barstow Unified (town): math 11% / reading 22% proficiency, ranked #482 of 517 in CA (top 93%) — low school quality limits family demand, transient renter base, plan for 1-2y turnover; 68% free/reduced lunch — lower-income household profile, screen leases tightly.
- Market conditions: Rents rising (+2.3%/yr); 343 active listings in the ZIP; 24 comparable units currently listed for rent nearby; rentals at typical pace (median 25d on market — plan ~3-4 weeks tenant-placement turnaround); 5,458 units permitted in San Bernardino County in 2024 (1,500 in 5+ unit buildings).
Forward outlook
- Local home prices are declining (-3.0%/yr); year-one equity from $256 of loan paydown is wiped out by about $1k of value loss. Plan a longer hold.
- San Bernardino County population projected at +15% by 2050 — modest demand growth; plan on rents tracking national, not racing it.
- At projected returns (-3.0% appreciation + 2.3% rent growth), your $10k cash investment doubles in ~1 year — after that, you're playing with house money.
Negotiation context
- It's been on market 60 days — a 3% lower offer ($36k) is reasonable based on typical stale-listing flexibility.
Risks & watch-outs
- Climate carrying-cost: extreme-heat days projected 3→10/yr by 2055 (HVAC capex compounding) — expect insurance premiums to compound above CPI over the hold.
Questions for the listing agent
- It's been on market 60 days. Have you received any prior offers? Is the seller open to a 3% concession, seller financing, or rate buy-down credit?
- Built in 1969 — when were the roof, HVAC, electrical panel, plumbing, and water heater last replaced?
- Is there a deadline driving the sale (1031 exchange, divorce, estate, relocation)? That informs how much negotiation room exists.
- Schools are F-rated, which usually means shorter tenancies and higher turnover. Who's the typical renter profile here, and what's been the actual vacancy rate?
- Crime grade is F in this area — have there been break-ins, vandalism, or insurance claims at this property in the last 3 years? What carrier currently insures it and at what premium?
- The area grade is low — what's the realistic commute time and amenity access for the typical tenant pool here? Any planned neighborhood developments (good or bad) we should know about?
- What's the average days-on-market for RENTAL listings here right now (not sales)? A rising rental-DOM trend means longer vacancies and softer asking-rent achievability than the comps imply.
- What's the recent tenant-quality profile in this submarket — average credit score on applications, eviction rate, late-payment / NSF rate, and stable-employment percentage? A property-management company in the area should have these aggregated.
- How much new for-sale + rental construction is in the pipeline within 1–3 miles? Heavy new supply typically softens prices + rents 12–24 months out; constrained supply supports both.
Investment metrics
- 1% rule
- 4.18% ✓
- Cap rate
- 38.77%
- Cash-on-cash
- 115.99%
- DSCR
- 6.16
- GRM
- 2.0
CMA / ARV
- ARV (median comp)
- $28,543
- List price
- $37,000
- Delta
- 29.63%
- Verdict
- OVERPRICED
- Comps
- 2 within 2.0 mi
Show comp detail 2 sales within ~0.75 mi
| Address | Dist | Beds/Ba | Sqft | Sold | Price | $/sf | Match |
|---|---|---|---|---|---|---|---|
| 1000 Windy Pass #34 | 0.09mi | 3/2.0 | 1,248 (+8%) | 16mo | $67,000 | $54 | 68 |
| 1000 Windy Pass #105 | 0.00mi | 2/1.0 (-1) | 1,000 (-13%) | 8mo | $30,000 | $30 | 62 |
Match score weights: distance 35% · size 25% · config 20% · recency 20%. Top-matched comps best support the ARV.
Projected returns pro-forma
-3.0% appreciation · 2.32% rent growth · sell at horizon
- IRR
- —
- Equity multiple
- 6.48×
- Total profit
- $56,735
- Equity at exit
- $5,517
- IRR
- —
- Equity multiple
- 13.29×
- Total profit
- $127,284
- Equity at exit
- $3,199
Cash invested: $10,360 (down + closing). Projections, not guarantees.
Landlord ↔ Tenant lean methodology
- Overall (STATE)
- 18 Strongly Tenant-Friendly
- State California
- 18 Strongly Tenant-Friendly · D+13
- County
- — inherits STATE
- City
- — inherits STATE
ZIP-level market 92311
- Home prices YoY
- -30.6%
- Rents YoY
- 2.3%
- Active inventory
- 343
- Price-to-rent
- 2.0×
Monthly cashflow live
- Estimated rent
- $1,545 high interval (Pro) →
- Mortgage (P&I)
- −$194
- Tax from tax record
- −$10 /mo · $117/yr
- Insurance
- −$15
- HOA
- −$0
- Vacancy / Maint / Mgmt
- −$324
- Net cashflow
- $1,001
Break-even live
Sensitivity live
| Price | -10% $1,022 | -5% $1,012 | +0% $1,001 | +5% $991 | +10% $980 |
|---|---|---|---|---|---|
| Rent | -10% $879 | -5% $940 | +0% $1,001 | +5% $1,062 | +10% $1,123 |
| Rate | -1.0pp $1,020 | -0.5pp $1,011 | base $1,001 | +0.5pp $992 | +1.0pp $982 |
UW: 25.0% down · 7.5% · 30yr · 1.5% tax · 5.0% vac · 8.0% maint · 8.0% mgmt
Financing live
Cash to close
- Down payment
- $9,250
- Closing costs
- $1,110
- Reserves months
- —
- Total cash needed
- —
Loan-product check · same deal, 3 products live
Conventional
25% down · 7.5% · 30yr
- Down + closing
- —
- Monthly P&I
- —
- Monthly cashflow
- —
- DSCR
- —
- Eligible?
- —
Personal DTI + credit; lowest rate.
DSCR
20% down · 8.5% · 30yr
- Down + closing
- —
- Monthly P&I
- —
- Monthly cashflow
- —
- DSCR
- —
- Eligible?
- —
No personal income docs; deal must DSCR.
Hard money
10% down · 12.0% · 12mo
- Down + closing
- —
- Monthly P&I
- —
- Monthly cashflow
- —
- DSCR
- —
- Eligible?
- —
Short-term bridge; refi at stabilization.
Rent comps 24 comps
| Address | Beds | Baths | Sqft | Rent | $/sqft | DOM | Units | Dist |
|---|---|---|---|---|---|---|---|---|
| 751 Upton Dr Unit 2 Barstow, CA | 2.0 | 1.0 | 800 | $1,295 | $1.62 | 19d | 1 | 0.15mi |
| 761 Upton Dr Unit C Barstow, CA | 2.0 | 1.0 | 800 | $1,199 | $1.50 | 6d | 1 | 0.15mi |
| 810 Starlight St Barstow, CA | 3.0 | 2.0 | 1430 | $1,895 | $1.33 | 44d | 1 | 0.27mi |
| 332 Date Ave Barstow, CA | 4.0 | 2.0 | 1144 | $1,950 | $1.70 | 44d | 1 | 0.54mi |
| 1140 Deseret Ave Unit A Barstow, CA | 3.0 | 2.0 | 1270 | $1,550 | $1.22 | 44d | 1 | 0.59mi |
| 937 E Elizabeth St Barstow, CA | 4.0 | 1.0 | 1422 | $2,195 | $1.54 | 5d | 1 | 0.64mi |
| 755 E Virginia Way Barstow, CA | 1.0–2.0 | 1.0–2.0 | 889 | $1,295 | $1.46 | 0d | 1 | 0.65mi |
| 628 E Virginia Way Unit D Barstow, CA | 2.0 | 1.0 | 848 | $1,095 | $1.29 | 6d | 1 | 0.66mi |
| 615 E Virginia Way Barstow, CA | 2.0 | 1.0 | 755 | $1,036 | $1.37 | 0d | 1 | 0.75mi |
| 945 Carson St Barstow, CA | 2.0 | 1.0 | 800 | $1,300 | $1.62 | 44d | 1 | 0.77mi |
| 650 S Muriel Dr Barstow, CA | 3.0 | 1.0 | 1320 | $1,625 | $1.23 | 25d | 1 | 0.88mi |
| 1801 Rimrock Rd Barstow, CA | 1.0–2.0 | 1.0–2.0 | 775 | $1,810 | $2.34 | 0d | 6 | 0.89mi |
| 1900 Dill Rd Barstow, CA | 1.0–3.0 | 1.0–2.0 | 892 | $1,505 | $1.69 | 0d | 8 | 0.97mi |
| 200 E Elizabeth St Barstow, CA | 3.0 | 1.0 | 1096 | $1,700 | $1.55 | 25d | 1 | 0.98mi |
| 251 Juniper St Unit A Barstow, CA | 2.0 | 1.0 | 1464 | $1,350 | $0.92 | 44d | 1 | 1.00mi |
| 820 S 2nd Ave Barstow, CA | 2.0 | 1.0 | 855 | $1,350 | $1.58 | 44d | 1 | 1.06mi |
| 313 Maxine Ave Barstow, CA | 2.0 | 1.0 | 700 | $1,400 | $2.00 | 13d | 1 | 1.12mi |
| 1061 May Ln Barstow, CA | 2.0 | 1.0 | 900 | $1,295 | $1.44 | 12d | 1 | 1.21mi |
| 720 Mount Vernon Ave Barstow, CA | 2.0 | 1.0 | 1172 | $1,296 | $1.11 | 13d | 1 | 1.22mi |
| 1040 May Ln Unit 15 Barstow, CA | 2.0 | 2.0 | 875 | $1,295 | $1.48 | 44d | 1 | 1.24mi |
| 800 Arbor Way Barstow, CA | 3.0 | 2.0 | 1000 | $2,500 | $2.50 | 25d | 1 | 1.28mi |
| 411 S 1st Ave Barstow, CA | 2.0 | 1.0 | 800 | $1,125 | $1.41 | 44d | 1 | 1.34mi |
| 100 E Fredricks St Barstow, CA | 2.0 | 1.0 | 1100 | $1,195 | $1.09 | 25d | 1 | 1.44mi |
| 149 W Buena Vista St Unit 149-C Barstow, CA | 2.0 | 1.0 | 750 | $1,395 | $1.86 | 44d | 1 | 1.46mi |
Listing history 15 events
-
2026-06-18days on market $37,000 Active 60 DOM
-
2026-06-17days on market $37,000 Active 59 DOM
-
2026-06-16days on market $37,000 Active 58 DOM
-
2026-06-15days on market $37,000 Active 57 DOM
-
2026-06-13days on market $37,000 Active 55 DOM
-
2026-06-13days on market $37,000 Active 54 DOM
-
2026-06-09days on market $37,000 Active 51 DOM
-
2026-06-08pricedays on market $37,000 Active 50 DOM
-
2026-06-07days on market $42,000 Active 49 DOM
-
2026-06-04days on market $42,000 Active 46 DOM
-
2026-06-03days on market $42,000 Active 45 DOM
-
2026-06-02days on market $42,000 Active 44 DOM
-
2026-06-01days on market $42,000 Active 43 DOM
-
2026-05-31days on market $42,000 Active 42 DOM
-
2026-04-19$42,000 Active 572-char remark
Show marketing remark (572 chars)
Located in the desirable Sunrise Pass Community in Barstow, this well-maintained 2 bedroom, 1 bath home offers an affordable opportunity for homeownership. Featuring approximately 720 square feet of living space, this home includes a newer Painting, updated Kitchen and bathroom, indoor laundry hookups and a fenced yard providing added privacy and outdoor space. Sunrise Pass Community amenities include a pool, clubhouse and community laundry facilities. Conveniently located near shopping dining and freeway access. Space rent is $775 per month. Park approval required.
ⓘ Source: listings_history table (triggers on properties + properties_extension) + one-shot
backfill from property_details.listing_events for pre-trigger history.
Tax reassessment forecast CA · Resets to sale price
- Current annual tax
- $117 · $10/mo
- Projected year-2 tax
- $281 · $23/mo
- Expected delta
- +$164/yr (+$14/mo · 140.4%)
ⓘ Screening estimate from a state-policy table — verify with the county assessor before closing.
Climate risk First Street
- Flood 1/10 Low FEMA zone X (unshaded) · 0% chance over 30 yrs
- Wildfire 4/10 Moderate
- Heat 8/10 Severe 3 d/yr ≥103°F today · 10 d/yr by 30 yrs out
- Wind 1/10 Low
- Air quality 6/10 Major 11 unhealthy d/yr today · 15 by 30 yrs out
Nearby sold comps map
Loading sold comps map…
Walkable amenities ~0.75 mi
Loading nearby amenities…
Taxation est. · year 1
- Rental income
- $18,541
- − Mortgage interest
- −$2,073
- − Property taxes
- −$117
- − Insurance
- −$185
- − Repairs & maintenance
- −$1,483
- − Management
- −$1,483
- − Depreciation
- −$1,076
- Taxable income
- $12,123
- Est. tax owed @ 24.0%
- −$2,910
- After-tax cash flow
- $9,107/yr
For passive investors: Depreciation is non-cash, so a rental often shows a tax loss while cash-flowing — sheltering income. Rental losses are passive: they offset passive income freely, and up to $25,000/yr can offset ordinary (W-2) income if you actively participate and your MAGI is under $100k (phasing out to $0 by $150k); unused losses carry forward. On sale, claimed depreciation is recaptured at up to 25%, and gains may owe capital-gains tax (a 1031 exchange can defer both). Figures are a year-1 estimate at your 24.0% rate — not tax advice; consult a CPA.
Schools (NCES district)
- District
- Barstow Unified
- NCES district ID
- 0604020
- Math proficiency
- 11% ▼ -7.00%
- Reading proficiency
- 22% ▼ -7.00%
- Median HH income
- $44,505
- Composite
- 14.44/100
- National rank
- #9430
- State rank
- #482 of 517 in CA
Livability — Barstow
- Score
- 63/100
- State rank
- #444
- US rank
- #15099
Category grades
Schools grade is shown separately in the Schools card above.
Census & demographics
- Census place
- Barstow, CA
- County
- San Bernardino County · 2,030,291 people
- City population
- 33,954
- Metro
- Riverside-San Bernardino-Ontario, CA
- Population (ZIP)
- 33,954
- Household income
- $61,862
- Rent vs Own
- Severe rent burden
- 1305.0
Population outlook (San Bernardino County) Hauer SSP2
- Today (2025)
- 2,300,329 people
- By 2030
- 2,378,907 · +3.4%
- By 2040
- 2,523,137 · +9.7%
- By 2050
- 2,642,388 · +14.9%
- By 2075
- 2,880,769 · +25.2%
- By 2100
- 2,909,436 · +26.5%
Race, ethnicity, and origin ACS 2023
- Neighborhood character
- Diverse neighborhood (Simpson 0.68)
- Race & ethnicity
- Hispanic / Latino 46% White 29% Two or more races 22% Black 15% Native American 3% Asian 2% Pacific Islander 1%
- Hispanic origin (detail)
- Mexican 39% Puerto Rican 2%
- Common ancestry
- Portuguese 1% Lithuanian 1% Italian 1%
- Foreign-born
- 9% · Canada, South Korea
- Languages at home
- 77% English-only · Spanish 20% Tagalog/Filipino 1% Other Indo-European 1%
Political lean MEDSL · San Bernardino
- 2024 margin
- Toss-up / Even · D 47.5% · R 49.7% · Other 2.8%
- 2008→2024 swing
- -8.5pp toward R · 2008: 6.3pp · 2024: -2.1pp
- All cycles
- 2024: R+2.1 2020: D+10.7 2016: D+9.8 2012: D+5.4 2008: D+6.3
Not yet ingested
- Civics
- —
Market trends
- HPI YoY
- ▼ -139.26%
- Current HPI
- 316.4858
- Rent YoY
- ▲ 2.32%
- Metro
- Riverside-San Bernardino-Ontario, CA
- State GDP YoY
- ▲ 3.21%
- F500 in state
- 116
Industry mix (Fortune 500 HQ in CA)
| Industry | F500 HQs | Revenue |
|---|---|---|
| Technology | 27 | $1,492B |
|
||
| Financial Services | 3 | $174B |
|
||
| Retail | 3 | $44B |
|
||
| Insurance | 3 | $26B |
|
||
| Media / Entertainment | 2 | $115B |
|
||
| Pharmaceuticals / Biotech | 2 | $62B |
|
||
Price history
1 event — show timeline
- 2026-04-19 Listed $42,000 CRMLS
Property tax history
-1.8%/yrLatest (2023): $117 · -1.7% YoY. Source: county tax records.
Cash-flow waterfall
monthlySold comps — $/sqft
last 12 mo · ≤1 miLoading sold comps…