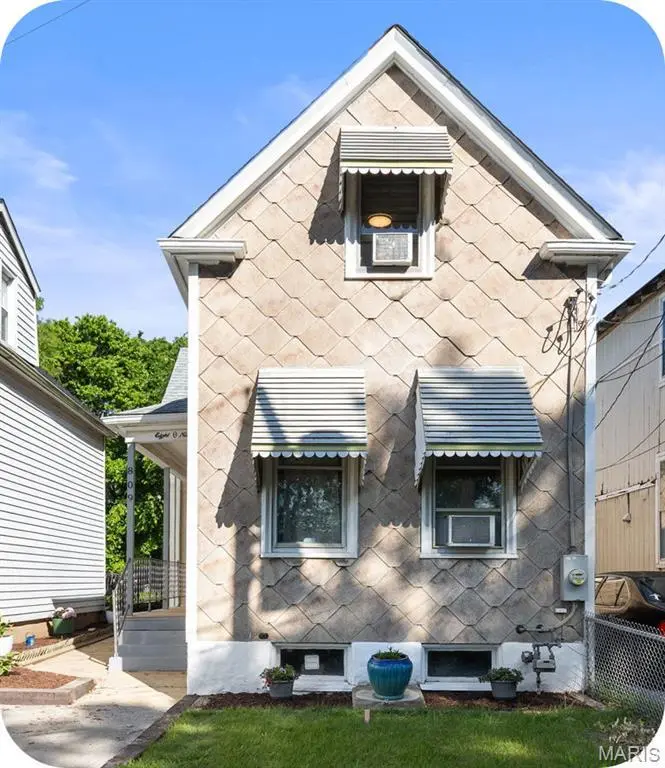
809 Military Rd · Lemay, MO
Flood risk 1/10 · Minimal
- FEMA flood zone
- X (unshaded)
- Chance of flooding over 30 yrs
- 0.0%
- Est. flood insurance / yr
- $473 – $860
Fire risk 1/10 · Minimal
- Est. fire insurance / yr
- $1,054 – $1,958
Heat risk 5/10 · Moderate
- Hot days now (above 108°F)
- 7 days/yr
- Hot days in 30 yrs
- 21 days/yr
Wind risk 2/10 · Minimal
- Chance of severe wind over 30 yrs
- 1.0%
Air-quality risk 3/10 · Minor
- Unhealthy air days now
- 2 days/yr
- Unhealthy air days in 30 yrs
- 3 days/yr
Risk factors via First Street. Map © Google.
Why this score? — see what drove the C+ grade
The composite is a weighted blend of 9 inputs, each scored 0–100. Each bar is that input's sub-score; the figure is the points it added to the 100-point composite (weight × sub-score).
- Cash flow +23.9/30.0
- ARV discount +12.8/15.0
- DSCR +7.7/10.0
- 1% rule +5.3/10.0
- Livability +3.4/5.0
- Schools +2.7/10.0
- Rent growth +2.5/5.0
- Condition / age +2.5/5.0
- Appreciation +0.0/10.0
$124,900
🖨 Deal sheet (PDF) 📄 Offer letter ✓ Due diligence
Listing remarks
Welcome home to this dreamy cottage awaiting a new owner! Lovingly maintained, this stunning property offers 9" ceilings, hardwood flooring and historic charm. Step inside from the covered front porch to the updated kitchen that includes a giant storage pantry and overlooks a large and level backyard, a spacious designated dining room with huge windows providing tons of natural light, a comfy living room and updated bathroom. Upstairs offers two large bedrooms and a generously sized walk-in closet. Off-street parking and easy access to parks, shopping, restaurants, breweries, highways and more offer convenience and comfort-make this beautiful home yours today!
Key facts
- Covered front porch
- Huge windows
- Updated kitchen
Tags
Property features AI
Finance
- Other: Seller may consider concessions
- Financial info: Lease not considered
Exterior
- Parking: No dedicated parking spaces reported
- Utilities: Public water; Public sewer; Electric service by Ameren; Electricity, water, and sewer connected
- Home design: Single-family residence; House with two levels; Updated/remodeled condition; Entry facing unknown
- Construction: Construction materials: Unknown; Above-grade finished area reported (public records)
- Exterior features: Level lot
Interior
- Bedrooms: 2 bedrooms (both on upper level)
- Bathrooms: 1 full bathroom
- Heating & cooling: Hot water heating; Radiant heating; Ceiling fans; Wall/window air conditioning units
- Interior features: Full, unfinished basement; 5 total rooms
Neighborhood map
What this means for you Summary
Snapshot
- This is a 2-bed/1.0-bath single-family listed at $125k.
Deal economics
- At list price, monthly cash flow is $242 ($3k/yr) — positive.
- The deal already cash-flows at list — no discount required.
- Meets the 1% rule at list price ($1k rent vs $125k).
- Recommended offer: $121k (3.0% below list) — sets the bar for market timing.
- Cap rate 8.6% vs local median 5.3% in Lemay — top-decile yield for the area; either an underpriced asset or a hidden risk that comps aren't pricing in. Stress-test before assuming the spread holds.
Location & tenants
- Location reads 67/100 on livability (#213 in MO) — a middle-class / working-renter tenant base. Strengths: cost of living A+, housing A+; Watch: employment C-, health & safety C-, crime F.
- Hancock Place (suburban): math 30% / reading 34% proficiency, ranked #251 of 324 in MO (top 78%) — families likely to look elsewhere, expect single-tenant / working-renter base with shorter leases.
- Zoned schools: Hancock Place Elem. (math 34% / reading 34%, grade F, #739 of 1,115 statewide, top 67%, 616 students, 74% FRL); Hancock Sr. High (math 22% / reading 47%, grade F, #321 of 521 statewide, top 67%, 389 students, 91% FRL) — zoned schools average 83% FRL vs 57% district-wide (26 pts higher); higher-poverty schools than district average — tighter screening recommended.
- Market conditions: 146 active listings in the ZIP; 23 comparable units currently listed for rent nearby; rentals at typical pace (median 15d on market — plan ~3-4 weeks tenant-placement turnaround); 920 units permitted in St. Louis County in 2024 (250 in 5+ unit buildings).
Forward outlook
- Local home prices are declining (-3.0%/yr); year-one equity from $864 of loan paydown is wiped out by about $4k of value loss. Plan a longer hold.
Negotiation context
- It's been on market 43 days — a 3% lower offer ($121k) is reasonable based on typical stale-listing flexibility.
- 7 sale attempts since 11y ago; this cycle's ask has dropped $8k (6%) from the opening price — seller is motivated, your offer sets the floor, not the list.
- Current owner paid $30k; list at $125k implies a 316% gain — meaningful room to come down on a strong offer.
Risks & watch-outs
- Watch-outs: built in 1900 — expect roof / HVAC / electrical / plumbing capex.
- Climate carrying-cost: extreme-heat days projected 7→21/yr by 2055 (HVAC capex compounding) — expect insurance premiums to compound above CPI over the hold.
Questions for the listing agent
- It's been on market 43 days. Have you received any prior offers? Is the seller open to a 3% concession, seller financing, or rate buy-down credit?
- Built in 1900 — when were the roof, HVAC, electrical panel, plumbing, and water heater last replaced?
- Is there a deadline driving the sale (1031 exchange, divorce, estate, relocation)? That informs how much negotiation room exists.
- Schools are D-rated, which usually means shorter tenancies and higher turnover. Who's the typical renter profile here, and what's been the actual vacancy rate?
- Crime grade is F in this area — have there been break-ins, vandalism, or insurance claims at this property in the last 3 years? What carrier currently insures it and at what premium?
- What's the average days-on-market for RENTAL listings here right now (not sales)? A rising rental-DOM trend means longer vacancies and softer asking-rent achievability than the comps imply.
- What's the recent tenant-quality profile in this submarket — average credit score on applications, eviction rate, late-payment / NSF rate, and stable-employment percentage? A property-management company in the area should have these aggregated.
- How much new for-sale + rental construction is in the pipeline within 1–3 miles? Heavy new supply typically softens prices + rents 12–24 months out; constrained supply supports both.
Investment metrics
- 1% rule
- 1.03% ✓
- Cap rate
- 8.62%
- Cash-on-cash
- 8.30%
- DSCR
- 1.37
- GRM
- 8.1
CMA / ARV
- ARV (median comp)
- $141,620
- List price
- $124,900
- Delta
- -11.81%
- Verdict
- UNDERPRICED
- Comps
- 20 within 1.0 mi
Show comp detail 12 sales within ~0.75 mi
| Address | Dist | Beds/Ba | Sqft | Sold | Price | $/sf | Match |
|---|---|---|---|---|---|---|---|
| 773 Reed Ave | 0.57mi | 2/1.0 | 1,036 (+4%) | 1mo | $210,000 | $203 | 66 |
| 9604 Gentry Ave | 0.42mi | 2/1.0 | 916 (-8%) | 2mo | $69,900 | $76 | 65 |
| 712 Orient Ave | 0.39mi | 2/1.0 | 900 (-10%) | 4mo | $152,500 | $169 | 63 |
| 939 Erskine Ave | 0.43mi | 2/1.0 | 894 (-10%) | 3mo | $155,000 | $173 | 60 |
| 920 Wachtel Ave | 0.35mi | 3/2.0 (+1) | 1,090 (+9%) | 0mo | $224,900 | $206 | 59 |
| 704 Dallas Dr | 0.75mi | 1/1.0 (-1) | 999 (+0%) | 2mo | $180,000 | $180 | 58 |
| 8626 Shoss Ave | 0.61mi | 2/1.0 | 912 (-8%) | 3mo | $95,000 | $104 | 55 |
| 1036 Wachtel Ave | 0.46mi | 3/1.0 (+1) | 888 (-11%) | 2mo | $174,900 | $197 | 54 |
| 1402 Dammert Ave | 0.60mi | 3/1.0 (+1) | 912 (-8%) | 2mo | $209,900 | $230 | 52 |
| 111 E Arlee Ave | 0.62mi | 2/1.0 | 1,106 (+11%) | 2mo | $128,500 | $116 | 51 |
| 112 E Arlee Ave | 0.64mi | 2/2.0 | 888 (-11%) | 2mo | $190,000 | $214 | 46 |
| 9704 S Broadway | 0.55mi | 3/2.0 (+1) | 1,120 (+12%) | 3mo | $80,000 | $71 | 42 |
Match score weights: distance 35% · size 25% · config 20% · recency 20%. Top-matched comps best support the ARV.
Projected returns pro-forma
-3.0% appreciation · 3.0% rent growth · sell at horizon
- IRR
- -3.7%
- Equity multiple
- 0.86×
- Total profit
- $-4,860
- Equity at exit
- $18,623
- IRR
- 6.0%
- Equity multiple
- 1.44×
- Total profit
- $15,479
- Equity at exit
- $10,799
Cash invested: $34,972 (down + closing). Projections, not guarantees.
Landlord ↔ Tenant lean methodology
- Overall (STATE)
- 81 Strongly Landlord-Friendly
- State Missouri
- 81 Strongly Landlord-Friendly · R+10
- County
- — inherits STATE
- City
- — inherits STATE
ZIP-level market 63125
- Active inventory
- 146
- Price-to-rent
- 8.1×
Monthly cashflow live
- Estimated rent
- $1,291 high interval (Pro) →
- Mortgage (P&I)
- −$655
- Tax from tax record
- −$71 /mo · $851/yr
- Insurance
- −$52
- HOA
- −$0
- Vacancy / Maint / Mgmt
- −$271
- Net cashflow
- $242
Break-even live
Sensitivity live
| Price | -10% $313 | -5% $277 | +0% $242 | +5% $207 | +10% $171 |
|---|---|---|---|---|---|
| Rent | -10% $140 | -5% $191 | +0% $242 | +5% $293 | +10% $344 |
| Rate | -1.0pp $305 | -0.5pp $274 | base $242 | +0.5pp $210 | +1.0pp $177 |
UW: 25.0% down · 7.5% · 30yr · 1.5% tax · 5.0% vac · 8.0% maint · 8.0% mgmt
Financing live
Cash to close
- Down payment
- $31,225
- Closing costs
- $3,747
- Reserves months
- —
- Total cash needed
- —
Loan-product check · same deal, 3 products live
Conventional
25% down · 7.5% · 30yr
- Down + closing
- —
- Monthly P&I
- —
- Monthly cashflow
- —
- DSCR
- —
- Eligible?
- —
Personal DTI + credit; lowest rate.
DSCR
20% down · 8.5% · 30yr
- Down + closing
- —
- Monthly P&I
- —
- Monthly cashflow
- —
- DSCR
- —
- Eligible?
- —
No personal income docs; deal must DSCR.
Hard money
10% down · 12.0% · 12mo
- Down + closing
- —
- Monthly P&I
- —
- Monthly cashflow
- —
- DSCR
- —
- Eligible?
- —
Short-term bridge; refi at stabilization.
Rent comps 23 comps
| Address | Beds | Baths | Sqft | Rent | $/sqft | DOM | Units | Dist |
|---|---|---|---|---|---|---|---|---|
| 304 Bayless Ave Saint Louis, MO | 3.0 | 1.0 | 1104 | $1,950 | $1.77 | 2d | 1 | 0.16mi |
| 709 Dammert Ave Unit Labs St. Louis, MO | 2.0 | 1.5 | 800 | $1,100 | $1.38 | 44d | 1 | 0.17mi |
| 207 Waller Ave Saint Louis, MO | 2.0 | 1.0 | 900 | $1,075 | $1.19 | 24d | 1 | 0.24mi |
| 152 W Etta Ave Saint Louis, MO | 2.0 | 1.0 | 936 | $1,274 | $1.36 | 8d | 1 | 0.43mi |
| 127 E Holden Ave Saint Louis, MO | 2.0 | 1.0 | 1044 | $1,200 | $1.15 | 44d | 1 | 0.48mi |
| 8511 Idaho Ave Unit 1st Floor St. Louis, MO | 1.0 | 1.0 | 750 | $850 | $1.13 | 13d | 1 | 0.69mi |
| 8125 Michigan Ave St. Louis, MO | 1.0–2.0 | 1.0–2.0 | 797 | $1,150 | $1.44 | 15d | 1 | 0.87mi |
| 9954 Meadow Ave Saint Louis, MO | 2.0 | 1.0 | 1100 | $1,050 | $0.95 | 5d | 1 | 0.98mi |
| 9964 Meadow Ave Saint Louis, MO | 1.0 | 1.0 | 950 | $775 | $0.82 | 8d | 1 | 1.02mi |
| 813 W Courtois St Apt C St. Louis, MO | 2.0 | 1.0 | 1000 | $895 | $0.90 | 44d | 1 | 1.10mi |
| 807 W Courtois St Apt D St. Louis, MO | 2.0 | 1.0 | 900 | $925 | $1.03 | 44d | 1 | 1.10mi |
| 807 W Courtois St Apt B St. Louis, MO | 1.0 | 1.0 | 600 | $735 | $1.23 | 44d | 1 | 1.10mi |
| 815 W Courtois St St. Louis, MO | 1.0 | 1.0 | 900 | $795 | $0.88 | 15d | 1 | 1.10mi |
| 7851 Bandero Dr Saint Louis, MO | 1.0–2.0 | 1.0 | 800 | $1,100 | $1.38 | 12d | 1 | 1.12mi |
| 812 Schirmer St Saint Louis, MO | 1.0 | 1.0 | 900 | $795 | $0.88 | 44d | 1 | 1.16mi |
| 7614 Virginia Ave Unit 7614 St. Louis, MO | 2.0 | 1.0 | 750 | $750 | $1.00 | 24d | 1 | 1.19mi |
| 4236 Fatima Dr Apt 4 St. Louis, MO | 1.0 | 1.0 | 800 | $925 | $1.16 | 11d | 1 | 1.23mi |
| 3945 Crosby Dr Saint Louis, MO | 2.0 | 1.0 | 1100 | $2,083 | $1.89 | 2d | 1 | 1.32mi |
| 125 Koeln Ave Saint Louis, MO | 2.0 | 1.0 | 833 | $1,499 | $1.80 | 44d | 1 | 1.33mi |
| 274 Kingston Dr St. Louis, MO | 2.0 | 1.0 | 522 | $1,149 | $2.20 | 2d | 4 | 1.33mi |
| 7417 Vermont Ave Unit 103 St. Louis, MO | 2.0 | 2.0 | 1069 | $1,500 | $1.40 | 15d | 1 | 1.33mi |
| 7417 Vermont Ave St. Louis, MO | 1.0–2.0 | 1.0–2.0 | 1144 | $1,600 | $1.40 | 2d | 8 | 1.34mi |
| 7320 Vermont Ave Unit 2nd St. Louis, MO | 1.0 | 1.0 | 710 | $750 | $1.06 | 44d | 1 | 1.41mi |
Listing history 30 events
-
2026-06-18days on market $124,900 Active 43 DOM
-
2026-06-17days on market $124,900 Active 42 DOM
-
2026-06-16days on market $124,900 Active 41 DOM
-
2026-06-15days on market $124,900 Active 40 DOM
-
2026-06-13days on market $124,900 Active 38 DOM
-
2026-06-13pricedays on market $124,900 Active 37 DOM
-
2026-06-09days on market $127,500 Active 34 DOM
-
2026-06-08days on market $127,500 Active 33 DOM
-
2026-06-07days on market $127,500 Active 32 DOM
-
2026-06-03days on market $127,500 Active 28 DOM
-
2026-06-02days on market $127,500 Active 27 DOM
-
2026-06-01days on market $127,500 Active 26 DOM
-
2026-05-31days on market $127,500 Active 25 DOM
-
2026-05-06$132,500 Active 674-char remark
-
2025-11-21status Pending
-
2025-11-13price $137,500
-
2025-10-29$144,900 Active
-
2025-10-15$144,900 Active
-
2025-08-25price $144,900
-
2025-07-23$150,000 Active
-
2021-12-22soldstatus
-
2021-12-15soldstatus Closed
-
2021-10-26status Pending
-
2021-10-13$115,000 Active
-
2015-04-27soldstatus $30,000
-
2015-04-22soldstatus Closed
-
2015-04-08historical
-
2015-03-27$36,900 Active
-
2015-02-14historical
-
2015-01-27$39,900 Active
ⓘ Source: listings_history table (triggers on properties + properties_extension) + one-shot
backfill from property_details.listing_events for pre-trigger history.
Tax reassessment forecast MO · Resets to sale price
- Current annual tax
- $851 · $71/mo
- Projected year-2 tax
- $1,212 · $101/mo
- Expected delta
- +$360/yr (+$30/mo · 42.3%)
ⓘ Screening estimate from a state-policy table — verify with the county assessor before closing.
Climate risk First Street
- Flood 1/10 Low FEMA zone X (unshaded) · 0% chance over 30 yrs
- Wildfire 1/10 Low
- Heat 5/10 Major 7 d/yr ≥108°F today · 21 d/yr by 30 yrs out
- Wind 2/10 Low 100% chance of damaging wind over 30 yrs
- Air quality 3/10 Moderate 2 unhealthy d/yr today · 3 by 30 yrs out
Nearby sold comps map
Loading sold comps map…
Walkable amenities ~0.75 mi
Loading nearby amenities…
Taxation est. · year 1
- Rental income
- $15,493
- − Mortgage interest
- −$6,996
- − Property taxes
- −$851
- − Insurance
- −$624
- − Repairs & maintenance
- −$1,239
- − Management
- −$1,239
- − Depreciation
- −$3,633
- Taxable income
- $908
- Est. tax owed @ 24.0%
- −$218
- After-tax cash flow
- $2,686/yr
For passive investors: Depreciation is non-cash, so a rental often shows a tax loss while cash-flowing — sheltering income. Rental losses are passive: they offset passive income freely, and up to $25,000/yr can offset ordinary (W-2) income if you actively participate and your MAGI is under $100k (phasing out to $0 by $150k); unused losses carry forward. On sale, claimed depreciation is recaptured at up to 25%, and gains may owe capital-gains tax (a 1031 exchange can defer both). Figures are a year-1 estimate at your 24.0% rate — not tax advice; consult a CPA.
Schools (NCES district)
- District
- Hancock Place
- NCES district ID
- 2913620
- Math proficiency
- 30% ▼ -16.00%
- Reading proficiency
- 34% ▼ -11.00%
- Median HH income
- $41,890
- Composite
- 27.08/100
- National rank
- #7048
- State rank
- #251 of 324 in MO
Livability — Lemay
- Score
- 67/100
- State rank
- #213
- US rank
- #10652
Category grades
Schools grade is shown separately in the Schools card above.
Census & demographics
- Census place
- Lemay, MO
- County
- Saint Louis County · 888,823 people
- City population
- 33,294
- Metro
- St. Louis, MO-IL
- Population (ZIP)
- 33,294
- Household income
- $61,624
- Rent vs Own
- Severe rent burden
- 631.0
Population outlook (St. Louis County) Hauer SSP2
- Today (2025)
- 1,025,227 people
- By 2030
- 1,028,023 · +0.3%
- By 2040
- 1,020,940 · -0.4%
- By 2050
- 1,007,280 · -1.8%
- By 2075
- 987,277 · -3.7%
- By 2100
- 921,984 · -10.1%
Race, ethnicity, and origin ACS 2023
- Neighborhood character
- Predominantly White (86%)
- Race & ethnicity
- White 86% Two or more races 5% Black 4% Hispanic / Latino 4% Asian 2%
- Common ancestry
- American 9% Romanian 3% Lithuanian 3%
- Foreign-born
- 14% · Canada, Vietnam
- Languages at home
- 83% English-only · Russian/Polish/Slavic 11% Spanish 3% Vietnamese 1%
Political lean MEDSL · St. Louis
- 2024 margin
- Strong D (+23.4) · D 60.8% · R 37.4% · Other 1.7%
- 2008→2024 swing
- +3.5pp toward D · 2008: 19.9pp · 2024: 23.4pp
- All cycles
- 2024: D+23.4 2020: D+24.0 2016: D+16.2 2012: D+13.7 2008: D+19.9
Not yet ingested
- Civics
- —
Market trends
- HPI YoY
- ▼ -173.27%
- Current HPI
- 234.3792
- Rent YoY
- —
- Metro
- St. Louis, MO-IL
- State GDP YoY
- ▲ 1.84%
- F500 in state
- 20
Industry mix (Fortune 500 HQ in MO)
| Industry | F500 HQs | Revenue |
|---|---|---|
| Healthcare | 1 | $163B |
|
||
| Insurance | 1 | $21B |
|
||
| Industrial Technology | 1 | $17B |
|
||
| Retail | 1 | $16B |
|
||
| Industrial Distribution | 1 | $10B |
|
||
| Utilities | 1 | $9B |
|
||
Price history
+213.0% since first listed19 events — show timeline
- 2026-06-10 Price Changed $124,900 MARIS as Distributed by MLS Grid
- 2026-05-28 Price Changed $127,500 MARIS as Distributed by MLS Grid
- 2026-05-06 Listed $132,500 MARIS as Distributed by MLS Grid
- 2025-11-21 Pending — MARIS as Distributed by MLS Grid
- 2025-11-13 Price Changed $137,500 MARIS as Distributed by MLS Grid
- 2025-10-29 Listed $144,900 MARIS as Distributed by MLS Grid
- 2025-10-15 Listed $144,900 MARIS as Distributed by MLS Grid
- 2025-08-25 Price Changed $144,900 MARIS as Distributed by MLS Grid
- 2025-07-23 Listed $150,000 MARIS as Distributed by MLS Grid
- 2021-12-22 Sold (Public Records) — Public Records
- 2021-12-15 Sold (MLS) — MARIS as Distributed by MLS Grid
- 2021-10-26 Pending — MARIS as Distributed by MLS Grid
- 2021-10-13 Listed $115,000 MARIS as Distributed by MLS Grid
- 2015-04-27 Sold (Public Records) $30,000 Public Records
- 2015-04-22 Sold (MLS) — MARIS as Distributed by MLS Grid
- 2015-04-08 Delisted — MARIS as Distributed by MLS Grid
- 2015-03-27 Listed $36,900 MARIS as Distributed by MLS Grid
- 2015-02-14 Delisted — MARIS as Distributed by MLS Grid
- 2015-01-27 Listed $39,900 MARIS as Distributed by MLS Grid
Property tax history
+2.8%/yrLatest (2022): $851 · +1.7% YoY. Source: county tax records.
Cash-flow waterfall
monthlySold comps — $/sqft
last 12 mo · ≤1 miLoading sold comps…