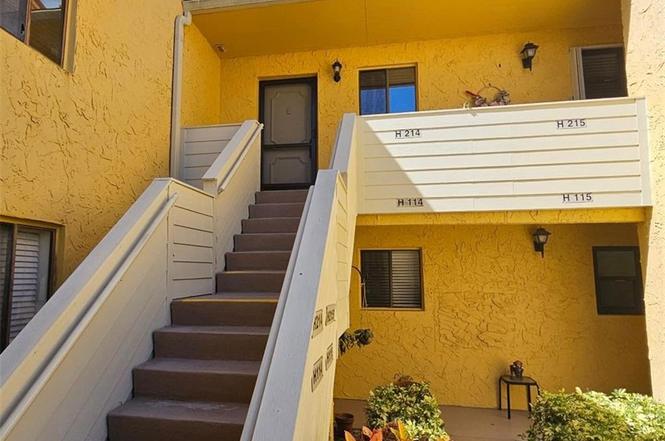
5335 SE Miles Grant Rd #214 · Port Salerno, FL
Flood risk 1/10 · Minimal
- FEMA flood zone
- X (unshaded)
- Chance of flooding over 30 yrs
- 0.0%
- Est. flood insurance / yr
- $507 – $1,088
Fire risk 1/10 · Minimal
- Est. fire insurance / yr
- $947 – $1,759
Heat risk 10/10 · Severe
- Hot days now (above 106°F)
- 7 days/yr
- Hot days in 30 yrs
- 25 days/yr
Wind risk 10/10 · Severe
- Chance of severe wind over 30 yrs
- 99.0%
Air-quality risk 2/10 · Minimal
- Unhealthy air days now
- 1 days/yr
- Unhealthy air days in 30 yrs
- 1 days/yr
Risk factors via First Street. Map © Google.
Why this score? — see what drove the C+ grade
The composite is a weighted blend of 9 inputs, each scored 0–100. Each bar is that input's sub-score; the figure is the points it added to the 100-point composite (weight × sub-score).
- Cash flow +24.6/30.0
- 1% rule +9.4/10.0
- DSCR +7.9/10.0
- ARV discount +7.5/15.0
- Schools +4.5/10.0
- Livability +3.5/5.0
- Rent growth +3.2/5.0
- Condition / age +2.5/5.0
- Appreciation +0.0/10.0
$160,000
🖨 Deal sheet 📄 Offer letter ✓ Due diligence
Listing remarks
THIS CHARMING 2-BEDROOM, TWO BATH CONDO OFFERS AN UNBEATABLE COMBINATION OF COMFORT, CONVENIENCE, AND AFFORDABILITY. WHETHER YOU ARE LOOKING FOR A SEASONAL RETREAT OR YEAR-ROUND RESIDENCE, THIS UNIT PROVIDES THE PERFECT OPPORTUNITY TO ENJOY THE FLORIDA LIFESTYLE WITHOUT BREAKING THE BANK. FEATURES INCLUDE SPACIOUS LAYOUT WITH NATURAL LIGHT. THE UNIT IS BRIGHT AND SUNNY, TWO BEDROOM CORNER UNIT WITH SWEEPING VIEWS OF THE GOLF COURSE. IT HAS BEEN FRESHLY PAINTED, IMPACT DOOR ON THE LANAI. NEWER KITCHEN CABINETS, UPDATED BATHROOMS, VINYL FLOORING IN KITCHEN AND LIVING ROOM, AND HAS PLENTY OF CLOSET SPACE. ENJOY YOUR MORNING COFFEE ON THE LANAI OVERLOOKING THE 8TH TEE BOX. MILES GRANT OFFERS RE
Key facts
- Vinyl flooring
- Impact door
- Sweeping views
Tags
Property features AI
Finance
- Financial info: Pets not allowed
- HOA & community: Homeowners association with a monthly/periodic fee of $412; HOA covers common areas, cable TV, insurance, grounds maintenance, and structure maintenance; Senior community
Exterior
- Utilities: Electricity connected (3-phase)
- Home design: 2-story property; Resale home
- Construction: Block and concrete construction
- Exterior features: Community pool; Community amenities include barbecue, clubhouse, game room, billiard room, library, restaurant, trails/paths, putting green, bocce court, pickleball, golf, and pool; Non-gated community; Property manager on-site; Bicycle storage
Interior
- Kitchen: Dishwasher; Electric range; Garbage disposal; Icemaker; Microwave
- Bathrooms: 2 full bathrooms
- Heating & cooling: Central air conditioning; Central heating; Individual heating controls
- Interior features: Unfurnished; Attic with pull-down stairs; Living/dining room; Split bedrooms layout
Neighborhood map
What this means for you Summary
Snapshot
- This is a 2-bed/2.0-bath condo listed at $160k.
Deal economics
- At list price, monthly cash flow is $330 ($4k/yr) — positive.
- The deal already cash-flows at list — no discount required.
- Meets the 1% rule at list price ($2k rent vs $160k).
- Recommended offer: $141k (12.0% below list) — sets the bar for market timing.
- Cap rate 8.8% vs local median 3.1% in Port Salerno — top-decile yield for the area; either an underpriced asset or a hidden risk that comps aren't pricing in. Stress-test before assuming the spread holds.
Location & tenants
- Location reads 70/100 on livability (#440 in FL) — a middle-class / working-renter tenant base. Strengths: housing A+, crime A, health & safety A; Watch: schools D, amenities F, commute F.
- Martin (suburban): math 52% / reading 53% proficiency, ranked #24 of 73 in FL (top 33%) — acceptable for families but not a draw, mixed tenant base, ~2y average lease.
- Market conditions: Rents rising (+2.7%/yr); 588 active listings in the ZIP; 25 comparable units currently listed for rent nearby; rentals at typical pace (median 24d on market — plan ~3-4 weeks tenant-placement turnaround); solid renter incomes; 737 units permitted in Martin County in 2024 (167 in 5+ unit buildings).
- This rent runs 35% of the median local income ($78k/yr) — at the standard rent-burdened threshold; future hikes will face affordability resistance.
Forward outlook
- Local home prices are declining (-3.0%/yr); year-one equity from $1k of loan paydown is wiped out by about $5k of value loss. Plan a longer hold.
- Martin County population projected at +19% by 2050 — long-run rental-demand tailwind backs the buy-and-hold thesis.
Negotiation context
- It's been on market 261 days — a 12% lower offer ($141k) is reasonable based on typical stale-listing flexibility.
- 2 sale attempts; this cycle's ask has dropped $15k (9%) from the opening price — seller is motivated, your offer sets the floor, not the list.
Risks & watch-outs
- Climate carrying-cost: severe wind risk, 99% chance of damaging wind over 30y; extreme-heat days projected 7→25/yr by 2055 (HVAC capex compounding) — expect insurance premiums to compound above CPI over the hold.
Questions for the listing agent
- It's been on market 261 days. Have you received any prior offers? Is the seller open to a 12% concession, seller financing, or rate buy-down credit?
- Built in 1974 — when were the roof, HVAC, electrical panel, plumbing, and water heater last replaced?
- What does the HOA fee cover, when was the last increase, and are there any pending special assessments or reserve-fund shortfalls?
- Any open or pending special assessments — roof, HVAC, plumbing, elevator, façade? What's the per-unit balance and payoff schedule, and is the seller paying it off at close or rolling it to the buyer?
- Why hasn't it sold? Are there any deal-killer items the seller is aware of (foundation, flood, title, zoning, code violations)?
- Is there a deadline driving the sale (1031 exchange, divorce, estate, relocation)? That informs how much negotiation room exists.
- Schools are D-rated, which usually means shorter tenancies and higher turnover. Who's the typical renter profile here, and what's been the actual vacancy rate?
- What's the average days-on-market for RENTAL listings here right now (not sales)? A rising rental-DOM trend means longer vacancies and softer asking-rent achievability than the comps imply.
- What's the recent tenant-quality profile in this submarket — average credit score on applications, eviction rate, late-payment / NSF rate, and stable-employment percentage? A property-management company in the area should have these aggregated.
- How much new apartment / multifamily construction is in the pipeline within 1–3 miles? Heavy new supply (>2% of stock underway) typically softens rents 12–24 months out; light construction supports rent growth.
Investment metrics
- 1% rule
- 1.44% ✓
- Cap rate
- 8.77%
- Cash-on-cash
- 8.83%
- DSCR
- 1.39
- GRM
- 5.8
CMA / ARV
No comps found within radius.
Projected returns pro-forma
-3.0% appreciation · 2.71% rent growth · sell at horizon
- IRR
- -3.2%
- Equity multiple
- 0.88×
- Total profit
- $-5,330
- Equity at exit
- $23,857
- IRR
- 6.3%
- Equity multiple
- 1.46×
- Total profit
- $20,761
- Equity at exit
- $13,834
Cash invested: $44,800 (down + closing). Projections, not guarantees.
Landlord ↔ Tenant lean methodology
- Overall (STATE)
- 87 Strongly Landlord-Friendly
- State Florida
- 87 Strongly Landlord-Friendly · R+3
- County
- — inherits STATE
- City
- — inherits STATE
ZIP-level market 34997
- Rents YoY
- 2.7%
- Active inventory
- 588
- Price-to-rent
- 5.8×
Monthly cashflow live
- Estimated rent
- $2,304 high interval (Pro) →
- Mortgage (P&I)
- −$839
- Tax from tax record
- −$173 /mo · $2,070/yr
- Insurance
- −$67
- HOA
- −$412
- Vacancy / Maint / Mgmt
- −$484
- Net cashflow
- $330
Break-even live
UW: 25.0% down · 7.5% · 30yr · 1.5% tax · 5.0% vac · 8.0% maint · 8.0% mgmt
Financing live
Cash to close
- Down payment
- $40,000
- Closing costs
- $4,800
- Reserves months
- —
- Total cash needed
- —
Loan-product check · same deal, 3 products live
Conventional
25% down · 7.5% · 30yr
- Down + closing
- —
- Monthly P&I
- —
- Monthly cashflow
- —
- DSCR
- —
- Eligible?
- —
Personal DTI + credit; lowest rate.
DSCR
20% down · 8.5% · 30yr
- Down + closing
- —
- Monthly P&I
- —
- Monthly cashflow
- —
- DSCR
- —
- Eligible?
- —
No personal income docs; deal must DSCR.
Hard money
10% down · 12.0% · 12mo
- Down + closing
- —
- Monthly P&I
- —
- Monthly cashflow
- —
- DSCR
- —
- Eligible?
- —
Short-term bridge; refi at stabilization.
Rent comps 25 comps
| Address | Beds | Baths | Sqft | Rent | $/sqft | DOM | Units | Dist |
|---|---|---|---|---|---|---|---|---|
| 5403 SE Miles Grant Rd Stuart, FL | 2.0 | 2.0 | 1186 | $1,750 | $1.48 | 23d | 2 | 0.10mi |
| 5674 SE Riverboat Dr #131 Stuart, FL | 2.0 | 2.5 | 1288 | $2,600 | $2.02 | 23d | 1 | 0.28mi |
| 5674 SE Riverboat Dr #131 Stuart, FL | 2.0 | 2.5 | 1288 | $2,400 | $1.86 | 21d | 1 | 0.28mi |
| 6003 SE Riverboat Dr #802 Stuart, FL | 2.0 | 2.5 | 1288 | $2,200 | $1.71 | 23d | 1 | 0.39mi |
| 6021 SE Landing Way #2 Stuart, FL | 2.0 | 2.0 | 1135 | $2,500 | $2.20 | 23d | 1 | 0.47mi |
| 6082 SE Landing Way #7 Stuart, FL | 2.0 | 2.0 | 1135 | $3,000 | $2.64 | 23d | 1 | 0.52mi |
| 6142 SE Landing Way Unit 9-11 Stuart, FL | 2.0 | 2.0 | 1135 | $3,500 | $3.08 | 23d | 1 | 0.53mi |
| 6146 SE Riverboat Dr #918 Stuart, FL | 2.0 | 2.5 | 1288 | $1,950 | $1.51 | 23d | 1 | 0.60mi |
| 4885 SE Capstan Ave #27 Stuart, FL | 2.0 | 2.0 | 1273 | $2,500 | $1.96 | 23d | 1 | 0.74mi |
| 4710 SE Glenridge Trl Stuart, FL | 3.0 | 2.0 | 1442 | $3,300 | $2.29 | 14d | 1 | 0.78mi |
| 5045 SE Primrose Way Stuart, FL | 2.0 | 2.0 | 837 | $1,900 | $2.27 | 14d | 1 | 0.86mi |
| 4606 SE Binnacle Way Unit 1 Stuart, FL | 2.0 | 1.0 | 928 | $1,850 | $1.99 | 14d | 1 | 0.88mi |
| 5359 SE Dell St Stuart, FL | 3.0 | 2.0 | 1272 | $2,800 | $2.20 | 23d | 1 | 0.94mi |
| 5393 SE 48th Ave Unit C Stuart, FL | 1.0 | 1.0 | 750 | $1,550 | $2.07 | 23d | 1 | 1.01mi |
| 5795 SE Mitzi Ln Stuart, FL | 3.0 | 2.0 | 1315 | $3,000 | $2.28 | 23d | 1 | 1.02mi |
| 5803 SE Collins Ave Stuart, FL | 2.0 | 2.0 | 874 | $2,200 | $2.52 | 23d | 1 | 1.05mi |
| 4404 SE Mulford Ln Stuart, FL | 2.0 | 1.0 | 834 | $2,500 | $3.00 | 23d | 1 | 1.11mi |
| 4107 SE Barcelona St Stuart, FL | 2.0 | 1.0 | 1224 | $2,500 | $2.04 | 23d | 1 | 1.23mi |
| 5833 SE 47th Ave Stuart, FL | 1.0 | 1.0 | 700 | $1,500 | $2.14 | 23d | 2 | 1.24mi |
| 4095 SE Centerboard Ln Unit 6B Stuart, FL | 2.0 | 2.0 | 1154 | $3,750 | $3.25 | 23d | 1 | 1.36mi |
| 4667 SE Salvatori Rd Unit 4667 Stuart, FL | 2.0 | 2.0 | 800 | $2,100 | $2.62 | 23d | 1 | 1.39mi |
| 3901 SE Saint Lucie Blvd Stuart, FL | 2.0 | 2.0–2.5 | 1407 | $3,875 | $2.75 | 23d | 4 | 1.39mi |
| 4939 SE Salvatori Rd Stuart, FL | 3.0 | 2.0 | 1334 | $2,500 | $1.87 | 23d | 1 | 1.41mi |
| 3901 SE Saint Lucie Blvd Unit D29 Stuart, FL | 2.0 | 2.0 | 1460 | $3,000 | $2.05 | 23d | 1 | 1.41mi |
| 5881 SE Windsong Ln Stuart, FL | 2.0 | 2.5 | 1288 | $2,100 | $1.63 | 14d | 1 | 1.49mi |
HOA detail condo
- Monthly dues
- $412 · $4,944/yr
- Assessments
- None detected in remarks — confirm with the listing agent.
Listing history 8 events
-
2026-05-22soldstatus $140,000 Closed
-
2026-04-13status Pending
-
2026-02-26price $160,000
-
2025-12-01price $170,000
-
2025-09-26status Active
-
2025-06-20$175,000 Active
-
2007-12-31soldstatus $32,000
-
1999-06-11soldstatus $68,000
ⓘ Source: listings_history table (triggers on properties + properties_extension) + one-shot
backfill from property_details.listing_events for pre-trigger history.
Tax reassessment forecast FL · Resets to sale price
- Current annual tax
- $2,070 · $173/mo
- Projected year-2 tax
- $2,070 · $173/mo
- Expected delta
- $0/yr ($0/mo · 0.0%)
ⓘ Screening estimate from a state-policy table — verify with the county assessor before closing.
Climate risk First Street
- Flood 1/10 Low FEMA zone X (unshaded) · 0% chance over 30 yrs
- Wildfire 1/10 Low
- Heat 10/10 Extreme 7 d/yr ≥106°F today · 25 d/yr by 30 yrs out
- Wind 10/10 Extreme 99% chance of damaging wind over 30 yrs
- Air quality 2/10 Low 1 unhealthy d/yr today · 1 by 30 yrs out
Nearby sold comps map
Loading sold comps map…
Walkable amenities ~0.75 mi
Loading nearby amenities…
Taxation est. · year 1
- Rental income
- $27,644
- − Mortgage interest
- −$8,962
- − Property taxes
- −$2,070
- − Insurance
- −$800
- − Repairs & maintenance
- −$2,212
- − Management
- −$2,212
- − HOA
- −$4,944
- − Depreciation
- −$4,655
- Taxable income
- $1,790
- Est. tax owed @ 24.0%
- −$430
- After-tax cash flow
- $3,526/yr
For passive investors: Depreciation is non-cash, so a rental often shows a tax loss while cash-flowing — sheltering income. Rental losses are passive: they offset passive income freely, and up to $25,000/yr can offset ordinary (W-2) income if you actively participate and your MAGI is under $100k (phasing out to $0 by $150k); unused losses carry forward. On sale, claimed depreciation is recaptured at up to 25%, and gains may owe capital-gains tax (a 1031 exchange can defer both). Figures are a year-1 estimate at your 24.0% rate — not tax advice; consult a CPA.
Schools (NCES district)
- District
- Martin
- NCES district ID
- 1201290
- Math proficiency
- 52% ▼ -14.00%
- Reading proficiency
- 53% ▼ -4.00%
- Median HH income
- $52,482
- Composite
- 45.1/100
- National rank
- #2690
- State rank
- #24 of 73 in FL
Livability — Port Salerno
- Score
- 70/100
- State rank
- #440
- US rank
- #7873
Category grades
Schools grade is shown separately in the Schools card above.
Census & demographics
- Census place
- Port Salerno, FL
- County
- Martin County · 165,223 people
- Metro
- Port St. Lucie, FL
- Population (ZIP)
- 47,075
- Household income
- $78,136
- Rent vs Own
- Severe rent burden
- 1323.0
Population outlook (Martin County) Hauer SSP2
- Today (2025)
- 172,383 people
- By 2030
- 180,192 · +4.5%
- By 2040
- 194,114 · +12.6%
- By 2050
- 204,992 · +18.9%
- By 2075
- 229,641 · +33.2%
- By 2100
- 232,146 · +34.7%
Race, ethnicity, and origin ACS 2023
- Neighborhood character
- Predominantly White (74%)
- Race & ethnicity
- White 74% Hispanic / Latino 19% Two or more races 9% Black 3% Asian 1%
- Hispanic origin (detail)
- Mexican 4% Puerto Rican 2% Cuban 3%
- Common ancestry
- Romanian 3% Lithuanian 3% Slovak 2%
- Foreign-born
- 14% · Canada, Jamaica, China
- Languages at home
- 81% English-only · Spanish 14% French/Haitian/Cajun 2% Other Indo-European 1%
Political lean MEDSL · Martin
- 2024 margin
- Solid R (+31.1) · D 34.1% · R 65.2%
- 2008→2024 swing
- -17.5pp toward R · 2008: -13.6pp · 2024: -31.1pp
- All cycles
- 2024: R+31.1 2020: R+24.6 2016: R+26.9 2012: R+22.9 2008: R+13.6
Not yet ingested
- Civics
- —
Market trends
- HPI YoY
- ▼ -319.78%
- Current HPI
- 336.7717
- Rent YoY
- ▲ 2.71%
- Metro
- Port St. Lucie, FL
- State GDP YoY
- ▲ 3.28%
- F500 in state
- 36
Industry mix (Fortune 500 HQ in FL)
| Industry | F500 HQs | Revenue |
|---|---|---|
| Industrial Technology | 2 | $29B |
|
||
| Insurance | 2 | $17B |
|
||
| Retail | 1 | $60B |
|
||
| Technology Distribution | 1 | $58B |
|
||
| Homebuilding | 1 | $35B |
|
||
| Technology Manufacturing | 1 | $35B |
|
||
Price history
+105.9% since first listed8 events — show timeline
- 2026-05-22 Sold (MLS) $140,000 MCRTC
- 2026-04-13 Pending — MCRTC
- 2026-02-26 Price Changed $160,000 MCRTC
- 2025-12-01 Price Changed $170,000 MCRTC
- 2025-09-26 Relisted — MCRTC
- 2025-06-20 Listed $175,000 MCRTC
- 2007-12-31 Sold (Public Records) $32,000 Public Records
- 1999-06-11 Sold (Public Records) $68,000 Public Records
Property tax history
+8.4%/yrLatest (2025): $2,070 · -1.6% YoY. Source: county tax records.
Cash-flow waterfall
monthlySold comps — $/sqft
last 12 mo · ≤1 miLoading sold comps…