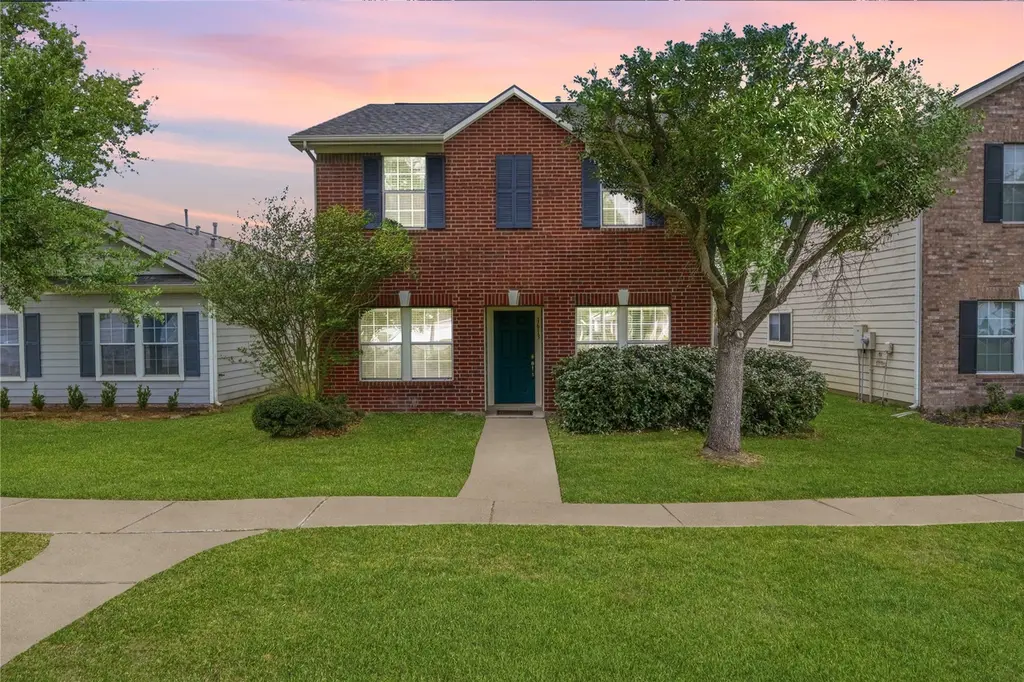
1613 Palcio Real Dr · Houston, TX
Flood risk 1/10 · Minimal
- FEMA flood zone
- X (unshaded)
- Chance of flooding over 30 yrs
- 0.0%
- Est. flood insurance / yr
- $507 – $1,088
Fire risk 1/10 · Minimal
- Est. fire insurance / yr
- $1,222 – $2,270
Heat risk 9/10 · Severe
- Hot days now (above 109°F)
- 7 days/yr
- Hot days in 30 yrs
- 25 days/yr
Wind risk 9/10 · Severe
- Chance of severe wind over 30 yrs
- 99.0%
Air-quality risk 2/10 · Minimal
- Unhealthy air days now
- 2 days/yr
- Unhealthy air days in 30 yrs
- 2 days/yr
Risk factors via First Street. Map © Google.
Why this score? — see what drove the D+ grade
The composite is a weighted blend of 9 inputs, each scored 0–100. Each bar is that input's sub-score; the figure is the points it added to the 100-point composite (weight × sub-score).
- ARV discount +15.0/15.0
- Cash flow +11.4/30.0
- 1% rule +5.2/10.0
- Livability +3.7/5.0
- DSCR +3.3/10.0
- Schools +2.7/10.0
- Condition / age +2.5/5.0
- Rent growth +2.4/5.0
- Appreciation +0.0/10.0
$244,900
🖨 Deal sheet 📄 Offer letter ✓ Due diligence
Listing remarks
Fresh, bright, and truly move-in ready, this is the kind of home that just feels easy from the moment you walk in. This updated 3-bedroom, 2.5-bath home offers no front neighbors, and peaceful views of the community green space right outside your door. Inside, you’ll find fresh paint, new laminate flooring throughout, tons of natural light, and a layout that gives you room to spread out. The front formal living and dining areas offer great flex space, while the open kitchen and family room create the perfect everyday hangout. The kitchen features updated cabinetry, backsplash, breakfast bar, and included appliances—washer, dryer, and refrigerator stay. Upstairs, enjoy a spacious
Key facts
- 3,955 sq ft lot
- 2 garage spots
- Built 2006
Property features AI
Other
- Documents & disclosures: Municipal Utility District disclosure; Seller disclosure
Finance
- HOA & community: City Park HOA with annual fee; HOA includes trails; Community features include curbs and gutters
Exterior
- Parking: Detached garage with 2 parking spaces; Driveway; Garage door opener
- Security: Smoke detector(s)
- Utilities: Public water; Public sewer
- Home design: Residential property; Built in 2006; Slab foundation; Composition roof; Brick and cement siding
- Construction: Built in 2006; Brick and cement siding; Composition roof; Slab foundation
- Exterior features: Fenced backyard; Subdivision lot; Concrete road surface; Trail(s) access via HOA
Interior
- Kitchen: Dishwasher; Disposal; Gas oven; Gas range; Refrigerator; Breakfast nook (first level) — 10 x 9; Kitchen area (first level) — 10 x 10
- Bedrooms: Primary bedroom (second level) — 15 x 15; Bedroom (second level) — 11 x 12; Bedroom (second level) — 11 x 12
- Flooring: Plank; Tile; Vinyl
- Bathrooms: 2 full bathrooms; 1 half bathroom; Primary bathroom (second level) — 9 x 9; Additional bathroom (second level); Additional bathroom (first level) — 3 x 7
- Heating & cooling: Central heating (gas); Central air (electric); Programmable thermostat
- Interior features: Breakfast bar; Kitchen/family room combo; Laminate counters; Primary bathroom with soaking tub and separate shower; Pantry; Tub/shower; Vanity; Window treatments; Ceiling fan(s); Kitchen/dining combo; Programmable thermostat; Gas log fireplace
- Laundry & utility: Washer hookup; Electric dryer hookup; Gas dryer hookup; Utility room (first level) — 7 x 7
Neighborhood map
What this means for you Summary
Snapshot
- This is a 3-bed/2.5-bath single-family listed at $245k.
Deal economics
- At list price, monthly cash flow is $-85 ($-1k/yr) — negative.
- To cash-flow at today's rent, offer at most $230k (6.1% below list).
- Meets the 1% rule at list price ($3k rent vs $245k).
- Recommended offer: $230k (6.1% below list) — sets the bar for cash-flow.
- Cap rate 5.9% vs local median 3.2% in Houston — top-decile yield for the area; either an underpriced asset or a hidden risk that comps aren't pricing in. Stress-test before assuming the spread holds.
Location & tenants
- Location reads 74/100 on livability (#184 in TX, #4,771 nationally) — a middle-class / working-renter tenant base. Strengths: amenities A+, cost of living A+, housing A+; Watch: crime F.
- Houston ISD (urban): math 27% / reading 35% proficiency, ranked #593 of 826 in TX (top 72%) — families likely to look elsewhere, expect single-tenant / working-renter base with shorter leases; 71% free/reduced lunch — lower-income household profile, screen leases tightly.
- Zoned schools: Lawson Middle (math 21% / reading 27%, grade F, #1,301 of 1,662 statewide, top 79%, 1,274 students, 96% FRL); Worthing H S (math 22% / reading 21%, grade F, #1,377 of 1,632 statewide, top 85%, 827 students, 96% FRL) — zoned schools average 96% FRL vs 71% district-wide (25 pts higher); higher-poverty schools than district average — tighter screening recommended.
- Market conditions: Rents soft (-0.2%/yr); 280 active listings in the ZIP; 9 comparable units currently listed for rent nearby; rentals at typical pace (median 19d on market — plan ~3-4 weeks tenant-placement turnaround); 44% of comp listings sitting > 30 days — soft ceiling on asking rent; solid renter incomes; 29,883 units permitted in Harris County in 2024 (8,621 in 5+ unit buildings).
- This rent runs 38% of the median local income ($79k/yr) — at the standard rent-burdened threshold; future hikes will face affordability resistance.
Forward outlook
- Local home prices are declining (-3.0%/yr); year-one equity from $2k of loan paydown is wiped out by about $7k of value loss. Plan a longer hold.
- Harris County population projected at +47% by 2050 — long-run rental-demand tailwind backs the buy-and-hold thesis.
Negotiation context
- It's been on market 67 days — a 6% lower offer ($230k) is reasonable based on typical stale-listing flexibility.
- 3 sale attempts since 16y ago with the ask held roughly flat each time — persistent listings suggest the price (not the market) is what's stuck; bring a comps-based counter.
Risks & watch-outs
- Watch-outs: property tax is 2.9% of price.
- Climate carrying-cost: severe wind risk, 99% chance of damaging wind over 30y; extreme-heat days projected 7→25/yr by 2055 (HVAC capex compounding) — expect insurance premiums to compound above CPI over the hold.
Questions for the listing agent
- What do current leases actually rent for vs. the listed asking? Can we see a recent rent roll and the last 12 months of T-12 income?
- It's been on market 67 days. Have you received any prior offers? Is the seller open to a 6% concession, seller financing, or rate buy-down credit?
- Property tax is high relative to price — has the assessment been appealed recently, and will the sale trigger a re-assessment?
- What does the HOA fee cover, when was the last increase, and are there any pending special assessments or reserve-fund shortfalls?
- Why hasn't it sold? Are there any deal-killer items the seller is aware of (foundation, flood, title, zoning, code violations)?
- Is there a deadline driving the sale (1031 exchange, divorce, estate, relocation)? That informs how much negotiation room exists.
- Schools are D-rated, which usually means shorter tenancies and higher turnover. Who's the typical renter profile here, and what's been the actual vacancy rate?
- Crime grade is F in this area — have there been break-ins, vandalism, or insurance claims at this property in the last 3 years? What carrier currently insures it and at what premium?
- The area grade is low — what's the realistic commute time and amenity access for the typical tenant pool here? Any planned neighborhood developments (good or bad) we should know about?
- What's the average days-on-market for RENTAL listings here right now (not sales)? A rising rental-DOM trend means longer vacancies and softer asking-rent achievability than the comps imply.
- What's the recent tenant-quality profile in this submarket — average credit score on applications, eviction rate, late-payment / NSF rate, and stable-employment percentage? A property-management company in the area should have these aggregated.
- How much new for-sale + rental construction is in the pipeline within 1–3 miles? Heavy new supply typically softens prices + rents 12–24 months out; constrained supply supports both.
Investment metrics
- 1% rule
- 1.02% ✓
- Cap rate
- 5.88%
- Cash-on-cash
- -1.48%
- DSCR
- 0.93
- GRM
- 8.2
CMA / ARV
- ARV (on-the-fly)
- $297,360
- Comps found
- 12
Show comp detail 12 sales within ~0.75 mi
| Address | Dist | Beds/Ba | Sqft | Sold | Price | $/sf | Match |
|---|---|---|---|---|---|---|---|
| 11914 Longwood Garden Way | 0.12mi | 3/2.5 | 2,124 (0%) | 2mo | $270,000 | $127 | 93 |
| 1708 Claremont Garden Cir | 0.14mi | 3/2.5 | 2,132 (+0%) | 0mo | $269,900 | $127 | 92 |
| 11930 Prior Park Dr | 0.06mi | 4/2.5 (+1) | 1,933 (-9%) | 1mo | $255,000 | $132 | 76 |
| 1618 City Nights Way | 0.23mi | 4/2.5 (+1) | 2,249 (+6%) | 3mo | $315,000 | $140 | 72 |
| 12209 City Skyline Ct | 0.23mi | 4/3.0 (+1) | 2,259 (+6%) | 3mo | $340,000 | $151 | 70 |
| 11929 Sanspereil Dr | 0.11mi | 4/2.5 (+1) | 1,820 (-14%) | 1mo | $244,900 | $135 | 65 |
| 1835 Creegan Park Ct | 0.32mi | 4/2.5 (+1) | 1,972 (-7%) | 4mo | $265,000 | $134 | 65 |
| 1406 Lake City Ln | 0.37mi | 4/2.5 (+1) | 2,292 (+8%) | 1mo | $340,000 | $148 | 64 |
| 1926 Lingard Park Ct | 0.42mi | 3/2.0 | 1,926 (-9%) | 2mo | $283,797 | $147 | 62 |
| 11726 Dandy Park Ct | 0.42mi | 3/2.0 | 1,860 (-12%) | 0mo | $289,000 | $155 | 57 |
| 2631 Skyview Downs Dr | 0.73mi | 3/2.5 | 1,965 (-8%) | 2mo | $299,000 | $152 | 52 |
| 2122 Mateo Park Dr | 0.60mi | 4/2.0 (+1) | 2,284 (+8%) | 2mo | $302,000 | $132 | 50 |
Match score weights: distance 35% · size 25% · config 20% · recency 20%. Top-matched comps best support the ARV.
Projected returns pro-forma
-3.0% appreciation · 0.0% rent growth · sell at horizon
- IRR
- -22.8%
- Equity multiple
- 0.24×
- Total profit
- $-52,154
- Equity at exit
- $36,515
- IRR
- -31.3%
- Equity multiple
- -0.16×
- Total profit
- $-79,629
- Equity at exit
- $21,174
Cash invested: $68,572 (down + closing). Projections, not guarantees.
Landlord ↔ Tenant lean methodology
- Overall (STATE)
- 87 Strongly Landlord-Friendly
- State Texas
- 87 Strongly Landlord-Friendly · R+5
- County
- — inherits STATE
- City
- — inherits STATE
ZIP-level market 77047
- Home prices YoY
- -10.1%
- Rents YoY
- -0.2%
- Active inventory
- 280
- Price-to-rent
- 8.2×
Monthly cashflow live
- Estimated rent
- $2,501 high interval (Pro) →
- Mortgage (P&I)
- −$1,284
- Tax from tax record
- −$598 /mo · $7,170/yr
- Insurance
- −$102
- HOA
- −$77
- Vacancy / Maint / Mgmt
- −$525
- Net cashflow
- $-85
Break-even live
UW: 25.0% down · 7.5% · 30yr · 1.5% tax · 5.0% vac · 8.0% maint · 8.0% mgmt
Financing live
Cash to close
- Down payment
- $61,225
- Closing costs
- $7,347
- Reserves months
- —
- Total cash needed
- —
Loan-product check · same deal, 3 products live
Conventional
25% down · 7.5% · 30yr
- Down + closing
- —
- Monthly P&I
- —
- Monthly cashflow
- —
- DSCR
- —
- Eligible?
- —
Personal DTI + credit; lowest rate.
DSCR
20% down · 8.5% · 30yr
- Down + closing
- —
- Monthly P&I
- —
- Monthly cashflow
- —
- DSCR
- —
- Eligible?
- —
No personal income docs; deal must DSCR.
Hard money
10% down · 12.0% · 12mo
- Down + closing
- —
- Monthly P&I
- —
- Monthly cashflow
- —
- DSCR
- —
- Eligible?
- —
Short-term bridge; refi at stabilization.
Rent comps 9 comps
| Address | Beds | Baths | Sqft | Rent | $/sqft | DOM | Units | Dist |
|---|---|---|---|---|---|---|---|---|
| 1409 Woods Lake Ct Houston, TX | 3.0 | 2.5 | 1719 | $2,191 | $1.27 | 44d | 1 | 0.46mi |
| 11826 Fortune Park Dr Houston, TX | 3.0 | 2.0 | 1913 | $2,100 | $1.10 | 44d | 1 | 0.46mi |
| 2706 Skyview Downs Dr Houston, TX | 4.0 | 2.5 | 2464 | $2,200 | $0.89 | 2d | 1 | 0.83mi |
| 2920 Stamford Hill Ln Houston, TX | 3.0 | 2.0 | 1690 | $2,200 | $1.30 | 44d | 1 | 1.10mi |
| 3013 Maughan Heights Trl Houston, TX | 4.0 | 2.5 | 2386 | $5,000 | $2.10 | 1d | 1 | 1.17mi |
| 3020 Gunnersbury Dr Houston, TX | 4.0 | 2.0 | 1670 | $1,499 | $0.90 | 15d | 1 | 1.18mi |
| 13426 Sombrero Cay Dr Houston, TX | 4.0 | 3.0 | 2108 | $2,300 | $1.09 | 44d | 1 | 1.21mi |
| 12320 Chesney Downs Dr Houston, TX | 4.0 | 2.5 | 2000 | $3,500 | $1.75 | 3d | 1 | 1.22mi |
| 13802 Greyfield Ln Houston, TX | 4.0 | 2.5 | 2350 | $2,500 | $1.06 | 19d | 1 | 1.38mi |
HOA detail
- Monthly dues
- $77 · $924/yr
Listing history 17 events
-
2026-06-18days on market $244,900 Active 67 DOM
-
2026-06-17days on market $244,900 Active 66 DOM
-
2026-06-16days on market $244,900 Active 65 DOM
-
2026-06-15days on market $244,900 Active 64 DOM
-
2026-06-13days on market $244,900 Active 62 DOM
-
2026-06-10days on market $244,900 Active 58 DOM
-
2026-06-08days on market $244,900 Active 57 DOM
-
2026-06-07days on market $244,900 Active 56 DOM
-
2026-06-04days on market $244,900 Active 53 DOM
-
2026-06-01days on market $244,900 Active 50 DOM
-
2026-05-31days on market $244,900 Active 49 DOM
-
2026-05-18status Active
-
2026-05-10status Pending
-
2026-05-01status Pending
-
2026-04-03$244,900 Active
-
2011-04-01historical
-
2010-01-23$155,000
ⓘ Source: listings_history table (triggers on properties + properties_extension) + one-shot
backfill from property_details.listing_events for pre-trigger history.
Tax reassessment forecast TX · Resets to sale price
- Current annual tax
- $7,170 · $598/mo
- Projected year-2 tax
- $7,170 · $598/mo
- Expected delta
- $0/yr ($0/mo · 0.0%)
ⓘ Screening estimate from a state-policy table — verify with the county assessor before closing.
Climate risk First Street
- Flood 1/10 Low FEMA zone X (unshaded) · 0% chance over 30 yrs
- Wildfire 1/10 Low
- Heat 9/10 Extreme 7 d/yr ≥109°F today · 25 d/yr by 30 yrs out
- Wind 9/10 Extreme 99% chance of damaging wind over 30 yrs
- Air quality 2/10 Low 2 unhealthy d/yr today · 2 by 30 yrs out
Nearby sold comps map
Loading sold comps map…
Walkable amenities ~0.75 mi
Loading nearby amenities…
Taxation est. · year 1
- Rental income
- $30,015
- − Mortgage interest
- −$13,718
- − Property taxes
- −$7,170
- − Insurance
- −$1,224
- − Repairs & maintenance
- −$2,401
- − Management
- −$2,401
- − HOA
- −$924
- − Depreciation
- −$7,124
- Taxable loss
- −$4,949
- Est. tax savings @ 24.0%
- +$1,188
- After-tax cash flow
- $169/yr
For passive investors: Depreciation is non-cash, so a rental often shows a tax loss while cash-flowing — sheltering income. Rental losses are passive: they offset passive income freely, and up to $25,000/yr can offset ordinary (W-2) income if you actively participate and your MAGI is under $100k (phasing out to $0 by $150k); unused losses carry forward. On sale, claimed depreciation is recaptured at up to 25%, and gains may owe capital-gains tax (a 1031 exchange can defer both). Figures are a year-1 estimate at your 24.0% rate — not tax advice; consult a CPA.
Schools (NCES district)
- District
- Houston ISD
- NCES district ID
- 4823640
- Math proficiency
- 27% ▼ -18.00%
- Reading proficiency
- 35% ▼ -6.00%
- Median HH income
- $46,054
- Composite
- 26.63/100
- National rank
- #7173
- State rank
- #593 of 826 in TX
Livability — Houston
- Score
- 74/100
- State rank
- #184
- US rank
- #4771
Category grades
Schools grade is shown separately in the Schools card above.
Census & demographics
- Census place
- Houston, TX
- County
- Harris County · 4,702,590 people
- City population
- 3,226,434
- Metro
- Houston-The Woodlands-Sugar Land, TX
- Population (ZIP)
- 34,987
- Household income
- $78,538
- Rent vs Own
- Severe rent burden
- 1109.0
Population outlook (Harris County) Hauer SSP2
- Today (2025)
- 5,571,493 people
- By 2030
- 6,089,821 · +9.3%
- By 2040
- 7,142,806 · +28.2%
- By 2050
- 8,185,864 · +46.9%
- By 2075
- 10,574,329 · +89.8%
- By 2100
- 12,109,958 · +117.4%
Race, ethnicity, and origin ACS 2023
- Neighborhood character
- Diverse neighborhood (Simpson 0.58)
- Race & ethnicity
- Black 57% Hispanic / Latino 29% Two or more races 15% White 6% Asian 3% Pacific Islander 1%
- Hispanic origin (detail)
- Mexican 24% Puerto Rican 1%
- Common ancestry
- Lithuanian 1%
- Foreign-born
- 15% · Canada, Vietnam
- Languages at home
- 70% English-only · Spanish 23% Vietnamese 1% Other Indo-European 1%
Political lean MEDSL · Harris
- 2024 margin
- Lean D (+5.5) · D 52.0% · R 46.4% · Other 1.6%
- 2008→2024 swing
- +3.9pp toward D · 2008: 1.6pp · 2024: 5.5pp
- All cycles
- 2024: D+5.5 2020: D+13.3 2016: D+12.4 2012: D+0.1 2008: D+1.6
Not yet ingested
- Civics
- —
Market trends
- HPI YoY
- ▼ -26.76%
- Current HPI
- 239.2287
- Rent YoY
- ▼ -0.21%
- Metro
- Houston-The Woodlands-Sugar Land, TX
- State GDP YoY
- ▲ 3.95%
- F500 in state
- 110
Industry mix (Fortune 500 HQ in TX)
| Industry | F500 HQs | Revenue |
|---|---|---|
| Energy | 16 | $1,198B |
|
||
| Technology | 5 | $198B |
|
||
| Engineering / Construction | 4 | $72B |
|
||
| Energy Services | 3 | $60B |
|
||
| Utilities | 3 | $41B |
|
||
| Healthcare | 2 | $330B |
|
||
Price history
+58.0% since first listed6 events — show timeline
- 2026-05-18 Relisted — HARMLS
- 2026-05-10 Pending — HARMLS
- 2026-05-01 Pending — HARMLS
- 2026-04-03 Listed $244,900 HARMLS
- 2011-04-01 Listing Removed — HARMLS
- 2010-01-23 Listed $155,000 HARMLS
Property tax history
+2.9%/yrLatest (2025): $7,170 · +2.6% YoY. Source: county tax records.
Cash-flow waterfall
monthlySold comps — $/sqft
last 12 mo · ≤1 miLoading sold comps…