2185 Mississippi 25 · Iuka, MS
Flood risk 1/10 · Minimal
- FEMA flood zone
- X (unshaded)
- Chance of flooding over 30 yrs
- 0.0%
- Est. flood insurance / yr
- $507 – $1,088
Fire risk 6/10 · Moderate
- Est. fire insurance / yr
- $1,241 – $2,305
Heat risk 6/10 · Moderate
- Hot days now (above 106°F)
- 7 days/yr
- Hot days in 30 yrs
- 20 days/yr
Wind risk 5/10 · Moderate
- Chance of severe wind over 30 yrs
- 25.0%
Air-quality risk 1/10 · Minimal
- Unhealthy air days now
- 0 days/yr
- Unhealthy air days in 30 yrs
- 0 days/yr
Risk factors via First Street. Map © Google.
Why this score? — see what drove the B- grade
The composite is a weighted blend of 9 inputs, each scored 0–100. Each bar is that input's sub-score; the figure is the points it added to the 100-point composite (weight × sub-score).
- Cash flow +30.0/30.0
- 1% rule +10.0/10.0
- DSCR +10.0/10.0
- ARV discount +7.5/15.0
- Livability +3.2/5.0
- Schools +3.1/10.0
- Rent growth +2.5/5.0
- Condition / age +2.5/5.0
- Appreciation +0.0/10.0
$55,000
🖨 Deal sheet (PDF) 📄 Offer letter ✓ Due diligence
Listing remarks
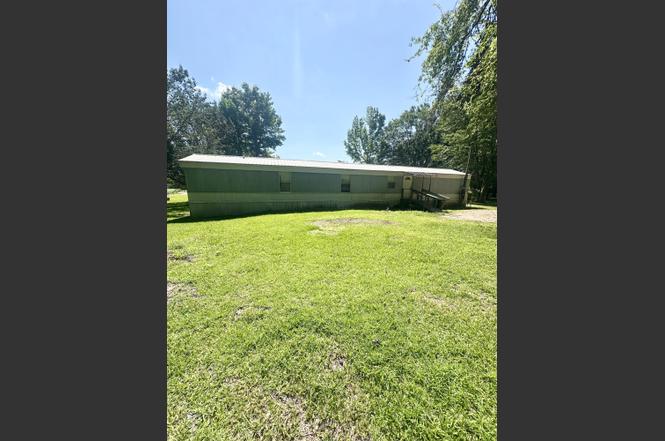
Whether you're a first time home buyer, someone looking to downsize or an investor looking to add to your portfolio, this mobile home suits those needs and more! Situated on +/-1.1 acres, the property is located just south of the town of Iuka and just a few short minutes to JP Coleman and Pickwick. Call your favorite Realtor today to schedule a showing!
Key facts
- 1 acre lot
- Built 2000
- Listed 8 days
Property features AI
Finance
- Financial info: Annual property tax approximately $185.76
Exterior
- Home design: Manufactured home; Residential property
- Exterior features: Approximately 1.1-acre lot; Lot dimensions about 180 x 310; Rural location — ~3 miles south of Iuka on Highway 25
Interior
- Bathrooms: 2 full bathrooms
- Interior features: 6 total rooms
Neighborhood map
What this means for you Summary
Snapshot
- This is a 3-bed/2.0-bath manufactured listed at $55k.
Deal economics
- At list price, monthly cash flow is $492 ($6k/yr) — positive.
- The deal already cash-flows at list — no discount required.
- Meets the 1% rule at list price ($1k rent vs $55k).
Location & tenants
- Location reads 63/100 on livability (#150 in MS) — a middle-class / working-renter tenant base. Strengths: cost of living A+, housing A, crime A-; Watch: schools D, amenities F, commute F.
- Tishomingo County Sp Mun School District (rural): math 37% / reading 39% proficiency, ranked #49 of 130 in MS (top 38%) — families likely to look elsewhere, expect single-tenant / working-renter base with shorter leases.
- Market conditions: 200 active listings in the ZIP; 1 units permitted in Tishomingo County in 2024 (0 in 5+ unit buildings).
Forward outlook
- Local home prices are declining (-3.0%/yr); year-one equity from $380 of loan paydown is wiped out by about $2k of value loss. Plan a longer hold.
- Tishomingo County population projected to shrink 6% by 2050 — rents likely to lag national; underwrite the cash flow, not the appreciation.
- At projected returns (-3.0% appreciation + 3.0% rent growth), your $15k cash investment doubles in ~4 years — after that, you're playing with house money.
Negotiation context
- Only 9 days on market — expect competitive offers; lowballing is unlikely to land.
Risks & watch-outs
- Climate carrying-cost: moderate wind risk, 25% chance of damaging wind over 30y; major wildfire risk; extreme-heat days projected 7→20/yr by 2055 (HVAC capex compounding) — expect insurance premiums to compound above CPI over the hold.
Questions for the listing agent
- Is there a deadline driving the sale (1031 exchange, divorce, estate, relocation)? That informs how much negotiation room exists.
- Schools are D-rated, which usually means shorter tenancies and higher turnover. Who's the typical renter profile here, and what's been the actual vacancy rate?
- What's the average days-on-market for RENTAL listings here right now (not sales)? A rising rental-DOM trend means longer vacancies and softer asking-rent achievability than the comps imply.
- What's the recent tenant-quality profile in this submarket — average credit score on applications, eviction rate, late-payment / NSF rate, and stable-employment percentage? A property-management company in the area should have these aggregated.
- How much new for-sale + rental construction is in the pipeline within 1–3 miles? Heavy new supply typically softens prices + rents 12–24 months out; constrained supply supports both.
Investment metrics
- 1% rule
- 1.88% ✓
- Cap rate
- 17.03%
- Cash-on-cash
- 38.34%
- DSCR
- 2.71
- GRM
- 4.4
CMA / ARV
No comps found within radius.
Projected returns pro-forma
-3.0% appreciation · 3.0% rent growth · sell at horizon
- IRR
- 34.4%
- Equity multiple
- 2.45×
- Total profit
- $22,405
- Equity at exit
- $8,201
- IRR
- 41.3%
- Equity multiple
- 4.88×
- Total profit
- $59,789
- Equity at exit
- $4,755
Cash invested: $15,400 (down + closing). Projections, not guarantees.
Landlord ↔ Tenant lean methodology
- Overall (STATE)
- 90 Strongly Landlord-Friendly
- State Mississippi
- 90 Strongly Landlord-Friendly · R+11
- County
- — inherits STATE
- City
- — inherits STATE
ZIP-level market 38852
- Home prices YoY
- -18.5%
- Active inventory
- 200
- Price-to-rent
- 4.4×
Monthly cashflow live
- Estimated rent
- $1,036 medium interval (Pro) →
- Mortgage (P&I)
- −$288
- Tax from tax record
- −$15 /mo · $186/yr
- Insurance
- −$23
- HOA
- −$0
- Vacancy / Maint / Mgmt
- −$218
- Net cashflow
- $492
Break-even live
Sensitivity live
| Price | -10% $523 | -5% $508 | +0% $492 | +5% $476 | +10% $461 |
|---|---|---|---|---|---|
| Rent | -10% $410 | -5% $451 | +0% $492 | +5% $533 | +10% $574 |
| Rate | -1.0pp $520 | -0.5pp $506 | base $492 | +0.5pp $478 | +1.0pp $463 |
UW: 25.0% down · 7.5% · 30yr · 1.5% tax · 5.0% vac · 8.0% maint · 8.0% mgmt
Financing live
Cash to close
- Down payment
- $13,750
- Closing costs
- $1,650
- Reserves months
- —
- Total cash needed
- —
Loan-product check · same deal, 3 products live
Conventional
25% down · 7.5% · 30yr
- Down + closing
- —
- Monthly P&I
- —
- Monthly cashflow
- —
- DSCR
- —
- Eligible?
- —
Personal DTI + credit; lowest rate.
DSCR
20% down · 8.5% · 30yr
- Down + closing
- —
- Monthly P&I
- —
- Monthly cashflow
- —
- DSCR
- —
- Eligible?
- —
No personal income docs; deal must DSCR.
Hard money
10% down · 12.0% · 12mo
- Down + closing
- —
- Monthly P&I
- —
- Monthly cashflow
- —
- DSCR
- —
- Eligible?
- —
Short-term bridge; refi at stabilization.
Listing history 8 events
-
2026-06-21days on market $55,000 Active 9 DOM
-
2026-06-21days on market $55,000 Active 8 DOM
-
2026-06-18days on market $55,000 Active 6 DOM
-
2026-06-17days on market $55,000 Active 5 DOM
-
2026-06-16days on market $55,000 Active 4 DOM
-
2026-06-15days on market $55,000 Active 3 DOM
-
2026-06-13remarks 355-char remark
-
2026-06-13$55,000 Active 1 DOM
ⓘ Source: listings_history table (triggers on properties + properties_extension) + one-shot
backfill from property_details.listing_events for pre-trigger history.
Tax reassessment forecast MS · Resets to sale price
- Current annual tax
- $186 · $15/mo
- Projected year-2 tax
- $435 · $36/mo
- Expected delta
- +$249/yr (+$21/mo · 133.9%)
ⓘ Screening estimate from a state-policy table — verify with the county assessor before closing.
Climate risk First Street
- Flood 1/10 Low FEMA zone X (unshaded) · 0% chance over 30 yrs
- Wildfire 6/10 Major
- Heat 6/10 Major 7 d/yr ≥106°F today · 20 d/yr by 30 yrs out
- Wind 5/10 Major 25% chance of damaging wind over 30 yrs
- Air quality 1/10 Low 0 unhealthy d/yr today · 0 by 30 yrs out
Nearby sold comps map
Loading sold comps map…
Walkable amenities ~0.75 mi
Loading nearby amenities…
Taxation est. · year 1
- Rental income
- $12,438
- − Mortgage interest
- −$3,081
- − Property taxes
- −$186
- − Insurance
- −$275
- − Repairs & maintenance
- −$995
- − Management
- −$995
- − Depreciation
- −$1,600
- Taxable income
- $5,306
- Est. tax owed @ 24.0%
- −$1,273
- After-tax cash flow
- $4,630/yr
For passive investors: Depreciation is non-cash, so a rental often shows a tax loss while cash-flowing — sheltering income. Rental losses are passive: they offset passive income freely, and up to $25,000/yr can offset ordinary (W-2) income if you actively participate and your MAGI is under $100k (phasing out to $0 by $150k); unused losses carry forward. On sale, claimed depreciation is recaptured at up to 25%, and gains may owe capital-gains tax (a 1031 exchange can defer both). Figures are a year-1 estimate at your 24.0% rate — not tax advice; consult a CPA.
Schools (NCES district)
- District
- Tishomingo County Sp Mun School District
- NCES district ID
- 2804260
- Math proficiency
- 37% ▼ -19.00%
- Reading proficiency
- 39% ▼ -13.00%
- Median HH income
- $33,342
- Composite
- 31.24/100
- National rank
- #6032
- State rank
- #49 of 130 in MS
Livability — Iuka
- Score
- 63/100
- State rank
- #150
- US rank
- #15205
Category grades
Schools grade is shown separately in the Schools card above.
Census & demographics
- Population (ZIP)
- 8,719
Population outlook (Tishomingo County) Hauer SSP2
- Today (2025)
- 19,535 people
- By 2030
- 19,442 · -0.5%
- By 2040
- 19,099 · -2.2%
- By 2050
- 18,422 · -5.7%
- By 2075
- 16,784 · -14.1%
- By 2100
- 13,791 · -29.4%
Race, ethnicity, and origin ACS 2023
- Neighborhood character
- Predominantly White (94%)
- Race & ethnicity
- White 94% Two or more races 2% Hispanic / Latino 1% Black 1% Native American 1%
- Common ancestry
- Iranian 2% Slovak 2% Serbian 1%
- Foreign-born
- 0%
- Languages at home
- 99% English-only · Spanish 1%
Political lean MEDSL · Tishomingo
- 2024 margin
- Solid R (+78.9) · D 10.2% · R 89.1%
- 2008→2024 swing
- -28.0pp toward R · 2008: -50.9pp · 2024: -78.9pp
- All cycles
- 2024: R+78.9 2020: R+75.2 2016: R+73.7 2012: R+56.6 2008: R+50.9
Not yet ingested
- Civics
- —
Market trends
- HPI YoY
- ▼ -42.86%
- Current HPI
- 189.0227
- Rent YoY
- —
- Metro
- —
- State GDP YoY
- —
- F500 in state
- 0
Price history
1 event — show timeline
- 2026-06-11 Listed $55,000 NEMSBD
Property tax history
-15.2%/yrLatest (2025): $186 · -28.1% YoY. Source: county tax records.
Cash-flow waterfall
monthlySold comps — $/sqft
last 12 mo · ≤1 miLoading sold comps…