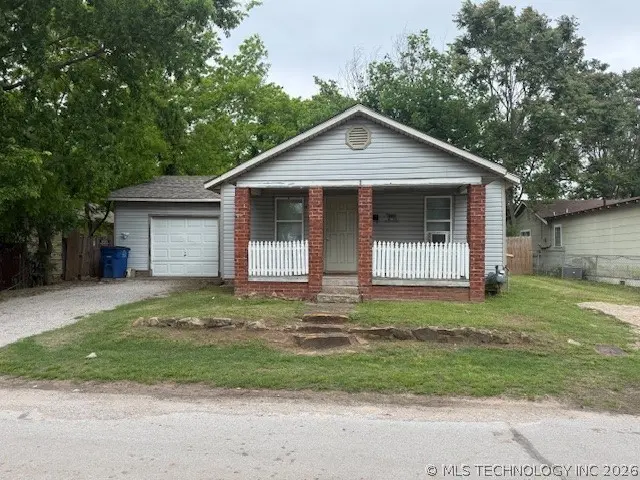
825 S 64th WestAvenue · Tulsa, OK
Flood risk 3/10 · Minor
- FEMA flood zone
- X (shaded)
- Chance of flooding over 30 yrs
- 0.2%
- Est. flood insurance / yr
- $507 – $1,088
Fire risk 5/10 · Moderate
- Est. fire insurance / yr
- $2,463 – $4,575
Heat risk 6/10 · Moderate
- Hot days now (above 110°F)
- 7 days/yr
- Hot days in 30 yrs
- 18 days/yr
Wind risk 3/10 · Minor
- Chance of severe wind over 30 yrs
- 5.0%
Air-quality risk 2/10 · Minimal
- Unhealthy air days now
- 2 days/yr
- Unhealthy air days in 30 yrs
- 2 days/yr
Risk factors via First Street. Map © Google.
Why this score? — see what drove the B grade
The composite is a weighted blend of 9 inputs, each scored 0–100. Each bar is that input's sub-score; the figure is the points it added to the 100-point composite (weight × sub-score).
- Cash flow +30.0/30.0
- ARV discount +14.6/15.0
- DSCR +10.0/10.0
- 1% rule +8.1/10.0
- Livability +3.8/5.0
- Rent growth +3.1/5.0
- Condition / age +2.5/5.0
- Schools +0.8/10.0
- Appreciation +0.0/10.0
$82,500
🖨 Deal sheet 📄 Offer letter ✓ Due diligence
Listing remarks
Calling all Investors. .. . add this to your rental income! Cute little bungalow with a covered porch. Large fully fenced backyard. New roof in j2025! Walk in to good size den with newer carpet (real hardwoods underneath) open to formal dining with real wood floors. Master has carpet (real hardwoods underneath) 1/2 bath and decent size closet. Second bedroom with carpet (real hardwoods underneath) Hall bath has been updated with newer toilet, vanity, vinyl flooring. Washer and dryer hookup in the bathroom. Nice kitchen with newer tile back splash, formica counters, electric stove and wood cabinets. Eat in area with carpet or could be office. Garage is attached. Great backyard with mature t
Key facts
- Covered porch
- Good size den
- Updated hall bath
Tags
Property features AI
Exterior
- Parking: Attached garage (1-car)
- Security: No safety shelter
- Utilities: Electricity available; Natural gas available; Public water; Public sewer
- Home design: One-story home; Faces west; Crawlspace foundation
- Construction: Masonite and wood siding with wood frame construction; Asphalt/fiberglass roof
- Exterior features: Covered porch; Patio/porch; Chain link, full privacy fencing; Mature trees
Interior
- Kitchen: Kitchen with breakfast nook / eat-in area
- Bedrooms: Master bedroom with private bath and separate closets (first floor); Additional bedroom (first floor)
- Flooring: Carpet; Wood
- Bathrooms: One full bathroom with bathtub (first floor); One half bathroom and a master bath with separate shower (first floor)
- Heating & cooling: Central heating (gas); Window cooling units
- Interior features: Ceiling fan(s); Laminate countertops; Wood window frames; Electric oven connection; None (no additional interior features listed)
- Laundry & utility: Utility room (inside, first floor); Washer hookup, electric dryer hookup, gas dryer hookup
Neighborhood map
What this means for you Summary
Snapshot
- This is a 2-bed/1.0-bath single-family listed at $82k.
Deal economics
- At list price, monthly cash flow is $317 ($4k/yr) — positive.
- The deal already cash-flows at list — no discount required.
- Meets the 1% rule at list price ($1k rent vs $82k).
- Recommended offer: $80k (3.0% below list) — sets the bar for market timing.
- Cap rate 10.9% vs local median 3.9% in Tulsa — top-decile yield for the area; either an underpriced asset or a hidden risk that comps aren't pricing in. Stress-test before assuming the spread holds.
Location & tenants
- Location reads 75/100 on livability (#13 in OK, #4,058 nationally) — a middle-class / working-renter tenant base. Strengths: amenities A+, commute A+, cost of living A+; Watch: schools F, crime F, employment D-.
- Tulsa (urban): math 7% / reading 12% proficiency, ranked #250 of 270 in OK (top 93%) — low school quality limits family demand, transient renter base, plan for 1-2y turnover; 76% free/reduced lunch — lower-income household profile, screen leases tightly.
- Market conditions: Rents rising (+2.5%/yr); 113 active listings in the ZIP; 2 comparable units currently listed for rent nearby; 2,818 units permitted in Tulsa County in 2024 (518 in 5+ unit buildings).
Forward outlook
- Local home prices are declining (-3.0%/yr); year-one equity from $570 of loan paydown is wiped out by about $2k of value loss. Plan a longer hold.
- Tulsa County population projected at +30% by 2050 — long-run rental-demand tailwind backs the buy-and-hold thesis.
- At projected returns (-3.0% appreciation + 2.5% rent growth), your $23k cash investment doubles in ~8 years — after that, you're playing with house money.
Negotiation context
- It's been on market 56 days — a 3% lower offer ($80k) is reasonable based on typical stale-listing flexibility.
- 5 sale attempts since 22y ago; this cycle's ask has dropped $5k (6%) from the opening price — seller is motivated, your offer sets the floor, not the list.
- Current owner paid $38k; list at $82k implies a 120% gain — meaningful room to come down on a strong offer.
Risks & watch-outs
- Watch-outs: built in 1920 — expect roof / HVAC / electrical / plumbing capex.
- Climate carrying-cost: moderate wildfire risk; extreme-heat days projected 7→18/yr by 2055 (HVAC capex compounding) — expect insurance premiums to compound above CPI over the hold.
Questions for the listing agent
- It's been on market 56 days. Have you received any prior offers? Is the seller open to a 3% concession, seller financing, or rate buy-down credit?
- Built in 1920 — when were the roof, HVAC, electrical panel, plumbing, and water heater last replaced?
- Is there a deadline driving the sale (1031 exchange, divorce, estate, relocation)? That informs how much negotiation room exists.
- Schools are F-rated, which usually means shorter tenancies and higher turnover. Who's the typical renter profile here, and what's been the actual vacancy rate?
- Crime grade is F in this area — have there been break-ins, vandalism, or insurance claims at this property in the last 3 years? What carrier currently insures it and at what premium?
- What's the average days-on-market for RENTAL listings here right now (not sales)? A rising rental-DOM trend means longer vacancies and softer asking-rent achievability than the comps imply.
- What's the recent tenant-quality profile in this submarket — average credit score on applications, eviction rate, late-payment / NSF rate, and stable-employment percentage? A property-management company in the area should have these aggregated.
- How much new for-sale + rental construction is in the pipeline within 1–3 miles? Heavy new supply typically softens prices + rents 12–24 months out; constrained supply supports both.
Investment metrics
- 1% rule
- 1.31% ✓
- Cap rate
- 10.91%
- Cash-on-cash
- 16.49%
- DSCR
- 1.73
- GRM
- 6.4
CMA / ARV
- ARV (on-the-fly)
- $97,920
- Comps found
- 4
Show comp detail 4 sales within ~0.75 mi
| Address | Dist | Beds/Ba | Sqft | Sold | Price | $/sf | Match |
|---|---|---|---|---|---|---|---|
| 6039 W 9th St | 0.24mi | 2/1.5 | 1,116 (-3%) | 13mo | $95,000 | $85 | 70 |
| 916 S 63rd West Ave | 0.06mi | 3/1.0 (+1) | 1,004 (-13%) | 10mo | $45,000 | $45 | 63 |
| 5677 W 3rd St | 0.68mi | 2/1.0 | 1,072 (-7%) | 8mo | $95,500 | $89 | 50 |
| 5134 Charles Page Blvd E | 0.75mi | 3/1.0 (+1) | 1,008 (-12%) | 17mo | $40,000 | $40 | 26 |
Match score weights: distance 35% · size 25% · config 20% · recency 20%. Top-matched comps best support the ARV.
Projected returns pro-forma
-3.0% appreciation · 2.45% rent growth · sell at horizon
- IRR
- 7.0%
- Equity multiple
- 1.27×
- Total profit
- $6,248
- Equity at exit
- $12,301
- IRR
- 15.8%
- Equity multiple
- 2.26×
- Total profit
- $29,040
- Equity at exit
- $7,133
Cash invested: $23,100 (down + closing). Projections, not guarantees.
Landlord ↔ Tenant lean methodology
- Overall (STATE)
- 83 Strongly Landlord-Friendly
- State Oklahoma
- 83 Strongly Landlord-Friendly · R+20
- County
- — inherits STATE
- City
- — inherits STATE
ZIP-level market 74127
- Home prices YoY
- -20.4%
- Rents YoY
- 2.5%
- Active inventory
- 113
- Price-to-rent
- 6.4×
Monthly cashflow live
- Estimated rent
- $1,082 medium interval (Pro) →
- Mortgage (P&I)
- −$433
- Tax from tax record
- −$70 /mo · $843/yr
- Insurance
- −$34
- HOA
- −$0
- Vacancy / Maint / Mgmt
- −$227
- Net cashflow
- $317
Break-even live
UW: 25.0% down · 7.5% · 30yr · 1.5% tax · 5.0% vac · 8.0% maint · 8.0% mgmt
Financing live
Cash to close
- Down payment
- $20,625
- Closing costs
- $2,475
- Reserves months
- —
- Total cash needed
- —
Loan-product check · same deal, 3 products live
Conventional
25% down · 7.5% · 30yr
- Down + closing
- —
- Monthly P&I
- —
- Monthly cashflow
- —
- DSCR
- —
- Eligible?
- —
Personal DTI + credit; lowest rate.
DSCR
20% down · 8.5% · 30yr
- Down + closing
- —
- Monthly P&I
- —
- Monthly cashflow
- —
- DSCR
- —
- Eligible?
- —
No personal income docs; deal must DSCR.
Hard money
10% down · 12.0% · 12mo
- Down + closing
- —
- Monthly P&I
- —
- Monthly cashflow
- —
- DSCR
- —
- Eligible?
- —
Short-term bridge; refi at stabilization.
Rent comps 2 comps
| Address | Beds | Baths | Sqft | Rent | $/sqft | DOM | Units | Dist |
|---|---|---|---|---|---|---|---|---|
| 5913 W 8th St Tulsa, OK | 2.0 | 1.0 | 820 | $1,050 | $1.28 | 21d | 1 | 0.28mi |
| 8001 W Parkway Blvd Tulsa, OK | 1.0–2.0 | 1.0–2.0 | 856 | $1,155 | $1.35 | 1d | 5 | 0.95mi |
Listing history 26 events
-
2026-06-18days on market $82,500 Active 56 DOM
-
2026-06-17days on market $82,500 Active 55 DOM
-
2026-06-16days on market $82,500 Active 54 DOM
-
2026-06-15days on market $82,500 Active 53 DOM
-
2026-06-13days on market $82,500 Active 51 DOM
-
2026-06-10days on market $82,500 Active 48 DOM
-
2026-06-09days on market $82,500 Active 47 DOM
-
2026-06-08days on market $82,500 Active 46 DOM
-
2026-06-07days on market $82,500 Active 45 DOM
-
2026-06-05days on market $82,500 Active 42 DOM
-
2026-06-03days on market $82,500 Active 41 DOM
-
2026-06-02days on market $82,500 Active 40 DOM
-
2026-06-02price $82,500 Active 39 DOM
-
2026-06-01days on market $87,700 Active 39 DOM
-
2026-05-31days on market $87,700 Active 38 DOM
-
2026-04-23$87,700 Active
-
2007-08-22historical
-
2007-02-21$49,900
-
2007-02-19historical
-
2006-08-18$54,000
-
2006-08-14historical
-
2006-07-25$54,000
-
2004-10-19soldstatus $37,500
-
2004-10-01soldstatus $37,500
-
2004-08-26historical
-
2004-07-01$38,000
ⓘ Source: listings_history table (triggers on properties + properties_extension) + one-shot
backfill from property_details.listing_events for pre-trigger history.
Tax reassessment forecast OK · Resets to sale price
- Current annual tax
- $843 · $70/mo
- Projected year-2 tax
- $843 · $70/mo
- Expected delta
- $0/yr ($0/mo · 0.0%)
ⓘ Screening estimate from a state-policy table — verify with the county assessor before closing.
Climate risk First Street
- Flood 3/10 Moderate FEMA zone X (shaded) · 20% chance over 30 yrs
- Wildfire 5/10 Major
- Heat 6/10 Major 7 d/yr ≥110°F today · 18 d/yr by 30 yrs out
- Wind 3/10 Moderate 5% chance of damaging wind over 30 yrs
- Air quality 2/10 Low 2 unhealthy d/yr today · 2 by 30 yrs out
Nearby sold comps map
Loading sold comps map…
Walkable amenities ~0.75 mi
Loading nearby amenities…
Taxation est. · year 1
- Rental income
- $12,982
- − Mortgage interest
- −$4,621
- − Property taxes
- −$843
- − Insurance
- −$412
- − Repairs & maintenance
- −$1,039
- − Management
- −$1,039
- − Depreciation
- −$2,400
- Taxable income
- $2,628
- Est. tax owed @ 24.0%
- −$631
- After-tax cash flow
- $3,178/yr
For passive investors: Depreciation is non-cash, so a rental often shows a tax loss while cash-flowing — sheltering income. Rental losses are passive: they offset passive income freely, and up to $25,000/yr can offset ordinary (W-2) income if you actively participate and your MAGI is under $100k (phasing out to $0 by $150k); unused losses carry forward. On sale, claimed depreciation is recaptured at up to 25%, and gains may owe capital-gains tax (a 1031 exchange can defer both). Figures are a year-1 estimate at your 24.0% rate — not tax advice; consult a CPA.
Schools (NCES district)
- District
- Tulsa
- NCES district ID
- 4030240
- Math proficiency
- 7% ▼ -9.00%
- Reading proficiency
- 12% ▼ -7.00%
- Median HH income
- $37,895
- Composite
- 8.04/100
- National rank
- #9919
- State rank
- #250 of 270 in OK
Livability — Tulsa
- Score
- 75/100
- State rank
- #13
- US rank
- #4058
Category grades
Schools grade is shown separately in the Schools card above.
Census & demographics
- Census place
- Tulsa, OK
- County
- Osage County · 26,244 people
- City population
- 389,418
- Metro
- Tulsa, OK
- Population (ZIP)
- 16,324
- Household income
- $46,373
- Rent vs Own
- Severe rent burden
- 782.0
Population outlook (Tulsa County) Hauer SSP2
- Today (2025)
- 723,846 people
- By 2030
- 766,033 · +5.8%
- By 2040
- 851,386 · +17.6%
- By 2050
- 938,389 · +29.6%
- By 2075
- 1,166,011 · +61.1%
- By 2100
- 1,350,277 · +86.5%
Race, ethnicity, and origin ACS 2023
- Neighborhood character
- Diverse neighborhood (Simpson 0.66)
- Race & ethnicity
- White 50% Black 28% Two or more races 10% Hispanic / Latino 7% Native American 7%
- Hispanic origin (detail)
- Mexican 5%
- Common ancestry
- Slovak 2% Italian 1% Iranian 1%
- Foreign-born
- 4% · Canada, Jamaica
- Languages at home
- 94% English-only · Spanish 4%
Political lean MEDSL · Tulsa
- 2024 margin
- R (+15.2) · D 41.3% · R 56.5% · Other 2.2%
- 2008→2024 swing
- +9.2pp toward D · 2008: -24.5pp · 2024: -15.2pp
- All cycles
- 2024: R+15.2 2020: R+15.6 2016: R+22.9 2012: R+27.4 2008: R+24.5
Not yet ingested
- Civics
- —
Market trends
- HPI YoY
- ▼ -59.31%
- Current HPI
- 231.5994
- Rent YoY
- ▲ 2.45%
- Metro
- Tulsa, OK
- State GDP YoY
- ▲ 1.55%
- F500 in state
- 6
Industry mix (Fortune 500 HQ in OK)
| Industry | F500 HQs | Revenue |
|---|---|---|
| Energy | 3 | $48B |
|
||
Price history
+130.8% since first listed11 events — show timeline
- 2026-04-23 Listed $87,700 MLS Technology, Inc.
- 2007-08-22 Listing Removed — MLS Technology, Inc.
- 2007-02-21 Listed $49,900 MLS Technology, Inc.
- 2007-02-19 Listing Removed — MLS Technology, Inc.
- 2006-08-18 Listed $54,000 MLS Technology, Inc.
- 2006-08-14 Listing Removed — MLS Technology, Inc.
- 2006-07-25 Listed $54,000 MLS Technology, Inc.
- 2004-10-19 Sold (Public Records) $37,500 Public Records
- 2004-10-01 Sold (MLS) $37,500 MLS Technology, Inc.
- 2004-08-26 Listing Removed — MLS Technology, Inc.
- 2004-07-01 Listed $38,000 MLS Technology, Inc.
Property tax history
+2.5%/yrLatest (2025): $843 · +8.6% YoY. Source: county tax records.
Cash-flow waterfall
monthlySold comps — $/sqft
last 12 mo · ≤1 miLoading sold comps…