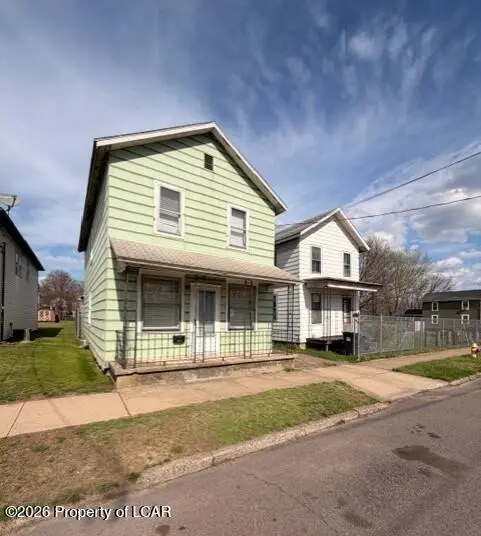
385 Vaughn St · Luzerne, PA
Flood risk 7/10 · Major
- FEMA flood zone
- X
- Chance of flooding over 30 yrs
- 0.95%
- Est. flood insurance / yr
- $507 – $1,088
Fire risk 3/10 · Minor
- Est. fire insurance / yr
- $511 – $949
Heat risk 4/10 · Minor
- Hot days now (above 97°F)
- 7 days/yr
- Hot days in 30 yrs
- 16 days/yr
Wind risk 3/10 · Minor
- Chance of severe wind over 30 yrs
- 4.0%
Air-quality risk 3/10 · Minor
- Unhealthy air days now
- 2 days/yr
- Unhealthy air days in 30 yrs
- 4 days/yr
Risk factors via First Street. Map © Google.
Why this score? — see what drove the B grade
The composite is a weighted blend of 9 inputs, each scored 0–100. Each bar is that input's sub-score; the figure is the points it added to the 100-point composite (weight × sub-score).
- Cash flow +23.9/30.0
- ARV discount +15.0/15.0
- Appreciation +10.0/10.0
- DSCR +7.7/10.0
- 1% rule +6.0/10.0
- Livability +3.8/5.0
- Rent growth +2.5/5.0
- Schools +2.5/10.0
- Condition / age +2.5/5.0
$128,500
🖨 Deal sheet (PDF) 📄 Offer letter ✓ Due diligence
Listing remarks
Estate Sale! Two Homes on one Property. Zoned R-2. No utility connections to white house. Property Sold ''AS IS''
Key facts
- Zoned r-2
- 9,148 sq ft lot
- Listed 23 days
Tags
Property features AI
Exterior
- Utilities: Public water; Public sewer
- Home design: Single-family residential; Two levels
- Construction: Above-grade finished area approximately 1,368; Residential zoning
- Exterior features: Cleared, level lot
Interior
- Kitchen: Eat-in kitchen; Gas water heater
- Bedrooms: Total of 7 rooms (bedroom count not specified)
- Bathrooms: 1 full bathroom
- Heating & cooling: Natural gas heating; Hot water / radiant heating
- Interior features: Eat-in kitchen; Full unfinished basement
- Laundry & utility: Gas water heater
Neighborhood map
What this means for you Summary
Snapshot
- This is a 3-bed/1.0-bath single-family listed at $128k.
Deal economics
- At list price, monthly cash flow is $183 ($2k/yr) — positive.
- The deal already cash-flows at list — no discount required.
- Meets the 1% rule at list price ($1k rent vs $128k).
- Recommended offer: $127k (1.5% below list) — sets the bar for market timing.
- Cap rate 8.6% vs local median 6.1% in Luzerne — top-decile yield for the area; either an underpriced asset or a hidden risk that comps aren't pricing in. Stress-test before assuming the spread holds.
Location & tenants
- Location reads 76/100 on livability (#391 in PA, #3,538 nationally) — a middle-class / working-renter tenant base. Strengths: crime A+, cost of living A+, housing A+; Watch: amenities C-, schools D+, commute F.
- Wyoming Valley West SD (suburban): math 18% / reading 42% proficiency, ranked #445 of 539 in PA (top 83%) — families likely to look elsewhere, expect single-tenant / working-renter base with shorter leases.
- Market conditions: 17 active listings in the ZIP; 30 comparable units currently listed for rent nearby; rentals at typical pace (median 22d on market — plan ~3-4 weeks tenant-placement turnaround); 43% of comp listings sitting > 30 days — soft ceiling on asking rent; 349 units permitted in Luzerne County in 2024 (16 in 5+ unit buildings).
Forward outlook
- In year one you build about $14k of equity ($888 loan paydown + $13k appreciation (10.0% local appreciation)).
- Luzerne County population projected at +4% by 2050 — modest demand growth; plan on rents tracking national, not racing it.
- At projected returns (10.0% appreciation + 3.0% rent growth), your $36k cash investment doubles in ~3 years — after that, you're playing with house money.
- By year 3, paydown + projected appreciation supports a ~$35k cash-out refi (75% LTV) — recoverable capital for the next deal without selling this one.
Negotiation context
- It's been on market 23 days — a 2% lower offer ($127k) is reasonable based on typical stale-listing flexibility.
- 2 sale attempts; this cycle's ask has dropped $36k (22%) from the opening price — seller is motivated, your offer sets the floor, not the list.
Risks & watch-outs
- Watch-outs: flood insurance adds $66/mo; built in 1900 — expect roof / HVAC / electrical / plumbing capex.
- Climate carrying-cost: major flood risk — expect insurance premiums to compound above CPI over the hold.
Questions for the listing agent
- Built in 1900 — when were the roof, HVAC, electrical panel, plumbing, and water heater last replaced?
- What's the actual annual flood-insurance premium (NFIP or private), and is the property in a SFHA with mandatory coverage?
- Is there a deadline driving the sale (1031 exchange, divorce, estate, relocation)? That informs how much negotiation room exists.
- Schools are D-rated, which usually means shorter tenancies and higher turnover. Who's the typical renter profile here, and what's been the actual vacancy rate?
- What's the average days-on-market for RENTAL listings here right now (not sales)? A rising rental-DOM trend means longer vacancies and softer asking-rent achievability than the comps imply.
- What's the recent tenant-quality profile in this submarket — average credit score on applications, eviction rate, late-payment / NSF rate, and stable-employment percentage? A property-management company in the area should have these aggregated.
- How much new for-sale + rental construction is in the pipeline within 1–3 miles? Heavy new supply typically softens prices + rents 12–24 months out; constrained supply supports both.
Investment metrics
- 1% rule
- 1.10% ✓
- Cap rate
- 8.62%
- Cash-on-cash
- 8.31%
- DSCR
- 1.37
- GRM
- 7.6
CMA / ARV
- ARV (median comp)
- $163,374
- List price
- $128,500
- Delta
- -21.35%
- Verdict
- UNDERPRICED
- Comps
- 20 within 1.0 mi
Show comp detail 12 sales within ~0.75 mi
| Address | Dist | Beds/Ba | Sqft | Sold | Price | $/sf | Match |
|---|---|---|---|---|---|---|---|
| 385 Vaughn St | 0.00mi | 3/1.0 | 1,368 (0%) | 0mo | $120,000 | $88 | 100 |
| 251 Union St | 0.27mi | 3/1.0 | 1,346 (-2%) | 0mo | $140,000 | $104 | 84 |
| 258 Factory St | 0.22mi | 3/1.0 | 1,344 (-2%) | 4mo | $147,000 | $109 | 83 |
| 101 Union St | 0.48mi | 3/1.5 | 1,419 (+4%) | 1mo | $205,000 | $144 | 68 |
| 1051 Murray St | 0.54mi | 3/1.0 | 1,440 (+5%) | 0mo | $237,000 | $165 | 66 |
| 127 Division St | 0.63mi | 3/1.5 | 1,447 (+6%) | 1mo | $165,000 | $114 | 58 |
| 18 Linden St | 0.50mi | 3/1.0 | 1,219 (-11%) | 2mo | $190,000 | $156 | 57 |
| 750 Miller St | 0.59mi | 3/1.5 | 1,250 (-9%) | 1mo | $176,000 | $141 | 55 |
| 692 Schuyler Ave | 0.55mi | 3/1.5 | 1,500 (+10%) | 2mo | $240,000 | $160 | 54 |
| 100 Poplar St | 0.64mi | 2/2.0 (-1) | 1,300 (-5%) | 0mo | $120,000 | $92 | 53 |
| 155 Dorrance St | 0.43mi | 3/1.5 | 1,568 (+15%) | 3mo | $120,000 | $77 | 51 |
| 814 Charles St | 0.67mi | 4/2.0 (+1) | 1,189 (-13%) | 6mo | $130,000 | $109 | 33 |
Match score weights: distance 35% · size 25% · config 20% · recency 20%. Top-matched comps best support the ARV.
Projected returns pro-forma
10.0% appreciation · 3.0% rent growth · sell at horizon
- IRR
- 28.7%
- Equity multiple
- 3.27×
- Total profit
- $81,665
- Equity at exit
- $115,763
- IRR
- 25.0%
- Equity multiple
- 7.43×
- Total profit
- $231,446
- Equity at exit
- $249,647
Cash invested: $35,980 (down + closing). Projections, not guarantees.
Landlord ↔ Tenant lean methodology
- Overall (STATE)
- 62 Landlord-Friendly
- State Pennsylvania
- 62 Landlord-Friendly · EVEN
- County
- — inherits STATE
- City
- — inherits STATE
ZIP-level market 18709
- Home prices YoY
- 12.7%
- Active inventory
- 17
- Price-to-rent
- 7.6×
Monthly cashflow live
- Estimated rent
- $1,416 high interval (Pro) →
- Mortgage (P&I)
- −$674
- Tax from tax record
- −$142 /mo · $1,703/yr
- Insurance
- −$54
- Flood insurance flood zone
- −$66 /mo · $798/yr
- HOA
- −$0
- Vacancy / Maint / Mgmt
- −$297
- Net cashflow
- $183
Break-even live
Sensitivity live
| Price | -10% $255 | -5% $219 | +0% $183 | +5% $146 | +10% $110 |
|---|---|---|---|---|---|
| Rent | -10% $71 | -5% $127 | +0% $183 | +5% $239 | +10% $294 |
| Rate | -1.0pp $247 | -0.5pp $215 | base $183 | +0.5pp $149 | +1.0pp $115 |
UW: 25.0% down · 7.5% · 30yr · 1.5% tax · 5.0% vac · 8.0% maint · 8.0% mgmt
Financing live
Cash to close
- Down payment
- $32,125
- Closing costs
- $3,855
- Reserves months
- —
- Total cash needed
- —
Loan-product check · same deal, 3 products live
Conventional
25% down · 7.5% · 30yr
- Down + closing
- —
- Monthly P&I
- —
- Monthly cashflow
- —
- DSCR
- —
- Eligible?
- —
Personal DTI + credit; lowest rate.
DSCR
20% down · 8.5% · 30yr
- Down + closing
- —
- Monthly P&I
- —
- Monthly cashflow
- —
- DSCR
- —
- Eligible?
- —
No personal income docs; deal must DSCR.
Hard money
10% down · 12.0% · 12mo
- Down + closing
- —
- Monthly P&I
- —
- Monthly cashflow
- —
- DSCR
- —
- Eligible?
- —
Short-term bridge; refi at stabilization.
Rent comps 30 comps
| Address | Beds | Baths | Sqft | Rent | $/sqft | DOM | Units | Dist |
|---|---|---|---|---|---|---|---|---|
| 942 Wyoming Ave Unit A Forty Fort, PA | 2.0 | 1.5 | 1054 | $1,600 | $1.52 | 44d | 1 | 0.63mi |
| 1154 Murray St Kingston, PA | 2.0 | 1.5 | 1152 | $1,600 | $1.39 | 44d | 1 | 0.71mi |
| 59 Price St Unit 2 Kingston, PA | 3.0 | 1.0 | 1000 | $1,100 | $1.10 | 44d | 1 | 0.74mi |
| 9 Snowden St Forty Fort, PA | 3.0 | 1.0 | 1500 | $1,250 | $0.83 | 22d | 1 | 0.75mi |
| 47 Price St Apt 2 Kingston, PA | 2.0 | 1.0 | 1200 | $1,200 | $1.00 | 44d | 1 | 0.76mi |
| 109 Penn St Unit 1 Kingston, PA | 3.0 | 1.0 | 1200 | $1,400 | $1.17 | 14d | 1 | 0.77mi |
| 109 Penn St Kingston, PA | 3.0 | 1.0 | 1200 | $1,400 | $1.17 | 44d | 1 | 0.77mi |
| 98 E Walnut St Kingston, PA | 3.0 | 1.0 | 1280 | $1,500 | $1.17 | 22d | 1 | 0.80mi |
| 27 1/2 Penn St Kingston, PA | 3.0 | 1.0 | 1200 | $1,400 | $1.17 | 44d | 1 | 0.80mi |
| 27 Penn St Kingston, PA | 3.0 | 1.5 | 1225 | $1,550 | $1.27 | 22d | 1 | 0.84mi |
| 256 E Grove St Kingston, PA | 2.0 | 1.0 | 1000 | $1,250 | $1.25 | 14d | 1 | 0.84mi |
| 41 Pulaski St Kingston, PA | 3.0 | 1.5 | 1292 | $1,450 | $1.12 | 22d | 1 | 0.87mi |
| 151 E Walnut St Kingston, PA | 2.0 | 1.0 | 900 | $1,000 | $1.11 | 14d | 1 | 0.89mi |
| 36 Pulaski St Kingston, PA | 3.0 | 2.0 | 1432 | $1,600 | $1.12 | 14d | 1 | 0.89mi |
| 157 E Walnut St Kingston, PA | 2.0 | 1.0 | 900 | $1,000 | $1.11 | 14d | 1 | 0.90mi |
| 365 N Maple Ave Kingston, PA | 3.0 | 1.0 | 1600 | $1,400 | $0.88 | 22d | 1 | 0.94mi |
| 104 Meyers St Kingston, PA | 3.0 | 1.0 | 1200 | $1,495 | $1.25 | 44d | 1 | 0.95mi |
| 182 Roosevelt St Kingston, PA | 2.0 | 1.0 | 1152 | $1,625 | $1.41 | 14d | 1 | 0.97mi |
| 11 Holiday Dr Kingston, PA | 1.0–3.0 | 1.0–2.5 | 1083 | $2,639 | $2.44 | 14d | 14 | 1.10mi |
| 321 Shoemaker St Kingston, PA | 3.0 | 1.5 | 1598 | $1,750 | $1.10 | 22d | 1 | 1.10mi |
| 9-10 Meyers Ct Kingston, PA | 3.0 | 1.0 | 1250 | $1,500 | $1.20 | 22d | 1 | 1.19mi |
| 266 Rutter Ave Unit 2 Kingston, PA | 2.0 | 1.0 | 875 | $1,270 | $1.45 | 44d | 1 | 1.23mi |
| 570 Main St Edwardsville, PA | 2.0 | 1.0 | 1100 | $1,180 | $1.07 | 44d | 1 | 1.24mi |
| 58 Jackson St Kingston, PA | 4.0 | 2.0 | 1600 | $2,000 | $1.25 | 44d | 1 | 1.27mi |
| 238 Rutter Ave Kingston, PA | 2.0 | 1.0 | 1200 | $1,050 | $0.88 | 44d | 1 | 1.27mi |
| 41 Main St Kingston, PA | 3.0 | 1.0 | 1350 | $1,400 | $1.04 | 22d | 1 | 1.28mi |
| 79 Washington St Kingston, PA | 4.0 | 1.5 | 1800 | $1,750 | $0.97 | 14d | 1 | 1.41mi |
| 400 N Gates Ave Unit 1 Kingston, PA | 2.0 | 2.0 | 1198 | $1,300 | $1.09 | 44d | 1 | 1.43mi |
| 141 Short St Edwardsville, PA | 3.0 | 1.0 | 1040 | $1,100 | $1.06 | 44d | 1 | 1.43mi |
| 20 N Loveland Ave Kingston, PA | 3.0 | 2.0 | 1400 | $1,775 | $1.27 | 14d | 1 | 1.47mi |
Listing history 5 events
-
2026-06-01status $128,500 Pending 23 DOM
-
2026-05-31days on market $128,500 Active 23 DOM
-
2026-05-30days on market $128,500 Active 22 DOM
-
2026-05-13status Pending 89-char remark
-
2026-04-28$165,000 Active 89-char remark
ⓘ Source: listings_history table (triggers on properties + properties_extension) + one-shot
backfill from property_details.listing_events for pre-trigger history.
Tax reassessment forecast PA · Partial reset (capped growth)
- Current annual tax
- $1,703 · $142/mo
- Projected year-2 tax
- $1,867 · $156/mo
- Expected delta
- +$164/yr (+$14/mo · 9.6%)
ⓘ Screening estimate from a state-policy table — verify with the county assessor before closing.
Climate risk First Street
- Flood 7/10 Severe FEMA zone X · 95% chance over 30 yrs
- Wildfire 3/10 Moderate
- Heat 4/10 Moderate 7 d/yr ≥97°F today · 16 d/yr by 30 yrs out
- Wind 3/10 Moderate 4% chance of damaging wind over 30 yrs
- Air quality 3/10 Moderate 2 unhealthy d/yr today · 4 by 30 yrs out
Nearby sold comps map
Loading sold comps map…
Walkable amenities ~0.75 mi
Loading nearby amenities…
Taxation est. · year 1
- Rental income
- $16,988
- − Mortgage interest
- −$7,198
- − Property taxes
- −$1,703
- − Insurance
- −$1,440
- − Repairs & maintenance
- −$1,359
- − Management
- −$1,359
- − Depreciation
- −$3,738
- Taxable income
- $191
- Est. tax owed @ 24.0%
- −$46
- After-tax cash flow
- $2,145/yr
For passive investors: Depreciation is non-cash, so a rental often shows a tax loss while cash-flowing — sheltering income. Rental losses are passive: they offset passive income freely, and up to $25,000/yr can offset ordinary (W-2) income if you actively participate and your MAGI is under $100k (phasing out to $0 by $150k); unused losses carry forward. On sale, claimed depreciation is recaptured at up to 25%, and gains may owe capital-gains tax (a 1031 exchange can defer both). Figures are a year-1 estimate at your 24.0% rate — not tax advice; consult a CPA.
Schools (NCES district)
- District
- Wyoming Valley West SD
- NCES district ID
- 4225950
- Math proficiency
- 18% ▼ -11.00%
- Reading proficiency
- 42% ▼ -12.00%
- Median HH income
- $42,437
- Composite
- 25.38/100
- National rank
- #7470
- State rank
- #445 of 539 in PA
Livability — Luzerne
- Score
- 76/100
- State rank
- #391
- US rank
- #3538
Category grades
Schools grade is shown separately in the Schools card above.
Census & demographics
- Census place
- Luzerne, PA
- City population
- 2,959
- Population (ZIP)
- 2,959
Population outlook (Luzerne County) Hauer SSP2
- Today (2025)
- 319,505 people
- By 2030
- 319,943 · +0.1%
- By 2040
- 322,643 · +1.0%
- By 2050
- 330,817 · +3.5%
- By 2075
- 379,145 · +18.7%
- By 2100
- 431,908 · +35.2%
Race, ethnicity, and origin ACS 2023
- Neighborhood character
- Predominantly White (89%)
- Race & ethnicity
- White 89% Two or more races 6% Black 4% Hispanic / Latino 1%
- Common ancestry
- Romanian 18% Scotch-Irish 8% Iranian 4%
- Foreign-born
- 1%
- Languages at home
- 99% English-only · Other Indo-European 1%
Political lean MEDSL · Luzerne
- 2024 margin
- R (+19.2) · D 40.0% · R 59.2%
- 2008→2024 swing
- -27.6pp toward R · 2008: 8.4pp · 2024: -19.2pp
- All cycles
- 2024: R+19.2 2020: R+14.4 2016: R+19.6 2012: D+4.8 2008: D+8.4
Not yet ingested
- Civics
- —
Market trends
- HPI YoY
- ▲ 28.54%
- Current HPI
- 254.1718
- Rent YoY
- —
- Metro
- —
- State GDP YoY
- ▲ 1.68%
- F500 in state
- 34
Industry mix (Fortune 500 HQ in PA)
| Industry | F500 HQs | Revenue |
|---|---|---|
| Healthcare | 2 | $309B |
|
||
| Insurance | 2 | $27B |
|
||
| Telecommunications / Media | 1 | $124B |
|
||
| Industrial Distribution | 1 | $22B |
|
||
| Financial Services | 1 | $20B |
|
||
| Chemicals / Materials | 1 | $18B |
|
||
Price history
-27.3% since first listed6 events — show timeline
- 2026-06-08 Sold (MLS) $120,000 LCAR
- 2026-05-31 Pending — LCAR
- 2026-05-24 Relisted — LCAR
- 2026-05-24 Price Changed $128,500 LCAR
- 2026-05-13 Pending — LCAR
- 2026-04-28 Listed $165,000 LCAR
Property tax history
+2.5%/yrLatest (2026): $1,703 · +0.7% YoY. Source: county tax records.
Cash-flow waterfall
monthlySold comps — $/sqft
last 12 mo · ≤1 miLoading sold comps…