 Duplex
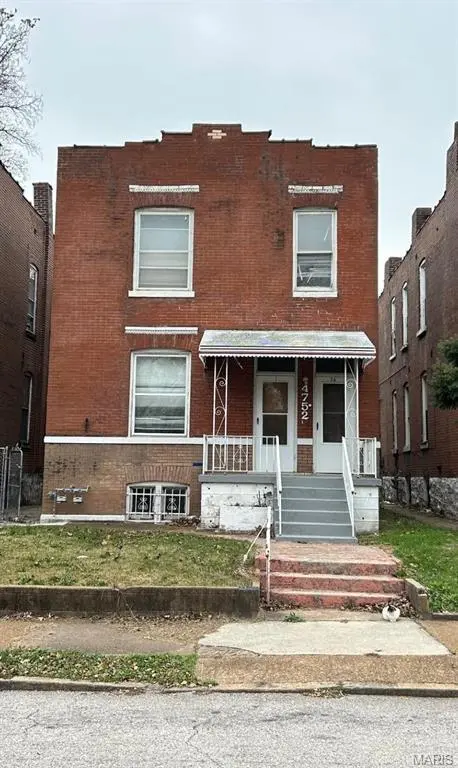
4752 Saint Louis Ave · St. Louis, MO
Flood risk 1/10 · Minimal
- FEMA flood zone
- X (unshaded)
- Chance of flooding over 30 yrs
- 0.0%
- Est. flood insurance / yr
- $473 – $860
Fire risk 1/10 · Minimal
- Est. fire insurance / yr
- $1,054 – $1,958
Heat risk 5/10 · Moderate
- Hot days now (above 107°F)
- 7 days/yr
- Hot days in 30 yrs
- 21 days/yr
Wind risk 2/10 · Minimal
- Chance of severe wind over 30 yrs
- 1.0%
Air-quality risk 4/10 · Minor
- Unhealthy air days now
- 4 days/yr
- Unhealthy air days in 30 yrs
- 5 days/yr
Risk factors via First Street. Map © Google.
Why this score? — see what drove the B- grade
The composite is a weighted blend of 9 inputs, each scored 0–100. Each bar is that input's sub-score; the figure is the points it added to the 100-point composite (weight × sub-score).
- Cash flow +30.0/30.0
- 1% rule +10.0/10.0
- DSCR +10.0/10.0
- ARV discount +5.5/15.0
- Appreciation +3.3/10.0
- Rent growth +2.5/5.0
- Livability +2.5/5.0
- Condition / age +2.5/5.0
- Schools +1.2/10.0
$62,600
🖨 Deal sheet (PDF) 📄 Offer letter ✓ Due diligence
Multi-family units
County records classify this as Multi-Family (2-4 Unit). Listing-text estimate: 2 units. confirmed
Listing remarks MLS
Investor Opportunity! Duplex has new roof and has been cleaned inside, ready for final touches to prepare for rental. Damaged by the March 2025 storm, this property was renting around $1000 per unit, so after your finishing touches, should rent for higher values. Priced to sell, this is one you can get into quickly and ready it for new occupants. Please call co-listing agent with any questions. Seller offering this AS-IS property for the investor ready for a quick turn around to get steady cash flow at a solid Cap rate. No inspections or occupancy offered and Buyers to perform all due diligence prior to closing.
Key facts
- 4,499 sq ft lot
- Built 1899
- Listed 87 days
Neighborhood map
What this means for you Summary
Snapshot
- This is a 2 × 2-bed/1.0-bath units multifamily listed at $63k.
Deal economics
- At list price, monthly cash flow is $1k ($16k/yr) — positive. Per door: $655/mo.
- The deal already cash-flows at list — no discount required.
- Meets the 1% rule at list price ($2k rent vs $63k).
- Recommended offer: $59k (6.0% below list) — sets the bar for market timing.
- Cap rate 31.4% vs local median 5.0% in St. Louis — top-decile yield for the area; either an underpriced asset or a hidden risk that comps aren't pricing in. Stress-test before assuming the spread holds.
Location & tenants
- Location reads: area grade B — affects rentability + tenant quality, not the cash-flow math above.
- St. Louis City (urban): math 10% / reading 18% proficiency, ranked #312 of 324 in MO (top 96%) — low school quality limits family demand, transient renter base, plan for 1-2y turnover; 80% free/reduced lunch — lower-income household profile, screen leases tightly.
- Market conditions: 99 active listings in the ZIP; 5 comparable units currently listed for rent nearby; rentals lingering (median 45d on market — plan ~5-8 weeks vacancy on turnover, expect pricing pressure); 80% of comp listings sitting > 30 days — soft ceiling on asking rent; lower-income renter base — watch delinquency; 294 units permitted in St. Louis city in 2024 (227 in 5+ unit buildings).
- At $2,206/mo this rent would consume 86% of the median local household income ($31k/yr) (locally 1655% of renters already pay >50% of income on rent) — very limited rent-growth headroom before tenants either downsize or default.
Forward outlook
- Local home prices are declining (-3.0%/yr); year-one equity from $433 of loan paydown is wiped out by about $2k of value loss. Plan a longer hold.
- St. Louis County population projected to shrink 6% by 2050 — rents likely to lag national; underwrite the cash flow, not the appreciation.
- At projected returns (-3.0% appreciation + 3.0% rent growth), your $18k cash investment doubles in ~2 years — after that, you're playing with house money.
Negotiation context
- It's been on market 88 days — a 6% lower offer ($59k) is reasonable based on typical stale-listing flexibility.
- 4 sale attempts since 2y ago with the ask held roughly flat each time — persistent listings suggest the price (not the market) is what's stuck; bring a comps-based counter.
Risks & watch-outs
- Watch-outs: built in 1899 — expect roof / HVAC / electrical / plumbing capex.
- Climate carrying-cost: extreme-heat days projected 7→21/yr by 2055 (HVAC capex compounding) — expect insurance premiums to compound above CPI over the hold.
Questions for the listing agent
- It's been on market 88 days. Have you received any prior offers? Is the seller open to a 6% concession, seller financing, or rate buy-down credit?
- Can we see the unit-by-unit rent roll, current vacancy, and any below-market leases? What's the average tenancy length?
- What capital expenditures (roof, boiler, parking lot, exteriors) have been made in the last 5 years, and what's planned in the next 2?
- Built in 1899 — when were the roof, HVAC, electrical panel, plumbing, and water heater last replaced?
- Why hasn't it sold? Are there any deal-killer items the seller is aware of (foundation, flood, title, zoning, code violations)?
- Is there a deadline driving the sale (1031 exchange, divorce, estate, relocation)? That informs how much negotiation room exists.
- What's the average days-on-market for RENTAL listings here right now (not sales)? A rising rental-DOM trend means longer vacancies and softer asking-rent achievability than the comps imply.
- What's the recent tenant-quality profile in this submarket — average credit score on applications, eviction rate, late-payment / NSF rate, and stable-employment percentage? A property-management company in the area should have these aggregated.
- How much new apartment / multifamily construction is in the pipeline within 1–3 miles? Heavy new supply (>2% of stock underway) typically softens rents 12–24 months out; light construction supports rent growth.
Investment metrics
- 1% rule
- 3.52% ✓
- Cap rate
- 31.41%
- Cash-on-cash
- 89.69%
- DSCR
- 4.99
- GRM
- 2.4
CMA / ARV
- ARV (median comp)
- $59,908
- List price
- $62,600
- Delta
- 4.49%
- Verdict
- FAIR
- Comps
- 20 within 1.0 mi
Show comp detail 10 sales within ~0.75 mi
| Address | Dist | Beds/Ba | Sqft | Sold | Price | $/sf | Match |
|---|---|---|---|---|---|---|---|
| 3068 Marcus Ave | 0.25mi | 4/2.0 | 2,028 (-7%) | 4mo | $28,000 | $14 | 73 |
| 5120 Lexington Ave | 0.62mi | 4/2.0 | 2,250 (+3%) | 2mo | $115,000 | $51 | 64 |
| 4738 Greer Ave | 0.15mi | 4/2.0 | 2,400 (+10%) | 17mo | $119,900 | $50 | 62 |
| 4939 Saint Louis Ave | 0.29mi | 4/2.0 | 2,350 (+8%) | 14mo | $15,000 | $6 | 62 |
| 4810 Saint Louis Ave Ave | 0.07mi | 4/4.0 | 2,444 (+12%) | 8mo | $60,000 | $25 | 61 |
| 4859 Leduc St | 0.40mi | 4/2.0 | 2,046 (-6%) | 21mo | $40,000 | $20 | 54 |
| 5144 Palm St | 0.69mi | 4/2.0 | 2,280 (+5%) | 8mo | $39,900 | $18 | 53 |
| 5144 Wabada Ave | 0.66mi | 4/2.0 | 2,304 (+6%) | 9mo | $93,500 | $41 | 52 |
| 5052 Northland Ave | 0.50mi | 4/2.0 | 2,444 (+12%) | 12mo | $18,000 | $7 | 46 |
| 3917 Cora Ave | 0.67mi | 4/2.0 | 1,926 (-12%) | 24mo | $89,900 | $47 | 30 |
Match score weights: distance 35% · size 25% · config 20% · recency 20%. Top-matched comps best support the ARV.
Projected returns pro-forma
-3.0% appreciation · 3.0% rent growth · sell at horizon
- IRR
- 90.4%
- Equity multiple
- 5.18×
- Total profit
- $73,332
- Equity at exit
- $9,334
- IRR
- 93.3%
- Equity multiple
- 10.78×
- Total profit
- $171,437
- Equity at exit
- $5,413
Cash invested: $17,528 (down + closing). Projections, not guarantees.
Landlord ↔ Tenant lean methodology
- Overall (STATE)
- 81 Strongly Landlord-Friendly
- State Missouri
- 81 Strongly Landlord-Friendly · R+10
- County
- — inherits STATE
- City
- — inherits STATE
ZIP-level market 63115
- Home prices YoY
- -2.6%
- Active inventory
- 99
- Price-to-rent
- 4.7×
Monthly cashflow live
- Estimated rent
- $2,206 high interval (Pro) →
- Mortgage (P&I)
- −$328
- Tax est. 1.5%
- −$78 /mo · $939/yr
- Insurance
- −$26
- HOA
- −$0
- Vacancy / Maint / Mgmt
- −$463
- Net cashflow
- $1,310
Break-even live
Sensitivity live
| Price | -10% $1,353 | -5% $1,332 | +0% $1,310 | +5% $1,288 | +10% $1,267 |
|---|---|---|---|---|---|
| Rent | -10% $1,136 | -5% $1,223 | +0% $1,310 | +5% $1,397 | +10% $1,484 |
| Rate | -1.0pp $1,342 | -0.5pp $1,326 | base $1,310 | +0.5pp $1,294 | +1.0pp $1,277 |
2-unit breakdown (identical units grouped — click to expand)
| Units | Beds | Baths | Est. rent |
|---|---|---|---|
| 2× units | 2 | 1 | $2,206 |
| #1 | 2 | 1 | $1,103 |
| #2 | 2 | 1 | $1,103 |
| Total (2 units) | $2,206 | ||
UW: 25.0% down · 7.5% · 30yr · 1.5% tax · 5.0% vac · 8.0% maint · 8.0% mgmt
Financing live
Cash to close
- Down payment
- $15,650
- Closing costs
- $1,878
- Reserves months
- —
- Total cash needed
- —
Loan-product check · same deal, 3 products live
Conventional
25% down · 7.5% · 30yr
- Down + closing
- —
- Monthly P&I
- —
- Monthly cashflow
- —
- DSCR
- —
- Eligible?
- —
Personal DTI + credit; lowest rate.
DSCR
20% down · 8.5% · 30yr
- Down + closing
- —
- Monthly P&I
- —
- Monthly cashflow
- —
- DSCR
- —
- Eligible?
- —
No personal income docs; deal must DSCR.
Hard money
10% down · 12.0% · 12mo
- Down + closing
- —
- Monthly P&I
- —
- Monthly cashflow
- —
- DSCR
- —
- Eligible?
- —
Short-term bridge; refi at stabilization.
Rent comps 5 comps
| Address | Beds | Baths | Sqft | Rent | $/sqft | DOM | Units | Dist |
|---|---|---|---|---|---|---|---|---|
| 5223 Ashland Ave Unit 2 St. Louis, MO | 3.0 | 1.0 | 2200 | $1,450 | $0.66 | 44d | 1 | 0.74mi |
| 4247 Maffitt Ave St. Louis, MO | 3.0 | 1.5 | 1700 | $1,000 | $0.59 | 5d | 1 | 0.92mi |
| 5096 Minerva Ave Unit C St. Louis, MO | 3.0 | 1.0 | 1800 | $1,395 | $0.78 | 44d | 1 | 0.98mi |
| 5345 Wells Ave Saint Louis, MO | 3.0 | 1.0 | 2254 | $1,295 | $0.57 | 44d | 1 | 1.10mi |
| 4400 Delmar Blvd St. Louis, MO | 3.0 | 1.0 | 1450 | $1,600 | $1.10 | 44d | 1 | 1.33mi |
Listing history 29 events
-
2026-06-21days on market $62,600 Active 88 DOM
-
2026-06-18days on market $62,600 Active 85 DOM
-
2026-06-17days on market $62,600 Active 84 DOM
-
2026-06-16pricedays on market $62,600 Active 83 DOM
-
2026-06-15days on market $64,100 Active 82 DOM
-
2026-06-13days on market $64,100 Active 80 DOM
-
2026-06-09days on market $64,100 Active 76 DOM
-
2026-06-08days on market $64,100 Active 75 DOM
-
2026-06-08days on market $64,100 Active 74 DOM
-
2026-06-05days on market $64,100 Active 71 DOM
-
2026-06-03days on market $64,100 Active 70 DOM
-
2026-06-02days on market $64,100 Active 69 DOM
-
2026-06-01days on market $64,100 Active 68 DOM
-
2026-05-31days on market $64,100 Active 67 DOM
-
2026-04-23price $64,100 625-char remark
Show marketing remark (625 chars)
Investor Opportunity! Duplex has new roof and has been cleaned inside, ready for final touches to prepare for rental. Damaged by the March 2025 storm, this property was renting around $1000 per unit, so after your finishing touches, should rent for higher values. Priced to sell, this is one you can get into quickly and ready it for new occupants. Please call co-listing agent with any questions. Seller offering this AS-IS property for the investor ready for a quick turn around to get steady cash flow at a solid Cap rate. No inspections or occupancy offered and Buyers to perform all due diligence prior to closing.
-
2026-03-25$65,000 Active 625-char remark
Show marketing remark (625 chars)
Investor Opportunity! Duplex has new roof and has been cleaned inside, ready for final touches to prepare for rental. Damaged by the March 2025 storm, this property was renting around $1000 per unit, so after your finishing touches, should rent for higher values. Priced to sell, this is one you can get into quickly and ready it for new occupants. Please call co-listing agent with any questions. Seller offering this AS-IS property for the investor ready for a quick turn around to get steady cash flow at a solid Cap rate. No inspections or occupancy offered and Buyers to perform all due diligence prior to closing.
-
2026-03-25historical $65,000 625-char remark
Show marketing remark (625 chars)
Investor Opportunity! Duplex has new roof and has been cleaned inside, ready for final touches to prepare for rental. Damaged by the March 2025 storm, this property was renting around $1000 per unit, so after your finishing touches, should rent for higher values. Priced to sell, this is one you can get into quickly and ready it for new occupants. Please call co-listing agent with any questions. Seller offering this AS-IS property for the investor ready for a quick turn around to get steady cash flow at a solid Cap rate. No inspections or occupancy offered and Buyers to perform all due diligence prior to closing.
-
2025-05-22price $109,900
-
2025-05-01historical
-
2025-05-01$122,900 Active
-
2025-04-09price $122,900
-
2025-03-27status Active
-
2025-03-27price $124,900
-
2025-01-30status Pending
-
2024-12-10$130,000 Active
-
2024-12-05historical
-
2022-05-02soldstatus $100,000
-
2022-04-29soldstatus $75,000
-
1995-04-05soldstatus
ⓘ Source: listings_history table (triggers on properties + properties_extension) + one-shot
backfill from property_details.listing_events for pre-trigger history.
Climate risk First Street
- Flood 1/10 Low FEMA zone X (unshaded) · 0% chance over 30 yrs
- Wildfire 1/10 Low
- Heat 5/10 Major 7 d/yr ≥107°F today · 21 d/yr by 30 yrs out
- Wind 2/10 Low 100% chance of damaging wind over 30 yrs
- Air quality 4/10 Moderate 4 unhealthy d/yr today · 5 by 30 yrs out
Nearby sold comps map
Loading sold comps map…
Walkable amenities ~0.75 mi
Loading nearby amenities…
Taxation est. · year 1
- Rental income
- $26,472
- − Mortgage interest
- −$3,507
- − Property taxes
- −$939
- − Insurance
- −$313
- − Repairs & maintenance
- −$2,118
- − Management
- −$2,118
- − Depreciation
- −$1,821
- Taxable income
- $15,657
- Est. tax owed @ 24.0%
- −$3,758
- After-tax cash flow
- $11,964/yr
For passive investors: Depreciation is non-cash, so a rental often shows a tax loss while cash-flowing — sheltering income. Rental losses are passive: they offset passive income freely, and up to $25,000/yr can offset ordinary (W-2) income if you actively participate and your MAGI is under $100k (phasing out to $0 by $150k); unused losses carry forward. On sale, claimed depreciation is recaptured at up to 25%, and gains may owe capital-gains tax (a 1031 exchange can defer both). Figures are a year-1 estimate at your 24.0% rate — not tax advice; consult a CPA.
Schools (NCES district)
- District
- St. Louis City
- NCES district ID
- 2929280
- Math proficiency
- 10% ▼ -6.00%
- Reading proficiency
- 18% ▼ -3.00%
- Median HH income
- $35,685
- Composite
- 11.54/100
- National rank
- #9699
- State rank
- #312 of 324 in MO
Livability — St. Louis
No livability data for this city. (Only ~50 U.S. cities are tracked.)
Census & demographics
- Census place
- St. Louis, MO
- County
- Saint Louis City · 254,015 people
- City population
- 283,259
- Metro
- St. Louis, MO-IL
- Population (ZIP)
- 14,488
- Household income
- $30,622
- Rent vs Own
- Severe rent burden
- 1655.0
Population outlook (St. Louis County) Hauer SSP2
- Today (2025)
- 315,737 people
- By 2030
- 313,865 · -0.6%
- By 2040
- 305,439 · -3.3%
- By 2050
- 296,529 · -6.1%
- By 2075
- 271,028 · -14.2%
- By 2100
- 255,359 · -19.1%
Race, ethnicity, and origin ACS 2023
- Neighborhood character
- Predominantly Black (95%)
- Race & ethnicity
- Black 95% White 2% Two or more races 2%
- Foreign-born
- 0%
Political lean MEDSL · St. Louis
- 2024 margin
- Solid D (+64.7) · D 81.4% · R 16.7% · Other 2.0%
- 2008→2024 swing
- -3.5pp toward R · 2008: 68.2pp · 2024: 64.7pp
- All cycles
- 2024: D+64.7 2020: D+66.2 2016: D+63.7 2012: D+66.6 2008: D+68.2
Not yet ingested
- Civics
- —
Market trends
- HPI YoY
- ▼ -3.42%
- Current HPI
- 127.3403
- Rent YoY
- —
- Metro
- St. Louis, MO-IL
- State GDP YoY
- ▲ 1.84%
- F500 in state
- 20
Industry mix (Fortune 500 HQ in MO)
| Industry | F500 HQs | Revenue |
|---|---|---|
| Healthcare | 1 | $163B |
|
||
| Insurance | 1 | $21B |
|
||
| Industrial Technology | 1 | $17B |
|
||
| Retail | 1 | $16B |
|
||
| Industrial Distribution | 1 | $10B |
|
||
| Utilities | 1 | $9B |
|
||
Price history
-14.5% since first listed15 events — show timeline
- 2026-04-23 Price Changed $64,100 MARIS as Distributed by MLS Grid
- 2026-03-25 Listed $65,000 MARIS as Distributed by MLS Grid
- 2026-03-25 Coming Soon $65,000 MARIS as Distributed by MLS Grid
- 2025-05-22 Price Changed $109,900 MARIS as Distributed by MLS Grid
- 2025-05-01 Delisted — MARIS as Distributed by MLS Grid
- 2025-05-01 Listed $122,900 MARIS as Distributed by MLS Grid
- 2025-04-09 Price Changed $122,900 MARIS as Distributed by MLS Grid
- 2025-03-27 Relisted — MARIS as Distributed by MLS Grid
- 2025-03-27 Price Changed $124,900 MARIS as Distributed by MLS Grid
- 2025-01-30 Pending — MARIS as Distributed by MLS Grid
- 2024-12-10 Listed $130,000 MARIS as Distributed by MLS Grid
- 2024-12-05 Coming Soon — MARIS as Distributed by MLS Grid
- 2022-05-02 Sold (Public Records) $100,000 Public Records
- 2022-04-29 Sold (Public Records) $75,000 Public Records
- 1995-04-05 Sold (Public Records) — Public Records
Property tax history
-24.3%/yrLatest (2023): $28 · +0.0% YoY. Source: county tax records.
Cash-flow waterfall
monthlySold comps — $/sqft
last 12 mo · ≤1 miLoading sold comps…