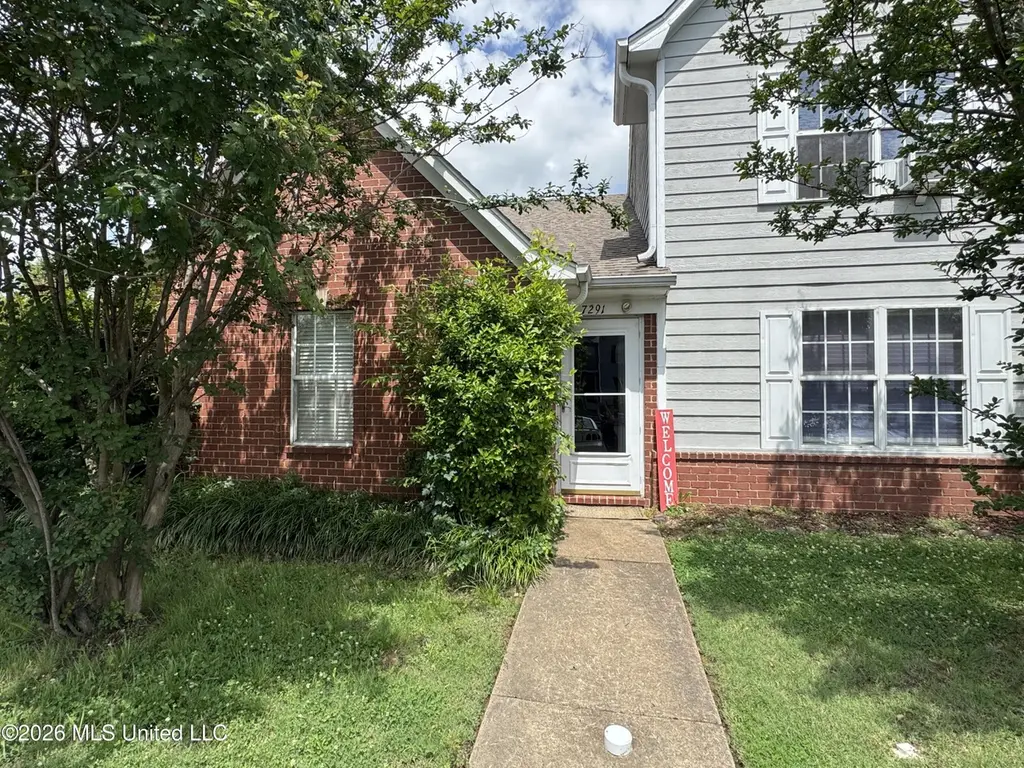
7291 Madelyn Cv · Horn Lake, MS
Flood risk 1/10 · Minimal
- FEMA flood zone
- X (unshaded)
- Chance of flooding over 30 yrs
- 0.0%
- Est. flood insurance / yr
- $507 – $1,088
Fire risk 4/10 · Minor
- Est. fire insurance / yr
- $1,241 – $2,305
Heat risk 7/10 · Major
- Hot days now (above 109°F)
- 7 days/yr
- Hot days in 30 yrs
- 22 days/yr
Wind risk 4/10 · Minor
- Chance of severe wind over 30 yrs
- 17.0%
Air-quality risk 2/10 · Minimal
- Unhealthy air days now
- 2 days/yr
- Unhealthy air days in 30 yrs
- 2 days/yr
Risk factors via First Street. Map © Google.
Why this score? — see what drove the D+ grade
The composite is a weighted blend of 9 inputs, each scored 0–100. Each bar is that input's sub-score; the figure is the points it added to the 100-point composite (weight × sub-score).
- Cash flow +18.3/30.0
- ARV discount +8.2/15.0
- DSCR +5.7/10.0
- 1% rule +4.9/10.0
- Schools +4.0/10.0
- Livability +3.1/5.0
- Condition / age +2.5/5.0
- Rent growth +2.3/5.0
- Appreciation +0.0/10.0
$164,900
🖨 Deal sheet (PDF) 📄 Offer letter ✓ Due diligence
Listing remarks MLS
CEILING FANS IN GREATROOM & MASTER BEDROOM, FIREPLACE W/GAS LINE IN GREATROOM, GE APPLIANCES, BEAUTIFUL LIGHTING PACKAGE, 10 X 10 PATIO, SODDED YARD, GUTTERS FRONT & BACK
Key facts
- Large greenspace
- Covered back patio
- Corner fireplace
Tags
Property features AI
Finance
- HOA & community: Homeowners association present; Association covers grounds maintenance
Exterior
- Parking: No garage
- Utilities: Public water; Public sewer; Cable connected; Electricity connected; Water connected; Sewer connected
- Home design: Townhouse; One level
- Construction: Brick construction; Architectural shingle roof; Slab foundation; Built (year source: Assessor)
- Exterior features: Rain gutters
Interior
- Kitchen: Dishwasher; Free-standing electric oven; Refrigerator
- Bathrooms: 2 full bathrooms
- Heating & cooling: Central heating (natural gas); Central air conditioning (electric/gas)
- Interior features: Eat-in kitchen; Blinds; Metal window frames; Fireplace
- Laundry & utility: Washer and dryer included
Neighborhood map
What this means for you Summary
Snapshot
- This is a 3-bed/2.0-bath townhouse listed at $165k.
Deal economics
- At list price, monthly cash flow is $150 ($2k/yr) — positive.
- The deal already cash-flows at list — no discount required.
- To meet the 1% rule (rent ≥ 1% of price), the offer needs to be $163k (1.0% below list).
- Recommended offer: $162k (1.5% below list) — sets the bar for market timing.
- Cap rate 7.4% vs local median 6.0% in Horn Lake — meaningfully above typical; check what's discounted (condition, days-on-market, listing class) to confirm the premium yield is real.
Location & tenants
- Location reads 61/100 on livability (#196 in MS) — a middle-class / working-renter tenant base. Strengths: cost of living A+, housing A+, crime A; Watch: employment D, amenities F, commute F.
- Desoto County School District (suburban): math 48% / reading 42% proficiency, ranked #20 of 130 in MS (top 15%) — families likely to look elsewhere, expect single-tenant / working-renter base with shorter leases.
- Zoned schools: Horn Lake Elem (451 students, 99% FRL); Horn Lake Middle School (math 37% / reading 21%, grade F, #90 of 179 statewide, top 52%, 1,021 students, 100% FRL); Horn Lake High (math 28% / reading 30%, grade F, #98 of 197 statewide, top 49%, 1,361 students, 100% FRL) — zoned schools average 100% FRL vs 43% district-wide (56 pts higher); higher-poverty schools than district average — tighter screening recommended.
- Zoned-school proficiency averages 29% at this address vs 45% district-wide (-16 pts) — the specific schools serving this property underperform the Desoto County School District average; the district grade overstates school quality for this exact location.
- Market conditions: Rents soft (-0.7%/yr); 95 active listings in the ZIP; 40 comparable units currently listed for rent nearby; rentals at typical pace (median 25d on market — plan ~3-4 weeks tenant-placement turnaround); 1,155 units permitted in DeSoto County in 2024 (0 in 5+ unit buildings).
- This rent runs 37% of the median local income ($53k/yr) — at the standard rent-burdened threshold; future hikes will face affordability resistance.
Forward outlook
- Local home prices are declining (-3.0%/yr); year-one equity from $1k of loan paydown is wiped out by about $5k of value loss. Plan a longer hold.
- DeSoto County population projected at +33% by 2050 — long-run rental-demand tailwind backs the buy-and-hold thesis.
Negotiation context
- It's been on market 16 days — a 2% lower offer ($162k) is reasonable based on typical stale-listing flexibility.
- 3 sale attempts since 24y ago with the ask held roughly flat each time — persistent listings suggest the price (not the market) is what's stuck; bring a comps-based counter.
Risks & watch-outs
- Climate carrying-cost: extreme-heat days projected 7→22/yr by 2055 (HVAC capex compounding) — expect insurance premiums to compound above CPI over the hold.
Questions for the listing agent
- Is there a deadline driving the sale (1031 exchange, divorce, estate, relocation)? That informs how much negotiation room exists.
- Schools are F-rated, which usually means shorter tenancies and higher turnover. Who's the typical renter profile here, and what's been the actual vacancy rate?
- The area grade is low — what's the realistic commute time and amenity access for the typical tenant pool here? Any planned neighborhood developments (good or bad) we should know about?
- What's the average days-on-market for RENTAL listings here right now (not sales)? A rising rental-DOM trend means longer vacancies and softer asking-rent achievability than the comps imply.
- What's the recent tenant-quality profile in this submarket — average credit score on applications, eviction rate, late-payment / NSF rate, and stable-employment percentage? A property-management company in the area should have these aggregated.
- How much new for-sale + rental construction is in the pipeline within 1–3 miles? Heavy new supply typically softens prices + rents 12–24 months out; constrained supply supports both.
Investment metrics
- 1% rule
- 0.99% ✗
- Cap rate
- 7.38%
- Cash-on-cash
- 3.89%
- DSCR
- 1.17
- GRM
- 8.4
CMA / ARV
- ARV (on-the-fly)
- $167,634
- Comps found
- 11
Show comp detail 11 sales within ~0.75 mi
| Address | Dist | Beds/Ba | Sqft | Sold | Price | $/sf | Match |
|---|---|---|---|---|---|---|---|
| 7440 Perrin Ln | 0.15mi | 3/2.0 | 1,206 (0%) | 9mo | $169,900 | $141 | 86 |
| 7321 Madelyn Cv | 0.04mi | 3/3.0 | 1,222 (+1%) | 10mo | $169,900 | $139 | 84 |
| 7365 Perrin Ln | 0.07mi | 3/2.0 | 1,200 (-0%) | 22mo | $169,900 | $142 | 77 |
| 7453 Perrin Ln | 0.16mi | 3/3.0 | 1,205 (-0%) | 18mo | $155,000 | $129 | 73 |
| 7455 Perrin Ln | 0.16mi | 3/3.0 | 1,254 (+4%) | 14mo | $169,900 | $135 | 70 |
| 7276 Madelyn Cv | 0.03mi | 3/3.0 | 1,315 (+9%) | 23mo | $174,000 | $132 | 60 |
| 3174 Kiki Cv | 0.14mi | 3/3.0 | 1,323 (+10%) | 19mo | $185,000 | $140 | 57 |
| 3753 Iron Horse Dr | 0.57mi | 3/2.0 | 1,139 (-6%) | 14mo | $159,900 | $140 | 52 |
| 7227 Conrail Cir | 0.65mi | 3/3.0 | 1,238 (+3%) | 22mo | $172,500 | $139 | 43 |
| 7241 Illinois Central Ave | 0.57mi | 3/3.0 | 1,350 (+12%) | 9mo | $184,000 | $136 | 42 |
| 3748 Conductors Way | 0.55mi | 2/2.0 (-1) | 1,114 (-8%) | 20mo | $149,900 | $135 | 40 |
Match score weights: distance 35% · size 25% · config 20% · recency 20%. Top-matched comps best support the ARV.
Projected returns pro-forma
-3.0% appreciation · 0.0% rent growth · sell at horizon
- IRR
- -13.6%
- Equity multiple
- 0.52×
- Total profit
- $-21,952
- Equity at exit
- $24,587
- IRR
- -10.4%
- Equity multiple
- 0.45×
- Total profit
- $-25,230
- Equity at exit
- $14,258
Cash invested: $46,172 (down + closing). Projections, not guarantees.
Landlord ↔ Tenant lean methodology
- Overall (STATE)
- 90 Strongly Landlord-Friendly
- State Mississippi
- 90 Strongly Landlord-Friendly · R+11
- County
- — inherits STATE
- City
- — inherits STATE
ZIP-level market 38637
- Home prices YoY
- -13.4%
- Rents YoY
- -0.7%
- Active inventory
- 95
- Price-to-rent
- 8.4×
Monthly cashflow live
- Estimated rent
- $1,632 high interval (Pro) →
- Mortgage (P&I)
- −$865
- Tax est. 1.5%
- −$206 /mo · $2,474/yr
- Insurance
- −$69
- HOA
- −$0
- Vacancy / Maint / Mgmt
- −$343
- Net cashflow
- $150
Break-even live
Sensitivity live
| Price | -10% $264 | -5% $207 | +0% $150 | +5% $93 | +10% $36 |
|---|---|---|---|---|---|
| Rent | -10% $21 | -5% $85 | +0% $150 | +5% $214 | +10% $278 |
| Rate | -1.0pp $233 | -0.5pp $192 | base $150 | +0.5pp $107 | +1.0pp $63 |
UW: 25.0% down · 7.5% · 30yr · 1.5% tax · 5.0% vac · 8.0% maint · 8.0% mgmt
Financing live
Cash to close
- Down payment
- $41,225
- Closing costs
- $4,947
- Reserves months
- —
- Total cash needed
- —
Loan-product check · same deal, 3 products live
Conventional
25% down · 7.5% · 30yr
- Down + closing
- —
- Monthly P&I
- —
- Monthly cashflow
- —
- DSCR
- —
- Eligible?
- —
Personal DTI + credit; lowest rate.
DSCR
20% down · 8.5% · 30yr
- Down + closing
- —
- Monthly P&I
- —
- Monthly cashflow
- —
- DSCR
- —
- Eligible?
- —
No personal income docs; deal must DSCR.
Hard money
10% down · 12.0% · 12mo
- Down + closing
- —
- Monthly P&I
- —
- Monthly cashflow
- —
- DSCR
- —
- Eligible?
- —
Short-term bridge; refi at stabilization.
Rent comps 40 comps
| Address | Beds | Baths | Sqft | Rent | $/sqft | DOM | Units | Dist |
|---|---|---|---|---|---|---|---|---|
| 7311 Madelyn Cv Horn Lake, MS | 3.0 | 3.0 | 1263 | $1,395 | $1.10 | 22d | 1 | 0.03mi |
| 7311 Madelyn Cv Horn Lake, MS | 3.0 | 3.0 | 1263 | $1,395 | $1.10 | 24d | 1 | 0.03mi |
| 7101 Tulane Rd N Horn Lake, MS | 2.0–3.0 | 2.0 | 1189 | $1,750 | $1.47 | 3d | 6 | 0.11mi |
| 7063 Foxhall Dr Horn Lake, MS | 3.0 | 2.0 | 1392 | $1,745 | $1.25 | 5d | 1 | 0.12mi |
| 7066 Foxhall Dr Horn Lake, MS | 3.0 | 2.0 | 998 | $1,395 | $1.40 | 45d | 1 | 0.16mi |
| 7341 Lee Ann Dr Horn Lake, MS | 3.0 | 2.0 | 1247 | $1,660 | $1.33 | 3d | 1 | 0.16mi |
| 7123 Hampton Dr Horn Lake, MS | 4.0 | 2.0 | 1214 | $1,630 | $1.34 | 12d | 1 | 0.23mi |
| 7080 Benji Ave Horn Lake, MS | 3.0 | 2.0 | 1276 | $1,550 | $1.21 | 44d | 1 | 0.23mi |
| 7202 Brenwood Dr Horn Lake, MS | 3.0 | 2.0 | 1490 | $1,705 | $1.14 | 22d | 1 | 0.24mi |
| 7139 Hampton Dr Horn Lake, MS | 3.0 | 2.0 | 1247 | $1,550 | $1.24 | 24d | 1 | 0.26mi |
| 7084 Windsor Dr Horn Lake, MS | 4.0 | 2.0 | 1480 | $1,815 | $1.23 | 5d | 1 | 0.33mi |
| 7623 Caitlynn Cir W Horn Lake, MS | 3.0 | 2.0 | 1229 | $1,705 | $1.39 | 44d | 1 | 0.37mi |
| 7163 Layne Dr Horn Lake, MS | 3.0 | 2.0 | 1320 | $1,595 | $1.21 | 24d | 1 | 0.38mi |
| 2621 Pintail Dr Horn Lake, MS | 3.0 | 2.0 | 1356 | $1,740 | $1.28 | 5d | 1 | 0.46mi |
| 7340 Durango Dr Horn Lake, MS | 3.0 | 2.0 | 1362 | $1,705 | $1.25 | 5d | 1 | 0.47mi |
| 3285 Edenshire Ln Horn Lake, MS | 2.0 | 2.0 | 1407 | $1,573 | $1.12 | 24d | 1 | 0.48mi |
| 7609 Woodshire Dr Horn Lake, MS | 3.0 | 2.0 | 1480 | $1,690 | $1.14 | 44d | 1 | 0.51mi |
| 7430 Pintail Dr Horn Lake, MS | 4.0 | 2.0 | 1479 | $1,630 | $1.10 | 44d | 1 | 0.53mi |
| 4174 Highgate Dr Horn Lake, MS | 3.0 | 1.5 | 1197 | $1,495 | $1.25 | 18d | 1 | 0.55mi |
| 7400 Pintail Dr Horn Lake, MS | 4.0 | 2.0 | 1450 | $1,595 | $1.10 | 5d | 1 | 0.57mi |
| 3437 Laurelwood St Horn Lake, MS | 3.0 | 2.0 | 1200 | $1,480 | $1.23 | 12d | 1 | 0.58mi |
| 2881 Normandy Dr Horn Lake, MS | 3.0 | 1.5 | 1283 | $1,450 | $1.13 | 44d | 1 | 0.65mi |
| 2921 Normandy Dr Horn Lake, MS | 3.0 | 1.5 | 1250 | $1,200 | $0.96 | 24d | 1 | 0.68mi |
| 4238 Highgate Dr Horn Lake, MS | 3.0 | 2.0 | 1232 | $1,585 | $1.29 | 44d | 1 | 0.68mi |
| 2628 Hillcrest Cir Horn Lake, MS | 3.0 | 1.0 | 1260 | $1,275 | $1.01 | 44d | 1 | 0.69mi |
| 3914 Santa Fe Loop Horn Lake, MS | 3.0 | 3.0 | 1238 | $1,673 | $1.35 | 24d | 1 | 0.69mi |
| 2890 Meadowbrook Dr Horn Lake, MS | 3.0 | 2.0 | 1171 | $1,375 | $1.17 | 4d | 1 | 0.73mi |
| 6585 Fairwood Cv Horn Lake, MS | 3.0 | 2.0 | 1473 | $1,553 | $1.05 | 24d | 1 | 0.75mi |
| 3560 Lakehurst Dr Horn Lake, MS | 4.0 | 2.0 | 1300 | $1,425 | $1.10 | 18d | 1 | 0.77mi |
| 4192 Anderton Blvd Horn Lake, MS | 3.0 | 2.0 | 1100 | $1,575 | $1.43 | 15d | 1 | 0.77mi |
| 4192 Anderton Blvd Horn Lake, MS | 3.0 | 2.0 | 1100 | $1,575 | $1.43 | 24d | 1 | 0.77mi |
| 3530 Mayfair Dr Horn Lake, MS | 4.0 | 2.0 | 1300 | $1,595 | $1.23 | 15d | 1 | 0.84mi |
| 3681 Jordan View Dr Southaven, MS | 3.0 | 2.0 | 1290 | $1,625 | $1.26 | 15d | 1 | 0.85mi |
| 2675 Ridgewood Cv Horn Lake, MS | 3.0 | 1.0 | 1065 | $1,195 | $1.12 | 22d | 1 | 0.87mi |
| 2675 Ridgewood Cv Horn Lake, MS | 3.0 | 1.0 | 1035 | $1,195 | $1.15 | 24d | 1 | 0.87mi |
| 6475 Forest Glen Dr Horn Lake, MS | 3.0 | 1.5 | 1100 | $1,395 | $1.27 | 44d | 1 | 0.88mi |
| 3915 Woodland Dr Horn Lake, MS | 3.0 | 2.0 | 1400 | $1,775 | $1.27 | 44d | 1 | 0.89mi |
| 6545 Hermitage Rd Horn Lake, MS | 3.0 | 1.5 | 1200 | $1,295 | $1.08 | 44d | 1 | 0.92mi |
| 3060 Fairmeadow Dr Horn Lake, MS | 3.0 | 1.5 | 1104 | $1,663 | $1.51 | 3d | 1 | 0.92mi |
| 6420 Forestgate Rd Horn Lake, MS | 3.0 | 2.0 | 1120 | $1,573 | $1.40 | 22d | 1 | 0.93mi |
Listing history 11 events
-
2026-06-18days on market $164,900 Active 16 DOM
-
2026-06-17days on market $164,900 Active 15 DOM
-
2026-06-16days on market $164,900 Active 14 DOM
-
2026-06-15days on market $164,900 Active 13 DOM
-
2026-06-13days on market $164,900 Active 11 DOM
-
2026-06-10days on market $164,900 Active 8 DOM
-
2026-06-09days on market $164,900 Active 7 DOM
-
2026-06-08days on market $164,900 Active 6 DOM
-
2026-06-07days on market $164,900 Active 5 DOM
-
2026-06-03remarks 699-char remark
-
2026-06-03$164,900 Active 1 DOM
ⓘ Source: listings_history table (triggers on properties + properties_extension) + one-shot
backfill from property_details.listing_events for pre-trigger history.
Climate risk First Street
- Flood 1/10 Low FEMA zone X (unshaded) · 0% chance over 30 yrs
- Wildfire 4/10 Moderate
- Heat 7/10 Severe 7 d/yr ≥109°F today · 22 d/yr by 30 yrs out
- Wind 4/10 Moderate 17% chance of damaging wind over 30 yrs
- Air quality 2/10 Low 2 unhealthy d/yr today · 2 by 30 yrs out
Nearby sold comps map
Loading sold comps map…
Walkable amenities ~0.75 mi
Loading nearby amenities…
Taxation est. · year 1
- Rental income
- $19,582
- − Mortgage interest
- −$9,237
- − Property taxes
- −$2,474
- − Insurance
- −$824
- − Repairs & maintenance
- −$1,567
- − Management
- −$1,567
- − Depreciation
- −$4,797
- Taxable loss
- −$883
- Est. tax savings @ 24.0%
- +$212
- After-tax cash flow
- $2,007/yr
For passive investors: Depreciation is non-cash, so a rental often shows a tax loss while cash-flowing — sheltering income. Rental losses are passive: they offset passive income freely, and up to $25,000/yr can offset ordinary (W-2) income if you actively participate and your MAGI is under $100k (phasing out to $0 by $150k); unused losses carry forward. On sale, claimed depreciation is recaptured at up to 25%, and gains may owe capital-gains tax (a 1031 exchange can defer both). Figures are a year-1 estimate at your 24.0% rate — not tax advice; consult a CPA.
Schools (NCES district)
- District
- Desoto County School District
- NCES district ID
- 2801320
- Math proficiency
- 48% ▼ -13.00%
- Reading proficiency
- 42% ▼ -6.00%
- Median HH income
- $59,272
- Composite
- 39.56/100
- National rank
- #3933
- State rank
- #20 of 130 in MS
Livability — Horn Lake
- Score
- 61/100
- State rank
- #196
- US rank
- #17977
Category grades
Schools grade is shown separately in the Schools card above.
Census & demographics
- Census place
- Horn Lake, MS
- County
- DeSoto County · 176,513 people
- City population
- 26,647
- Metro
- Memphis, TN-MS-AR
- Population (ZIP)
- 26,647
- Household income
- $53,311
- Rent vs Own
- Severe rent burden
- 1052.0
Population outlook (DeSoto County) Hauer SSP2
- Today (2025)
- 203,338 people
- By 2030
- 217,692 · +7.1%
- By 2040
- 245,320 · +20.6%
- By 2050
- 270,133 · +32.8%
- By 2075
- 323,341 · +59.0%
- By 2100
- 348,742 · +71.5%
Race, ethnicity, and origin ACS 2023
- Neighborhood character
- Diverse neighborhood (Simpson 0.62)
- Race & ethnicity
- Black 44% White 42% Hispanic / Latino 9% Two or more races 5% Asian 1%
- Hispanic origin (detail)
- Mexican 7%
- Common ancestry
- Slovak 2% Lithuanian 1% Serbian 1%
- Foreign-born
- 7% · Canada
- Languages at home
- 91% English-only · Spanish 8%
Political lean MEDSL · DeSoto
- 2024 margin
- Strong R (+24.1) · D 36.7% · R 60.8% · Other 2.5%
- 2008→2024 swing
- +14.2pp toward D · 2008: -38.2pp · 2024: -24.1pp
- All cycles
- 2024: R+24.1 2020: R+23.9 2016: R+34.8 2012: R+33.5 2008: R+38.2
Not yet ingested
- Civics
- —
Market trends
- HPI YoY
- ▼ -32.08%
- Current HPI
- 206.5542
- Rent YoY
- ▼ -0.66%
- Metro
- Memphis, TN-MS-AR
- State GDP YoY
- —
- F500 in state
- 0
Price history
+107.7% since first listed7 events — show timeline
- 2026-06-02 Listed $164,900 MLSU
- 2020-09-11 Sold (Public Records) — Public Records
- 2006-02-14 Listing Removed — MLSU
- 2005-09-17 Listed $82,003 MLSU
- 2002-08-14 Sold (Public Records) — Public Records
- 2002-08-09 Sold (MLS) — MLSU
- 2002-04-11 Listed $79,400 MLSU
Property tax history
-31.4%/yrLatest (2025): $8 · +0.0% YoY. Source: county tax records.
Cash-flow waterfall
monthlySold comps — $/sqft
last 12 mo · ≤1 miLoading sold comps…