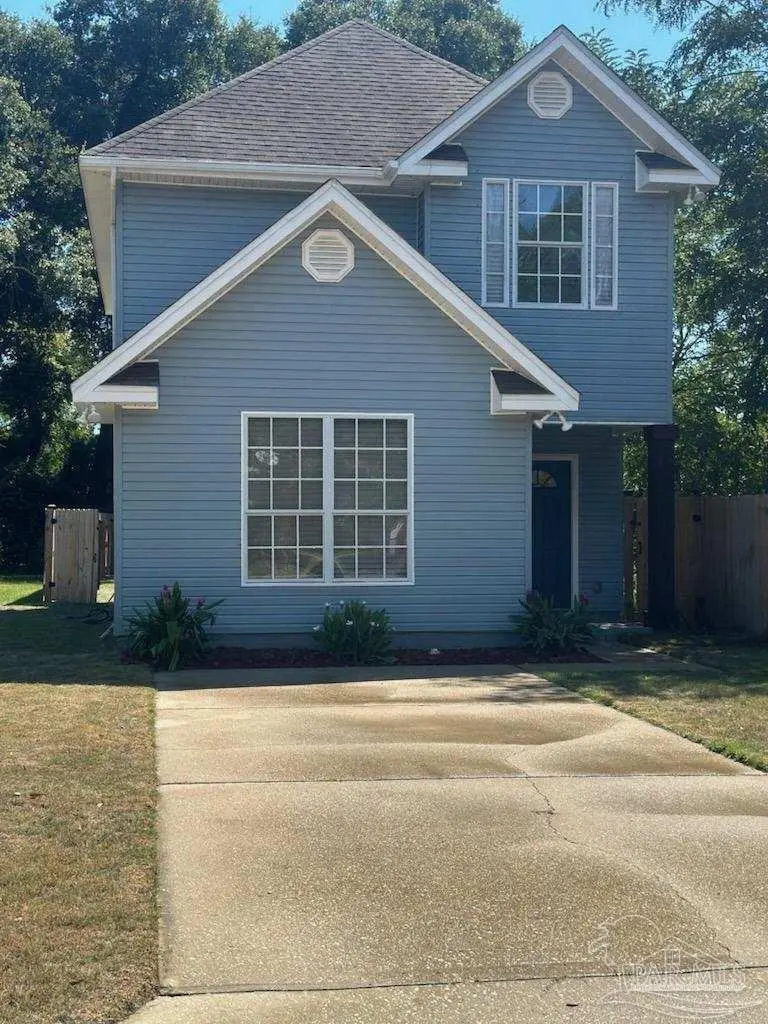
109 E Hatton St · Pensacola, FL
Flood risk 1/10 · Minimal
- FEMA flood zone
- X (unshaded)
- Chance of flooding over 30 yrs
- 0.0%
- Est. flood insurance / yr
- $507 – $1,088
Fire risk 1/10 · Minimal
- Est. fire insurance / yr
- $947 – $1,759
Heat risk 10/10 · Severe
- Hot days now (above 105°F)
- 7 days/yr
- Hot days in 30 yrs
- 22 days/yr
Wind risk 9/10 · Severe
- Chance of severe wind over 30 yrs
- 99.0%
Air-quality risk 2/10 · Minimal
- Unhealthy air days now
- 0 days/yr
- Unhealthy air days in 30 yrs
- 1 days/yr
Risk factors via First Street. Map © Google.
Why this score? — see what drove the C grade
The composite is a weighted blend of 9 inputs, each scored 0–100. Each bar is that input's sub-score; the figure is the points it added to the 100-point composite (weight × sub-score).
- Cash flow +22.3/30.0
- ARV discount +8.6/15.0
- DSCR +7.1/10.0
- 1% rule +4.7/10.0
- Livability +4.2/5.0
- Schools +3.6/10.0
- Rent growth +3.3/5.0
- Condition / age +2.5/5.0
- Appreciation +0.0/10.0
$240,000
🖨 Deal sheet 📄 Offer letter ✓ Due diligence
Listing remarks MLS
Charming Home – 109 E Hatton Street, Pensacola, FL 32503 Welcome to this fully refreshed 3-bedroom, 2-bath single-family home nestled in one of Pensacola’s most sought-after historic neighborhoods. Located on a quiet, tree-lined street in East Hill / East Hillside Estates, this residence combines classic neighborhood charm with thoughtful modern updates and convenient living just minutes from downtown, local eateries, parks, and community amenities.
Key facts
- Modern updates
- Tree-lined street
- Convenient living
Tags
Neighborhood map
What this means for you Summary
Snapshot
- This is a 3-bed/2.5-bath single-family listed at $240k.
Deal economics
- At list price, monthly cash flow is $396 ($5k/yr) — positive.
- The deal already cash-flows at list — no discount required.
- To meet the 1% rule (rent ≥ 1% of price), the offer needs to be $232k (3.3% below list).
- Recommended offer: $218k (9.0% below list) — sets the bar for market timing.
- Cap rate 8.3% vs local median 3.6% in Pensacola — top-decile yield for the area; either an underpriced asset or a hidden risk that comps aren't pricing in. Stress-test before assuming the spread holds.
Location & tenants
- Location reads 83/100 on livability (#53 in FL, #924 nationally) — a professional / high-income tenant draw. Strengths: commute A+, cost of living A+, housing A+.
- Escambia (suburban): math 40% / reading 45% proficiency, ranked #56 of 73 in FL (top 77%) — families likely to look elsewhere, expect single-tenant / working-renter base with shorter leases.
- Market conditions: Rents rising (+3.4%/yr); 240 active listings in the ZIP; 20 comparable units currently listed for rent nearby; rentals at typical pace (median 24d on market — plan ~3-4 weeks tenant-placement turnaround); 1,479 units permitted in Escambia County in 2024 (0 in 5+ unit buildings).
- This rent runs 39% of the median local income ($71k/yr) — at the standard rent-burdened threshold; future hikes will face affordability resistance.
Forward outlook
- Local home prices are declining (-3.0%/yr); year-one equity from $2k of loan paydown is wiped out by about $7k of value loss. Plan a longer hold.
- Escambia County population projected at +13% by 2050 — modest demand growth; plan on rents tracking national, not racing it.
Negotiation context
- It's been on market 114 days — a 9% lower offer ($218k) is reasonable based on typical stale-listing flexibility.
- 5 sale attempts since 22y ago with the ask held roughly flat each time — persistent listings suggest the price (not the market) is what's stuck; bring a comps-based counter.
- Current owner paid $128k; list at $240k implies a 88% gain — meaningful room to come down on a strong offer.
Risks & watch-outs
- Climate carrying-cost: severe wind risk, 99% chance of damaging wind over 30y; extreme-heat days projected 7→22/yr by 2055 (HVAC capex compounding) — expect insurance premiums to compound above CPI over the hold.
Questions for the listing agent
- It's been on market 114 days. Have you received any prior offers? Is the seller open to a 9% concession, seller financing, or rate buy-down credit?
- Why hasn't it sold? Are there any deal-killer items the seller is aware of (foundation, flood, title, zoning, code violations)?
- Is there a deadline driving the sale (1031 exchange, divorce, estate, relocation)? That informs how much negotiation room exists.
- What's the average days-on-market for RENTAL listings here right now (not sales)? A rising rental-DOM trend means longer vacancies and softer asking-rent achievability than the comps imply.
- What's the recent tenant-quality profile in this submarket — average credit score on applications, eviction rate, late-payment / NSF rate, and stable-employment percentage? A property-management company in the area should have these aggregated.
- How much new for-sale + rental construction is in the pipeline within 1–3 miles? Heavy new supply typically softens prices + rents 12–24 months out; constrained supply supports both.
Investment metrics
- 1% rule
- 0.97% ✗
- Cap rate
- 8.27%
- Cash-on-cash
- 7.08%
- DSCR
- 1.31
- GRM
- 8.6
CMA / ARV
- ARV (median comp)
- $246,163
- List price
- $240,000
- Delta
- -2.50%
- Verdict
- FAIR
- Comps
- 20 within 1.0 mi
Show comp detail 12 sales within ~0.75 mi
| Address | Dist | Beds/Ba | Sqft | Sold | Price | $/sf | Match |
|---|---|---|---|---|---|---|---|
| 110 E Bobe St | 0.17mi | 3/2.0 | 1,488 (-5%) | 1mo | $278,000 | $187 | 81 |
| 112 E Bobe St | 0.17mi | 3/2.0 | 1,488 (-5%) | 1mo | $280,000 | $188 | 81 |
| 510 E Fisher St | 0.38mi | 3/1.0 | 1,542 (-2%) | 2mo | $135,000 | $88 | 72 |
| 3110 N 6th Ave | 0.62mi | 3/1.0 | 1,573 (+0%) | 2mo | $115,000 | $73 | 63 |
| 2911 N Miller St | 0.24mi | 3/2.0 | 1,345 (-14%) | 2mo | $240,000 | $178 | 61 |
| 609 E Fisher | 0.42mi | 3/2.0 | 1,400 (-11%) | 1mo | $295,000 | $211 | 60 |
| 1502 N Baylen St | 0.73mi | 3/2.0 | 1,514 (-4%) | 3mo | $405,000 | $268 | 56 |
| 1906 N Spring St | 0.49mi | 3/2.0 | 1,400 (-11%) | 5mo | $465,000 | $332 | 53 |
| 631 W Jordan St | 0.57mi | 3/2.0 | 1,408 (-10%) | 2mo | $170,500 | $121 | 52 |
| 3003 Torres Ave | 0.55mi | 3/1.0 | 1,440 (-8%) | 3mo | $123,000 | $85 | 52 |
| 631 W Avery St | 0.72mi | 2/2.0 (-1) | 1,373 (-12%) | 1mo | $315,000 | $229 | 37 |
| 1811 N 8th Ave | 0.66mi | 4/2.0 (+1) | 1,354 (-14%) | 4mo | $599,999 | $443 | 36 |
Match score weights: distance 35% · size 25% · config 20% · recency 20%. Top-matched comps best support the ARV.
Projected returns pro-forma
-3.0% appreciation · 3.39% rent growth · sell at horizon
- IRR
- -5.1%
- Equity multiple
- 0.81×
- Total profit
- $-12,832
- Equity at exit
- $35,785
- IRR
- 4.9%
- Equity multiple
- 1.37×
- Total profit
- $24,704
- Equity at exit
- $20,751
Cash invested: $67,200 (down + closing). Projections, not guarantees.
Landlord ↔ Tenant lean methodology
- Overall (STATE)
- 87 Strongly Landlord-Friendly
- State Florida
- 87 Strongly Landlord-Friendly · R+3
- County
- — inherits STATE
- City
- — inherits STATE
ZIP-level market 32503
- Rents YoY
- 3.4%
- Active inventory
- 240
- Price-to-rent
- 8.6×
Monthly cashflow live
- Estimated rent
- $2,321 high interval (Pro) →
- Mortgage (P&I)
- −$1,259
- Tax from tax record
- −$79 /mo · $944/yr
- Insurance
- −$100
- HOA
- −$0
- Vacancy / Maint / Mgmt
- −$487
- Net cashflow
- $396
Break-even live
UW: 25.0% down · 7.5% · 30yr · 1.5% tax · 5.0% vac · 8.0% maint · 8.0% mgmt
Financing live
Cash to close
- Down payment
- $60,000
- Closing costs
- $7,200
- Reserves months
- —
- Total cash needed
- —
Loan-product check · same deal, 3 products live
Conventional
25% down · 7.5% · 30yr
- Down + closing
- —
- Monthly P&I
- —
- Monthly cashflow
- —
- DSCR
- —
- Eligible?
- —
Personal DTI + credit; lowest rate.
DSCR
20% down · 8.5% · 30yr
- Down + closing
- —
- Monthly P&I
- —
- Monthly cashflow
- —
- DSCR
- —
- Eligible?
- —
No personal income docs; deal must DSCR.
Hard money
10% down · 12.0% · 12mo
- Down + closing
- —
- Monthly P&I
- —
- Monthly cashflow
- —
- DSCR
- —
- Eligible?
- —
Short-term bridge; refi at stabilization.
Rent comps 20 comps
| Address | Beds | Baths | Sqft | Rent | $/sqft | DOM | Units | Dist |
|---|---|---|---|---|---|---|---|---|
| 407 W Jordan St Unit NA Pensacola, FL | 3.0 | 2.0 | 1300 | $2,200 | $1.69 | 23d | 1 | 0.51mi |
| 2008 N 8th Ave Pensacola, FL | 3.0 | 2.0 | 1058 | $1,250 | $1.18 | 13d | 1 | 0.57mi |
| 3131 N 10th Ave Pensacola, FL | 3.0 | 1.5 | 1085 | $1,700 | $1.57 | 23d | 1 | 0.70mi |
| 1121 E Maxwell St Pensacola, FL | 3.0 | 2.5 | 1716 | $3,550 | $2.07 | 23d | 1 | 0.79mi |
| 1301 E Cross St Pensacola, FL | 3.0 | 2.0 | 2200 | $3,900 | $1.77 | 13d | 1 | 0.88mi |
| 1215 N C St Pensacola, FL | 3.0 | 1.0 | 1203 | $1,775 | $1.48 | 13d | 1 | 1.06mi |
| 1501 E Cross St Pensacola, FL | 4.0 | 2.0 | 1920 | $3,200 | $1.67 | 23d | 1 | 1.06mi |
| 1501 E Cross St Pensacola, FL | 4.0 | 2.0 | 1920 | $3,000 | $1.56 | 13d | 1 | 1.06mi |
| 801 E Gonzalez St Pensacola, FL | 3.0 | 2.0 | 1200 | $2,200 | $1.83 | 13d | 1 | 1.06mi |
| 1414 E Mallory St Pensacola, FL | 3.0 | 2.0 | 1323 | $3,400 | $2.57 | 23d | 1 | 1.14mi |
| 1010 N D St Pensacola, FL | 2.0 | 2.0 | 1196 | $1,850 | $1.55 | 23d | 1 | 1.20mi |
| 2108 W Bobe St Pensacola, FL | 4.0 | 2.0 | 1752 | $2,100 | $1.20 | 23d | 1 | 1.34mi |
| 814 N E St Pensacola, FL | 3.0 | 2.0 | 1440 | $1,695 | $1.18 | 23d | 1 | 1.35mi |
| 504 N Spring St Unit B Pensacola, FL | 3.0 | 1.5 | 1485 | $1,995 | $1.34 | 23d | 1 | 1.36mi |
| 214 W La Rua St Pensacola, FL | 2.0 | 2.5 | 1600 | $2,800 | $1.75 | 13d | 1 | 1.37mi |
| 511 E La Rua St Pensacola, FL | 3.0 | 1.0 | 1128 | $1,475 | $1.31 | 13d | 1 | 1.39mi |
| 615 N A St Pensacola, FL | 3.0 | 2.0 | 1122 | $1,900 | $1.69 | 13d | 1 | 1.40mi |
| 1704 E Lee St Pensacola, FL | 3.0 | 2.0 | 1226 | $2,295 | $1.87 | 23d | 1 | 1.44mi |
| 3014 Magnolia Ave Pensacola, FL | 3.0 | 2.0 | 1650 | $2,750 | $1.67 | 23d | 1 | 1.44mi |
| 706 N F St Pensacola, FL | 3.0 | 2.5 | 2000 | $2,600 | $1.30 | 23d | 1 | 1.45mi |
Listing history 25 events
-
2026-06-18days on market $240,000 Active 114 DOM
-
2026-06-17days on market $240,000 Active 113 DOM
-
2026-06-16days on market $240,000 Active 112 DOM
-
2026-06-15days on market $240,000 Active 111 DOM
-
2026-06-14days on market $240,000 Active 109 DOM
-
2026-06-10days on market $240,000 Active 106 DOM
-
2026-06-09days on market $240,000 Active 105 DOM
-
2026-06-08days on market $240,000 Active 104 DOM
-
2026-06-07days on market $240,000 Active 103 DOM
-
2026-06-03days on market $240,000 Active 99 DOM
-
2026-06-02days on market $240,000 Active 98 DOM
-
2026-06-01days on market $240,000 Active 97 DOM
-
2026-05-31days on market $240,000 Active 96 DOM
-
2026-05-31days on market $240,000 Active 95 DOM
-
2026-02-24$240,000 Active 465-char remark
Show marketing remark (465 chars)
Charming Home – 109 E Hatton Street, Pensacola, FL 32503 Welcome to this fully refreshed 3-bedroom, 2-bath single-family home nestled in one of Pensacola’s most sought-after historic neighborhoods. Located on a quiet, tree-lined street in East Hill / East Hillside Estates, this residence combines classic neighborhood charm with thoughtful modern updates and convenient living just minutes from downtown, local eateries, parks, and community amenities.
-
2007-11-14soldstatus $128,000
-
2006-12-19soldstatus $13,500
-
2006-12-12soldstatus $13,500 17-char remark
Show marketing remark (17 chars)
NICE BUILDING LOT
-
2006-12-12soldstatus $13,500
Show marketing remark (17 chars)
NICE BUILDING LOT
-
2006-12-12soldstatus $13,500 17-char remark
Show marketing remark (17 chars)
NICE BUILDING LOT
-
2005-06-06$15,000
-
2005-02-22historical
-
2004-04-08$12,500
-
2004-04-03$13,500 17-char remark
Show marketing remark (17 chars)
NICE BUILDING LOT
-
2004-04-03$13,500 17-char remark
Show marketing remark (17 chars)
NICE BUILDING LOT
ⓘ Source: listings_history table (triggers on properties + properties_extension) + one-shot
backfill from property_details.listing_events for pre-trigger history.
Tax reassessment forecast FL · Resets to sale price
- Current annual tax
- $944 · $79/mo
- Projected year-2 tax
- $1,992 · $166/mo
- Expected delta
- +$1,048/yr (+$87/mo · 111.1%)
ⓘ Screening estimate from a state-policy table — verify with the county assessor before closing.
Climate risk First Street
- Flood 1/10 Low FEMA zone X (unshaded) · 0% chance over 30 yrs
- Wildfire 1/10 Low
- Heat 10/10 Extreme 7 d/yr ≥105°F today · 22 d/yr by 30 yrs out
- Wind 9/10 Extreme 99% chance of damaging wind over 30 yrs
- Air quality 2/10 Low 0 unhealthy d/yr today · 1 by 30 yrs out
Nearby sold comps map
Loading sold comps map…
Walkable amenities ~0.75 mi
Loading nearby amenities…
Taxation est. · year 1
- Rental income
- $27,852
- − Mortgage interest
- −$13,444
- − Property taxes
- −$944
- − Insurance
- −$1,200
- − Repairs & maintenance
- −$2,228
- − Management
- −$2,228
- − Depreciation
- −$6,982
- Taxable income
- $826
- Est. tax owed @ 24.0%
- −$198
- After-tax cash flow
- $4,558/yr
For passive investors: Depreciation is non-cash, so a rental often shows a tax loss while cash-flowing — sheltering income. Rental losses are passive: they offset passive income freely, and up to $25,000/yr can offset ordinary (W-2) income if you actively participate and your MAGI is under $100k (phasing out to $0 by $150k); unused losses carry forward. On sale, claimed depreciation is recaptured at up to 25%, and gains may owe capital-gains tax (a 1031 exchange can defer both). Figures are a year-1 estimate at your 24.0% rate — not tax advice; consult a CPA.
Schools (NCES district)
- District
- Escambia
- NCES district ID
- 1200510
- Math proficiency
- 40% ▼ -9.00%
- Reading proficiency
- 45% ▼ -4.00%
- Median HH income
- $44,649
- Composite
- 36.04/100
- National rank
- #4773
- State rank
- #56 of 73 in FL
Livability — Pensacola
- Score
- 83/100
- State rank
- #53
- US rank
- #924
Category grades
Schools grade is shown separately in the Schools card above.
Census & demographics
- Census place
- Pensacola, FL
- County
- Escambia County · 301,722 people
- City population
- 237,636
- Metro
- Pensacola-Ferry Pass-Brent, FL
- Population (ZIP)
- 33,559
- Household income
- $71,411
- Rent vs Own
- Severe rent burden
- 948.0
Population outlook (Escambia County) Hauer SSP2
- Today (2025)
- 334,637 people
- By 2030
- 345,779 · +3.3%
- By 2040
- 364,828 · +9.0%
- By 2050
- 378,514 · +13.1%
- By 2075
- 403,220 · +20.5%
- By 2100
- 386,125 · +15.4%
Race, ethnicity, and origin ACS 2023
- Neighborhood character
- Predominantly White (68%)
- Race & ethnicity
- White 68% Black 20% Two or more races 6% Hispanic / Latino 5% Asian 2%
- Common ancestry
- Lithuanian 3% Italian 2% Romanian 2%
- Foreign-born
- 5% · Canada, China
- Languages at home
- 93% English-only · Spanish 3% Arabic 1% Tagalog/Filipino 1%
Political lean MEDSL · Escambia
- 2024 margin
- R (+19.5) · D 39.7% · R 59.2% · Other 1.1%
- 2008→2024 swing
- -0.2pp no change · 2008: -19.3pp · 2024: -19.5pp
- All cycles
- 2024: R+19.5 2020: R+15.1 2016: R+20.6 2012: R+20.6 2008: R+19.3
Not yet ingested
- Civics
- —
Market trends
- HPI YoY
- ▼ -300.02%
- Current HPI
- 294.4873
- Rent YoY
- ▲ 3.39%
- Metro
- Pensacola-Ferry Pass-Brent, FL
- State GDP YoY
- ▲ 3.28%
- F500 in state
- 36
Industry mix (Fortune 500 HQ in FL)
| Industry | F500 HQs | Revenue |
|---|---|---|
| Industrial Technology | 2 | $29B |
|
||
| Insurance | 2 | $17B |
|
||
| Retail | 1 | $60B |
|
||
| Technology Distribution | 1 | $58B |
|
||
| Homebuilding | 1 | $35B |
|
||
| Technology Manufacturing | 1 | $35B |
|
||
Price history
+1677.8% since first listed11 events — show timeline
- 2026-02-24 Listed $240,000 PARMLS
- 2007-11-14 Sold (Public Records) $128,000 Public Records
- 2006-12-19 Sold (Public Records) $13,500 Public Records
- 2006-12-12 Sold (MLS) $13,500 ECAR
- 2006-12-12 Sold (MLS) $13,500 PARMLS
- 2006-12-12 Sold (MLS) $13,500 NAMLS
- 2005-06-06 Listed $15,000 PARMLS
- 2005-02-22 Listing Removed — PARMLS
- 2004-04-08 Listed $12,500 PARMLS
- 2004-04-03 Listed $13,500 ECAR
- 2004-04-03 Listed $13,500 NAMLS
Property tax history
+3.3%/yrLatest (2025): $944 · +8.0% YoY. Source: county tax records.
Cash-flow waterfall
monthlySold comps — $/sqft
last 12 mo · ≤1 miLoading sold comps…