565 Newton Ln · Campbellsville, KY
Flood risk 3/10 · Minor
- FEMA flood zone
- X (unshaded)
- Chance of flooding over 30 yrs
- 0.2%
- Est. flood insurance / yr
- $473 – $860
Fire risk 5/10 · Moderate
- Est. fire insurance / yr
- $839 – $1,559
Heat risk 4/10 · Minor
- Hot days now (above 103°F)
- 7 days/yr
- Hot days in 30 yrs
- 20 days/yr
Wind risk 3/10 · Minor
- Chance of severe wind over 30 yrs
- 5.0%
Air-quality risk 1/10 · Minimal
- Unhealthy air days now
- 0 days/yr
- Unhealthy air days in 30 yrs
- 0 days/yr
Risk factors via First Street. Map © Google.
Why this score? — see what drove the F grade
The composite is a weighted blend of 9 inputs, each scored 0–100. Each bar is that input's sub-score; the figure is the points it added to the 100-point composite (weight × sub-score).
- Cash flow +8.7/30.0
- ARV discount +7.5/15.0
- Livability +3.8/5.0
- Schools +2.9/10.0
- Rent growth +2.5/5.0
- Condition / age +2.5/5.0
- DSCR +2.4/10.0
- 1% rule +1.4/10.0
- Appreciation +0.0/10.0
$220,000
🖨 Deal sheet 📄 Offer letter ✓ Due diligence
Listing remarks
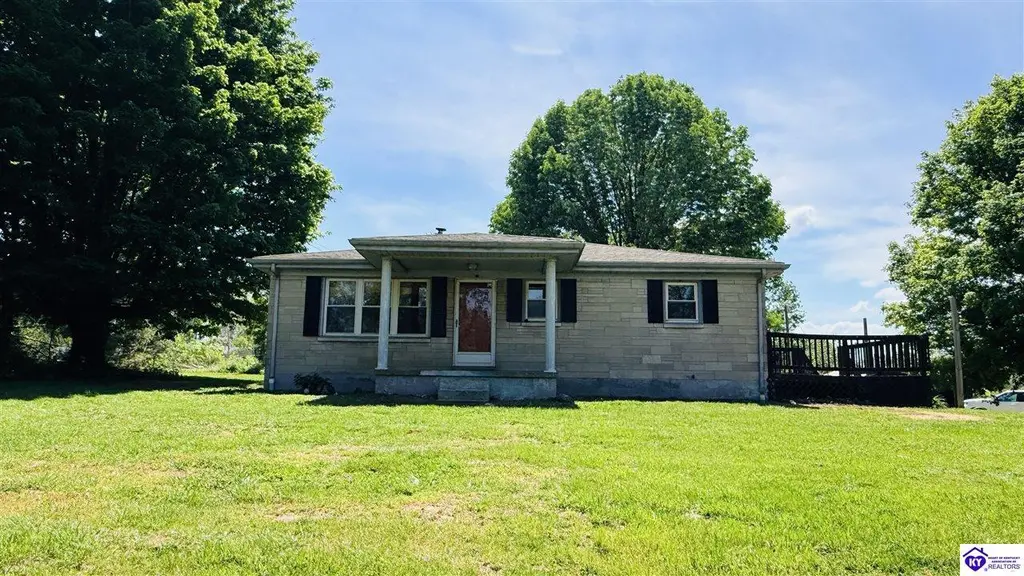
Spacious 5-bedroom, 2-bath Bedford cut stone home situated on 2.12 acres with room to spread out! This property offers a functional layout featuring 3 bedrooms and 1 bath upstairs, along with a living room and kitchen. The full walk-out basement includes a large laundry area, a den, 2 additional bedrooms, and 1 bath, providing excellent extra living space or guest accommodations. Enjoy outdoor living with a covered front porch, a large uncovered side porch, and an attached sunroom off the basement. The property also includes a barn, work shed, and a partially fenced barn area ideal for livestock or hobby farm use. A great opportunity for those looking for space, country charm, and functiona
Key facts
- Covered front porch
- Large laundry area
- Cut stone home
Tags
Property features AI
Finance
- Other: Outbuildings include barn(s), workshop, and additional outbuilding; Property sits on approximately 2.12 acres
Exterior
- Parking: Gravel parking
- Utilities: Septic tank
- Home design: Single-family residential property
- Construction: Stone construction; Shingle roof; Below-grade finished area present
- Exterior features: Garden; Deck (covered); Porch (covered, screened)
Interior
- Kitchen: Dishwasher; Range; Oven; Refrigerator; Electric water heater
- Flooring: Hardwood; Laminate; Vinyl
- Bathrooms: 2 full bathrooms; 1 main-level bathroom
- Heating & cooling: Central heating; Electric heating; Wood and wood stove heating options; Central air conditioning
- Interior features: Eat-in kitchen; Finished full basement with walk-out access and exterior entry
- Laundry & utility: Laundry room
Neighborhood map
What this means for you Summary
Snapshot
- This is a 3-bed/1.0-bath other listed at $220k.
Deal economics
- At list price, monthly cash flow is $-187 ($-2k/yr) — negative.
- To cash-flow at today's rent, offer at most $187k (15.0% below list).
- To meet the 1% rule (rent ≥ 1% of price), the offer needs to be $142k (35.6% below list).
- Recommended offer: $142k (35.6% below list) — sets the bar for 1% rule.
- Cap rate 5.3% vs local median 3.7% in Campbellsville — top-decile yield for the area; either an underpriced asset or a hidden risk that comps aren't pricing in. Stress-test before assuming the spread holds.
Location & tenants
- Location reads 76/100 on livability (#94 in KY, #3,786 nationally) — a middle-class / working-renter tenant base. Strengths: cost of living A+, housing A+, health & safety A+; Watch: amenities D+, commute F, employment F.
- Taylor County (town): math 26% / reading 42% proficiency, ranked #71 of 165 in KY (top 43%) — families likely to look elsewhere, expect single-tenant / working-renter base with shorter leases.
- Market conditions: 186 active listings in the ZIP; 10 units permitted in Taylor County in 2024 (0 in 5+ unit buildings).
Forward outlook
- Local home prices are declining (-3.0%/yr); year-one equity from $2k of loan paydown is wiped out by about $7k of value loss. Plan a longer hold.
- Taylor County population projected at +13% by 2050 — modest demand growth; plan on rents tracking national, not racing it.
Negotiation context
- Only 3 days on market — expect competitive offers; lowballing is unlikely to land.
Risks & watch-outs
- Climate carrying-cost: moderate wildfire risk — expect insurance premiums to compound above CPI over the hold.
Questions for the listing agent
- What do current leases actually rent for vs. the listed asking? Can we see a recent rent roll and the last 12 months of T-12 income?
- Built in 1976 — when were the roof, HVAC, electrical panel, plumbing, and water heater last replaced?
- Is there a deadline driving the sale (1031 exchange, divorce, estate, relocation)? That informs how much negotiation room exists.
- The area grade is low — what's the realistic commute time and amenity access for the typical tenant pool here? Any planned neighborhood developments (good or bad) we should know about?
- What's the average days-on-market for RENTAL listings here right now (not sales)? A rising rental-DOM trend means longer vacancies and softer asking-rent achievability than the comps imply.
- What's the recent tenant-quality profile in this submarket — average credit score on applications, eviction rate, late-payment / NSF rate, and stable-employment percentage? A property-management company in the area should have these aggregated.
- How much new for-sale + rental construction is in the pipeline within 1–3 miles? Heavy new supply typically softens prices + rents 12–24 months out; constrained supply supports both.
Investment metrics
- 1% rule
- 0.64% ✗
- Cap rate
- 5.27%
- Cash-on-cash
- -3.64%
- DSCR
- 0.84
- GRM
- 12.9
CMA / ARV
No comps found within radius.
Projected returns pro-forma
-3.0% appreciation · 3.0% rent growth · sell at horizon
- IRR
- -22.5%
- Equity multiple
- 0.23×
- Total profit
- $-47,654
- Equity at exit
- $32,803
- IRR
- -16.8%
- Equity multiple
- 0.07×
- Total profit
- $-57,259
- Equity at exit
- $19,022
Cash invested: $61,600 (down + closing). Projections, not guarantees.
Landlord ↔ Tenant lean methodology
- Overall (STATE)
- 83 Strongly Landlord-Friendly
- State Kentucky
- 83 Strongly Landlord-Friendly · R+16
- County
- — inherits STATE
- City
- — inherits STATE
ZIP-level market 42718
- Home prices YoY
- -30.1%
- Active inventory
- 186
- Price-to-rent
- 12.9×
Monthly cashflow live
- Estimated rent
- $1,417 medium interval (Pro) →
- Mortgage (P&I)
- −$1,154
- Tax from tax record
- −$61 /mo · $726/yr
- Insurance
- −$92
- HOA
- −$0
- Vacancy / Maint / Mgmt
- −$297
- Net cashflow
- $-187
Break-even live
UW: 25.0% down · 7.5% · 30yr · 1.5% tax · 5.0% vac · 8.0% maint · 8.0% mgmt
Financing live
Cash to close
- Down payment
- $55,000
- Closing costs
- $6,600
- Reserves months
- —
- Total cash needed
- —
Loan-product check · same deal, 3 products live
Conventional
25% down · 7.5% · 30yr
- Down + closing
- —
- Monthly P&I
- —
- Monthly cashflow
- —
- DSCR
- —
- Eligible?
- —
Personal DTI + credit; lowest rate.
DSCR
20% down · 8.5% · 30yr
- Down + closing
- —
- Monthly P&I
- —
- Monthly cashflow
- —
- DSCR
- —
- Eligible?
- —
No personal income docs; deal must DSCR.
Hard money
10% down · 12.0% · 12mo
- Down + closing
- —
- Monthly P&I
- —
- Monthly cashflow
- —
- DSCR
- —
- Eligible?
- —
Short-term bridge; refi at stabilization.
Listing history 3 events
-
2026-05-08status Pending 709-char remark
-
2026-04-27$220,000 Active 709-char remark
-
2019-01-09soldstatus $75,000
ⓘ Source: listings_history table (triggers on properties + properties_extension) + one-shot
backfill from property_details.listing_events for pre-trigger history.
Tax reassessment forecast KY · Resets to sale price
- Current annual tax
- $726 · $61/mo
- Projected year-2 tax
- $1,892 · $158/mo
- Expected delta
- +$1,166/yr (+$97/mo · 160.5%)
ⓘ Screening estimate from a state-policy table — verify with the county assessor before closing.
Climate risk First Street
- Flood 3/10 Moderate FEMA zone X (unshaded) · 20% chance over 30 yrs
- Wildfire 5/10 Major
- Heat 4/10 Moderate 7 d/yr ≥103°F today · 20 d/yr by 30 yrs out
- Wind 3/10 Moderate 5% chance of damaging wind over 30 yrs
- Air quality 1/10 Low 0 unhealthy d/yr today · 0 by 30 yrs out
Nearby sold comps map
Loading sold comps map…
Walkable amenities ~0.75 mi
Loading nearby amenities…
Taxation est. · year 1
- Rental income
- $17,000
- − Mortgage interest
- −$12,323
- − Property taxes
- −$726
- − Insurance
- −$1,100
- − Repairs & maintenance
- −$1,360
- − Management
- −$1,360
- − Depreciation
- −$6,400
- Taxable loss
- −$6,270
- Est. tax savings @ 24.0%
- +$1,505
- After-tax cash flow
- $-736/yr
For passive investors: Depreciation is non-cash, so a rental often shows a tax loss while cash-flowing — sheltering income. Rental losses are passive: they offset passive income freely, and up to $25,000/yr can offset ordinary (W-2) income if you actively participate and your MAGI is under $100k (phasing out to $0 by $150k); unused losses carry forward. On sale, claimed depreciation is recaptured at up to 25%, and gains may owe capital-gains tax (a 1031 exchange can defer both). Figures are a year-1 estimate at your 24.0% rate — not tax advice; consult a CPA.
Schools (NCES district)
- District
- Taylor County
- NCES district ID
- 2105520
- Math proficiency
- 26% ▼ -20.00%
- Reading proficiency
- 42% ▼ -13.00%
- Median HH income
- $42,883
- Composite
- 28.78/100
- National rank
- #6667
- State rank
- #71 of 165 in KY
Livability — Campbellsville
- Score
- 76/100
- State rank
- #94
- US rank
- #3786
Category grades
Schools grade is shown separately in the Schools card above.
Census & demographics
- Population (ZIP)
- 26,461
Population outlook (Taylor County) Hauer SSP2
- Today (2025)
- 27,046 people
- By 2030
- 27,794 · +2.8%
- By 2040
- 29,231 · +8.1%
- By 2050
- 30,486 · +12.7%
- By 2075
- 33,767 · +24.9%
- By 2100
- 34,638 · +28.1%
Race, ethnicity, and origin ACS 2023
- Neighborhood character
- Predominantly White (89%)
- Race & ethnicity
- White 89% Black 5% Two or more races 4% Hispanic / Latino 3%
- Common ancestry
- Slovak 2% Italian 1% Iranian 1%
- Foreign-born
- 1% · Canada
- Languages at home
- 98% English-only · Spanish 1%
Political lean MEDSL · Taylor
- 2024 margin
- Solid R (+56.7) · D 21.0% · R 77.7% · Other 1.3%
- 2008→2024 swing
- -16.1pp toward R · 2008: -40.5pp · 2024: -56.7pp
- All cycles
- 2024: R+56.7 2020: R+51.2 2016: R+51.0 2012: R+39.0 2008: R+40.5
Not yet ingested
- Civics
- —
Market trends
- HPI YoY
- ▼ -94.56%
- Current HPI
- 219.877
- Rent YoY
- —
- Metro
- —
- State GDP YoY
- ▲ 1.81%
- F500 in state
- 4
Industry mix (Fortune 500 HQ in KY)
| Industry | F500 HQs | Revenue |
|---|---|---|
| Healthcare | 1 | $118B |
|
||
| Food / Beverage | 1 | $7B |
|
||
Price history
+180.0% since first listed5 events — show timeline
- 2026-06-05 Sold (Public Records) $210,000 Public Records
- 2026-06-04 Sold (MLS) $210,000 HKARMLS
- 2026-05-08 Pending — HKARMLS
- 2026-04-27 Listed $220,000 HKARMLS
- 2019-01-09 Sold (Public Records) $75,000 Public Records
Property tax history
+3.4%/yrLatest (2025): $726 · -1.3% YoY. Source: county tax records.
Cash-flow waterfall
monthlySold comps — $/sqft
last 12 mo · ≤1 miLoading sold comps…