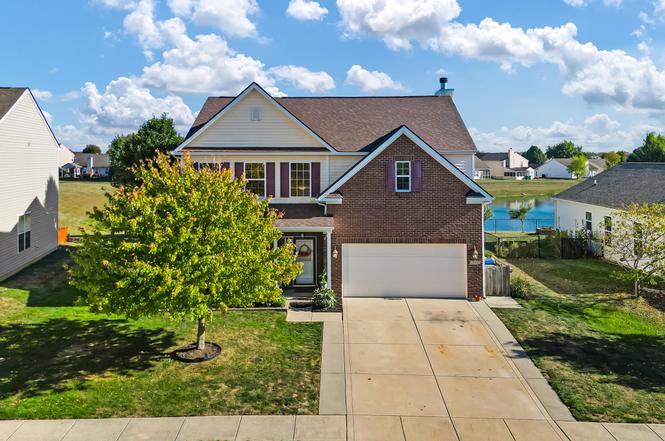
3413 Roundlake Ln · Whitestown, IN
Flood risk 1/10 · Minimal
- FEMA flood zone
- X (unshaded)
- Chance of flooding over 30 yrs
- 0.0%
- Est. flood insurance / yr
- $507 – $1,088
Fire risk 1/10 · Minimal
- Est. fire insurance / yr
- $717 – $1,331
Heat risk 3/10 · Minor
- Hot days now (above 102°F)
- 7 days/yr
- Hot days in 30 yrs
- 18 days/yr
Wind risk 2/10 · Minimal
- Chance of severe wind over 30 yrs
- 1.0%
Air-quality risk 3/10 · Minor
- Unhealthy air days now
- 2 days/yr
- Unhealthy air days in 30 yrs
- 3 days/yr
Risk factors via First Street. Map © Google.
Why this score? — see what drove the D grade
The composite is a weighted blend of 9 inputs, each scored 0–100. Each bar is that input's sub-score; the figure is the points it added to the 100-point composite (weight × sub-score).
- Cash flow +12.8/30.0
- ARV discount +9.8/15.0
- DSCR +3.8/10.0
- Schools +3.7/10.0
- Livability +3.7/5.0
- 1% rule +3.3/10.0
- Rent growth +2.7/5.0
- Condition / age +2.5/5.0
- Appreciation +0.0/10.0
$400,000
🖨 Deal sheet (PDF) 📄 Offer letter ✓ Due diligence
Listing remarks MLS
The best of both worlds in this home on a pond that features 9 ft ceilings & upgrades throughout. Formal LR and DR. Arched openings take you to the open concept kitchen w/oversized island & large pantry. Kitchen opens up to a large family room & sunroom with a vaulted ceiling and tons of daylight. Upstairs features Master suite w/tray ceiling, HUGE walk-in closet, & bath w/garden tub & separate shower. 4th bedroom has double doors & could also serve as a loft or office. Great views throughout!
Key facts
- Garden
- Hot tub
- Remodeled kitchen
Tags
Neighborhood map
What this means for you Summary
Snapshot
- This is a 5-bed/2.5-bath single-family listed at $400k.
Deal economics
- At list price, monthly cash flow is $-33 ($-399/yr) — negative.
- To cash-flow at today's rent, offer at most $394k (1.5% below list).
- To meet the 1% rule (rent ≥ 1% of price), the offer needs to be $331k (17.2% below list).
- Recommended offer: $331k (17.2% below list) — sets the bar for 1% rule.
- Cap rate 6.2% vs local median 4.2% in Whitestown — top-decile yield for the area; either an underpriced asset or a hidden risk that comps aren't pricing in. Stress-test before assuming the spread holds.
Location & tenants
- Location reads 73/100 on livability (#109 in IN) — a middle-class / working-renter tenant base. Strengths: employment A+, housing A+, cost of living A; Watch: amenities F, commute F, health & safety F.
- Lebanon Community School Corporation (town): math 41% / reading 44% proficiency, ranked #115 of 301 in IN (top 38%) — families likely to look elsewhere, expect single-tenant / working-renter base with shorter leases.
- Zoned schools: Perry Worth Elementary School (math 57% / reading 47%, grade C-, #237 of 994 statewide, top 26%, 430 students, 30% FRL); Lebanon Middle School (math 35% / reading 40%, grade F, #146 of 330 statewide, top 46%, 807 students, 46% FRL); Lebanon Senior High School (math 43% / reading 68%, grade C, #75 of 369 statewide, top 20%, 1,027 students, 38% FRL) — zoned schools at 38% FRL track the district average.
- Market conditions: Rents flat; 270 active listings in the ZIP; 9 comparable units currently listed for rent nearby; rentals leasing fast (median 5d on market — plan ~1-2 weeks tenant-placement turnaround); high-income renter base; 898 units permitted in Boone County in 2024 (0 in 5+ unit buildings).
- This rent runs 34% of the median local income ($117k/yr) — at the standard rent-burdened threshold; future hikes will face affordability resistance.
Forward outlook
- Local home prices are declining (-3.0%/yr); year-one equity from $3k of loan paydown is wiped out by about $12k of value loss. Plan a longer hold.
- Boone County population projected at +46% by 2050 — long-run rental-demand tailwind backs the buy-and-hold thesis.
Negotiation context
- It's been on market 46 days — a 3% lower offer ($388k) is reasonable based on typical stale-listing flexibility.
- 4 sale attempts since 13y ago; this cycle's ask has dropped $25k (6%) from the opening price — seller is motivated, your offer sets the floor, not the list.
- Current owner paid $217k; list at $400k implies a 84% gain — meaningful room to come down on a strong offer.
Questions for the listing agent
- What do current leases actually rent for vs. the listed asking? Can we see a recent rent roll and the last 12 months of T-12 income?
- It's been on market 46 days. Have you received any prior offers? Is the seller open to a 17% concession, seller financing, or rate buy-down credit?
- What does the HOA fee cover, when was the last increase, and are there any pending special assessments or reserve-fund shortfalls?
- Is there a deadline driving the sale (1031 exchange, divorce, estate, relocation)? That informs how much negotiation room exists.
- Schools are A-rated — typically a magnet for longer-tenancy family renters. What's the average tenant stay here, and is there a school-zone premium baked into asking?
- The area grade is low — what's the realistic commute time and amenity access for the typical tenant pool here? Any planned neighborhood developments (good or bad) we should know about?
- What's the average days-on-market for RENTAL listings here right now (not sales)? A rising rental-DOM trend means longer vacancies and softer asking-rent achievability than the comps imply.
- What's the recent tenant-quality profile in this submarket — average credit score on applications, eviction rate, late-payment / NSF rate, and stable-employment percentage? A property-management company in the area should have these aggregated.
- How much new for-sale + rental construction is in the pipeline within 1–3 miles? Heavy new supply typically softens prices + rents 12–24 months out; constrained supply supports both.
Investment metrics
- 1% rule
- 0.83% ✗
- Cap rate
- 6.19%
- Cash-on-cash
- -0.36%
- DSCR
- 0.98
- GRM
- 10.1
CMA / ARV
- ARV (on-the-fly)
- $421,968
- Comps found
- 12
Show comp detail 12 sales within ~0.75 mi
| Address | Dist | Beds/Ba | Sqft | Sold | Price | $/sf | Match |
|---|---|---|---|---|---|---|---|
| 3413 Roundlake Ln | 0.00mi | 4/3.0 (-1) | 2,832 (0%) | 1mo | $400,000 | $141 | 92 |
| 3769 Limelight Ln | 0.35mi | 4/2.5 (-1) | 2,692 (-5%) | 0mo | $318,200 | $118 | 70 |
| 3851 Tartan Trl | 0.42mi | 5/2.5 | 3,050 (+8%) | 2mo | $407,500 | $134 | 66 |
| 3397 Sugar Grove Dr | 0.53mi | 4/2.5 (-1) | 2,751 (-3%) | 1mo | $380,000 | $138 | 64 |
| 3357 Sugar Grove Dr | 0.55mi | 4/2.5 (-1) | 2,746 (-3%) | 1mo | $386,790 | $141 | 63 |
| 6559 Seabiscuit Rd | 0.52mi | 4/2.5 (-1) | 2,618 (-8%) | 1mo | $415,000 | $159 | 58 |
| 3629 Duncan Ct | 0.45mi | 5/3.0 | 2,460 (-13%) | 1mo | $360,000 | $146 | 54 |
| 6548 Seattle Slew Dr | 0.63mi | 4/2.5 (-1) | 2,602 (-8%) | 0mo | $445,000 | $171 | 52 |
| 3363 Sugar Grove Dr | 0.55mi | 5/3.0 | 2,460 (-13%) | 2mo | $395,000 | $161 | 49 |
| 3280 Sugar Grove Dr | 0.63mi | 5/3.0 | 2,465 (-13%) | 0mo | $375,085 | $152 | 47 |
| 3251 Sugar Grove Dr | 0.62mi | 5/3.0 | 2,460 (-13%) | 1mo | $365,520 | $149 | 46 |
| 5783 Blue Sky Dr | 0.67mi | 4/2.5 (-1) | 2,456 (-13%) | 0mo | $369,900 | $151 | 41 |
Match score weights: distance 35% · size 25% · config 20% · recency 20%. Top-matched comps best support the ARV.
Projected returns pro-forma
-3.0% appreciation · 0.77% rent growth · sell at horizon
- IRR
- -19.3%
- Equity multiple
- 0.34×
- Total profit
- $-74,224
- Equity at exit
- $59,641
- IRR
- -17.2%
- Equity multiple
- 0.14×
- Total profit
- $-95,962
- Equity at exit
- $34,585
Cash invested: $112,000 (down + closing). Projections, not guarantees.
Landlord ↔ Tenant lean methodology
- Overall (STATE)
- 90 Strongly Landlord-Friendly
- State Indiana
- 90 Strongly Landlord-Friendly · R+11
- County
- — inherits STATE
- City
- — inherits STATE
ZIP-level market 46075
- Home prices YoY
- -20.0%
- Rents YoY
- 0.8%
- Active inventory
- 270
- Price-to-rent
- 10.1×
Monthly cashflow live
- Estimated rent
- $3,311 high interval (Pro) →
- Mortgage (P&I)
- −$2,098
- Tax from tax record
- −$334 /mo · $4,012/yr
- Insurance
- −$167
- HOA
- −$50
- Lot rent
- −$0
- Vacancy / Maint / Mgmt
- −$695
- Net cashflow
- $-33
Break-even live
Sensitivity live
| Price | -10% $193 | -5% $80 | +0% $-33 | +5% $-146 | +10% $-260 |
|---|---|---|---|---|---|
| Rent | -10% $-295 | -5% $-164 | +0% $-33 | +5% $97 | +10% $228 |
| Rate | -1.0pp $168 | -0.5pp $68 | base $-33 | +0.5pp $-137 | +1.0pp $-242 |
UW: 25.0% down · 7.5% · 30yr · 1.5% tax · 5.0% vac · 8.0% maint · 8.0% mgmt
Financing live
Cash to close
- Down payment
- $100,000
- Closing costs
- $12,000
- Reserves months
- —
- Total cash needed
- —
Loan-product check · same deal, 3 products live
Conventional
25% down · 7.5% · 30yr
- Down + closing
- —
- Monthly P&I
- —
- Monthly cashflow
- —
- DSCR
- —
- Eligible?
- —
Personal DTI + credit; lowest rate.
DSCR
20% down · 8.5% · 30yr
- Down + closing
- —
- Monthly P&I
- —
- Monthly cashflow
- —
- DSCR
- —
- Eligible?
- —
No personal income docs; deal must DSCR.
Hard money
10% down · 12.0% · 12mo
- Down + closing
- —
- Monthly P&I
- —
- Monthly cashflow
- —
- DSCR
- —
- Eligible?
- —
Short-term bridge; refi at stabilization.
Rent comps 9 comps
| Address | Beds | Baths | Sqft | Rent | $/sqft | DOM | Units | Dist |
|---|---|---|---|---|---|---|---|---|
| 3766 White Cliff Way Unit 1464961P Whitestown, IN | 5.0 | 2.0 | 2798 | $5,704 | $2.04 | 4d | 1 | 0.39mi |
| 5773 Weeping Willow Pl Whitestown, IN | 4.0 | 2.5 | 2514 | $2,201 | $0.88 | 10d | 1 | 0.53mi |
| 3340 Preakness St Whitestown, IN | 4.0 | 2.5 | 2426 | $2,699 | $1.11 | 5d | 1 | 0.70mi |
| 6251 Rhinecliff Dr Whitestown, IN | 5.0 | 2.5 | 2376 | $2,399 | $1.01 | 46d | 1 | 0.78mi |
| 2606 Plano Dr Unit NA Whitestown, IN | 4.0 | 3.0 | 2119 | $2,600 | $1.23 | 0d | 1 | 1.07mi |
| 2557 Lamar Dr Whitestown, IN | 4.0 | 2.5 | 1981 | $2,199 | $1.11 | 46d | 1 | 1.11mi |
| 2881 Cross Branch Dr Whitestown, IN | 3.0–4.0 | 2.5 | 1835 | $2,399 | $1.31 | 21d | 4 | 1.17mi |
| 2519 Dixon Creek Dr Whitestown, IN | 5.0 | 3.0 | 3867 | $2,530 | $0.65 | 4d | 1 | 1.39mi |
| 6831 Orchard Run Cir Whitestown, IN | 4.0 | 2.5 | 2131 | $2,350 | $1.10 | 0d | 1 | 1.47mi |
HOA detail
- Monthly dues
- $50 · $600/yr
Listing history 12 events
-
2026-04-06status Pending
-
2026-03-27status Active
-
2026-03-27price $400,000
-
2025-11-18historical
-
2025-10-13$425,000 Active
-
2017-11-29soldstatus $217,000
-
2015-05-26soldstatus $205,000
-
2015-05-22soldstatus $205,000 Sold 522-char remark
Show marketing remark (522 chars)
The best of both worlds in this home on a pond that features 9 ft ceilings & upgrades throughout. Formal LR and DR. Arched openings take you to the open concept kitchen w/oversized island & large pantry. Kitchen opens up to a large family room & sunroom with a vaulted ceiling and tons of daylight. Upstairs features Master suite w/tray ceiling, HUGE walk-in closet, & bath w/garden tub & separate shower. 4th bedroom has double doors & could also serve as a loft or office. Great views throughout!
-
2015-04-23historical Contingent - Backup Pending Home Inspection 522-char remark
Show marketing remark (522 chars)
The best of both worlds in this home on a pond that features 9 ft ceilings & upgrades throughout. Formal LR and DR. Arched openings take you to the open concept kitchen w/oversized island & large pantry. Kitchen opens up to a large family room & sunroom with a vaulted ceiling and tons of daylight. Upstairs features Master suite w/tray ceiling, HUGE walk-in closet, & bath w/garden tub & separate shower. 4th bedroom has double doors & could also serve as a loft or office. Great views throughout!
-
2015-04-14$209,900 Active 522-char remark
Show marketing remark (522 chars)
The best of both worlds in this home on a pond that features 9 ft ceilings & upgrades throughout. Formal LR and DR. Arched openings take you to the open concept kitchen w/oversized island & large pantry. Kitchen opens up to a large family room & sunroom with a vaulted ceiling and tons of daylight. Upstairs features Master suite w/tray ceiling, HUGE walk-in closet, & bath w/garden tub & separate shower. 4th bedroom has double doors & could also serve as a loft or office. Great views throughout!
-
2013-10-01historical
-
2013-03-21$204,900
ⓘ Source: listings_history table (triggers on properties + properties_extension) + one-shot
backfill from property_details.listing_events for pre-trigger history.
Tax reassessment forecast IN · Partial reset (capped growth)
- Current annual tax
- $4,012 · $334/mo
- Projected year-2 tax
- $4,012 · $334/mo
- Expected delta
- $0/yr ($0/mo · 0.0%)
ⓘ Screening estimate from a state-policy table — verify with the county assessor before closing.
Climate risk First Street
- Flood 1/10 Low FEMA zone X (unshaded) · 0% chance over 30 yrs
- Wildfire 1/10 Low
- Heat 3/10 Moderate 7 d/yr ≥102°F today · 18 d/yr by 30 yrs out
- Wind 2/10 Low 100% chance of damaging wind over 30 yrs
- Air quality 3/10 Moderate 2 unhealthy d/yr today · 3 by 30 yrs out
Nearby sold comps map
Loading sold comps map…
Walkable amenities ~0.75 mi
Loading nearby amenities…
Taxation est. · year 1
- Rental income
- $39,727
- − Mortgage interest
- −$22,406
- − Property taxes
- −$4,012
- − Insurance
- −$2,000
- − Repairs & maintenance
- −$3,178
- − Management
- −$3,178
- − HOA
- −$600
- − Depreciation
- −$11,636
- Taxable loss
- −$7,284
- Est. tax savings @ 24.0%
- +$1,748
- After-tax cash flow
- $1,349/yr
For passive investors: Depreciation is non-cash, so a rental often shows a tax loss while cash-flowing — sheltering income. Rental losses are passive: they offset passive income freely, and up to $25,000/yr can offset ordinary (W-2) income if you actively participate and your MAGI is under $100k (phasing out to $0 by $150k); unused losses carry forward. On sale, claimed depreciation is recaptured at up to 25%, and gains may owe capital-gains tax (a 1031 exchange can defer both). Figures are a year-1 estimate at your 24.0% rate — not tax advice; consult a CPA.
Schools (NCES district)
- District
- Lebanon Community School Corporation
- NCES district ID
- 1805790
- Math proficiency
- 41% ▼ -11.00%
- Reading proficiency
- 44% ▼ -5.00%
- Median HH income
- $52,178
- Composite
- 36.77/100
- National rank
- #4571
- State rank
- #115 of 301 in IN
Livability — Whitestown
- Score
- 73/100
- State rank
- #109
- US rank
- #5691
Category grades
Schools grade is shown separately in the Schools card above.
Census & demographics
- Census place
- Whitestown, IN
- County
- Boone County · 69,822 people
- City population
- 9,509
- Metro
- Indianapolis-Carmel-Anderson, IN
- Population (ZIP)
- 9,509
- Household income
- $117,002
- Rent vs Own
- Severe rent burden
- 287.0
Population outlook (Boone County) Hauer SSP2
- Today (2025)
- 77,877 people
- By 2030
- 85,185 · +9.4%
- By 2040
- 99,753 · +28.1%
- By 2050
- 113,572 · +45.8%
- By 2075
- 145,674 · +87.1%
- By 2100
- 161,165 · +106.9%
Race, ethnicity, and origin ACS 2023
- Neighborhood character
- Predominantly White (84%)
- Race & ethnicity
- White 84% Two or more races 6% Asian 4% Hispanic / Latino 3% Black 3%
- Common ancestry
- Italian 4% Romanian 3% Slovak 2%
- Foreign-born
- 7% · Canada, China
- Languages at home
- 91% English-only · Other Indo-European 5% Spanish 2% Chinese 1%
Political lean MEDSL · Boone
- 2024 margin
- R (+16.0) · D 41.0% · R 57.0% · Other 2.0%
- 2008→2024 swing
- +9.8pp toward D · 2008: -25.8pp · 2024: -16.0pp
- All cycles
- 2024: R+16.0 2020: R+18.4 2016: R+29.5 2012: R+37.8 2008: R+25.8
Not yet ingested
- Civics
- —
Market trends
- HPI YoY
- ▼ -49.51%
- Current HPI
- 198.3353
- Rent YoY
- ▲ 0.77%
- Metro
- Indianapolis-Carmel-Anderson, IN
- State GDP YoY
- ▲ 2.90%
- F500 in state
- 18
Industry mix (Fortune 500 HQ in IN)
| Industry | F500 HQs | Revenue |
|---|---|---|
| Industrial Machinery | 2 | $37B |
|
||
| Healthcare | 1 | $177B |
|
||
| Pharmaceuticals | 1 | $45B |
|
||
| Metals / Steel | 1 | $18B |
|
||
| Agriculture | 1 | $17B |
|
||
| Packaging | 1 | $12B |
|
||
Price history
+95.2% since first listed12 events — show timeline
- 2026-04-06 Pending — MIBOR as Distributed by MLS Grid
- 2026-03-27 Relisted — MIBOR as Distributed by MLS Grid
- 2026-03-27 Price Changed $400,000 MIBOR as Distributed by MLS Grid
- 2025-11-18 Listing Removed — MIBOR as Distributed by MLS Grid
- 2025-10-13 Listed $425,000 MIBOR as Distributed by MLS Grid
- 2017-11-29 Sold (Public Records) $217,000 Public Records
- 2015-05-26 Sold (Public Records) $205,000 Public Records
- 2015-05-22 Sold (MLS) $205,000 MIBOR as Distributed by MLS Grid
- 2015-04-23 Contingent — MIBOR as Distributed by MLS Grid
- 2015-04-14 Listed $209,900 MIBOR as Distributed by MLS Grid
- 2013-10-01 Listing Removed — MIBOR as Distributed by MLS Grid
- 2013-03-21 Listed $204,900 MIBOR as Distributed by MLS Grid
Property tax history
+5.9%/yrLatest (2025): $4,012 · -5.3% YoY. Source: county tax records.
Cash-flow waterfall
monthlySold comps — $/sqft
last 12 mo · ≤1 miLoading sold comps…