 🏷️ Likely Rental
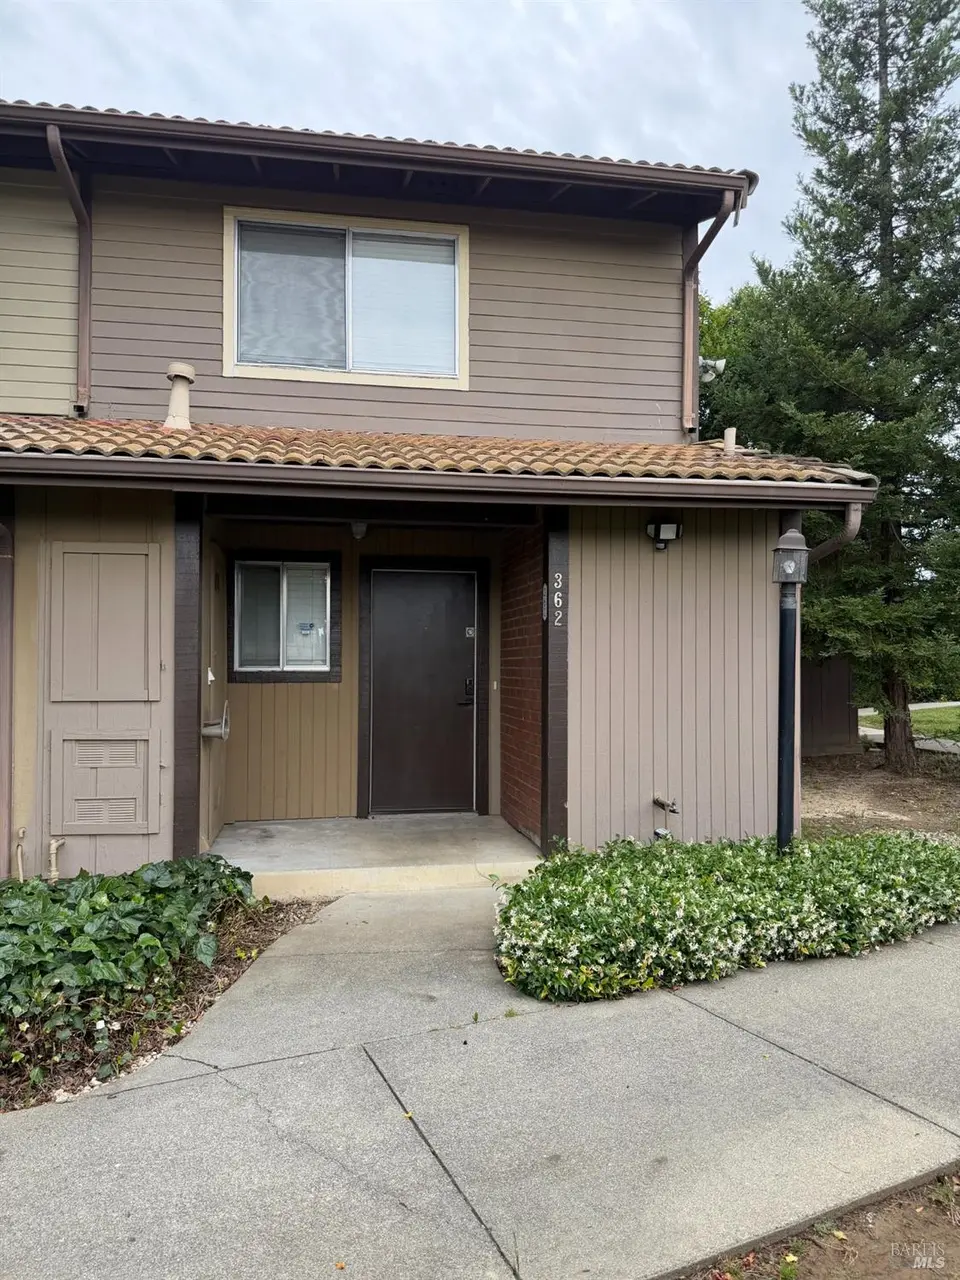
362 Tabor Ave · Fairfield, CA
Flood risk 3/10 · Minor
- FEMA flood zone
- X (unshaded)
- Chance of flooding over 30 yrs
- 0.2%
- Est. flood insurance / yr
- $507 – $1,088
Fire risk 3/10 · Minor
- Est. fire insurance / yr
- $659 – $1,223
Heat risk 6/10 · Moderate
- Hot days now (above 97°F)
- 7 days/yr
- Hot days in 30 yrs
- 14 days/yr
Wind risk 1/10 · Minimal
- Chance of severe wind over 30 yrs
- —
Air-quality risk 10/10 · Severe
- Unhealthy air days now
- 21 days/yr
- Unhealthy air days in 30 yrs
- 22 days/yr
Risk factors via First Street. Map © Google.
Why this score? — see what drove the D grade
The composite is a weighted blend of 9 inputs, each scored 0–100. Each bar is that input's sub-score; the figure is the points it added to the 100-point composite (weight × sub-score).
- Cash flow +15.0/30.0
- ARV discount +7.5/15.0
- 1% rule +5.0/10.0
- DSCR +5.0/10.0
- Schools +3.5/10.0
- Livability +3.4/5.0
- Rent growth +2.5/5.0
- Condition / age +2.5/5.0
- Appreciation +0.0/10.0
$2,600
🖨 Deal sheet 📄 Offer letter ✓ Due diligence
Listing remarks
Charming condominium for Rent! Discover your new home in this beautifully renovated townhouse, nestled in a friendly and quiet neighborhood. Enjoy the perfect balance of convenience and tranquility, with amenities just a short distance away but not too close to disrupt your peace. Features: All Appliances Included. This property comes fully equipped with essential appliances, including a refrigerator, dishwasher, washer, and dryer, making your move-in seamless. The outdoor space: Relax in the peaceful yard, ideal for summer barbecues or unwinding after a long day. Comfortable Living: Perfect for a family or individual seeking comfort and a sense of community. This lovely condominium is wait
Key facts
- Renovated townhouse
- Peaceful yard
- $100 HOA
Tags
Property features AI
Finance
- HOA & community: Homeowners association (monthly fee of $100) covering common areas; Association offers other shared amenities
Exterior
- Parking: Assigned parking; Garage with door opener; 1 garage space (2 total parking spaces)
- Utilities: Public sewer
- Home design: Residential condominium; Two stories; Main-level entry includes kitchen and living room
- Exterior features: Garden; Common facility pool; Private pool available; No spa; Does not allow horses
Interior
- Kitchen: Main-level kitchen
- Bedrooms: 2 bedrooms
- Bathrooms: 3 bathrooms (2 full, 1 partial)
- Heating & cooling: Central heating; Central cooling
- Interior features: Stone fireplace (1); No basement; Two-story layout
- Laundry & utility: Washer and dryer included, located inside the unit
Neighborhood map
What this means for you Summary
Snapshot
- This is a 2-bed/3.0-bath condo listed at $3k.
Deal economics
- At list price, monthly cash flow is $2k ($21k/yr) — positive.
- The deal already cash-flows at list — no discount required.
- Meets the 1% rule at list price ($2k rent vs $3k).
- Cap rate 814.1% vs local median 3.0% in Fairfield — top-decile yield for the area; either an underpriced asset or a hidden risk that comps aren't pricing in. Stress-test before assuming the spread holds.
Location & tenants
- Location reads 67/100 on livability (#314 in CA) — a middle-class / working-renter tenant base. Strengths: employment A+, housing A+, health & safety A+; Watch: schools C-, crime D-, commute F.
- Fairfield-Suisun Unified (urban): math 23% / reading 53% proficiency, ranked #238 of 517 in CA (top 46%) — families likely to look elsewhere, expect single-tenant / working-renter base with shorter leases.
- Market conditions: Rents flat; 264 active listings in the ZIP; 40 comparable units currently listed for rent nearby; rentals lingering (median 44d on market — plan ~5-8 weeks vacancy on turnover, expect pricing pressure); 58% of comp listings sitting > 30 days — soft ceiling on asking rent; solid renter incomes; 1,472 units permitted in Solano County in 2024 (131 in 5+ unit buildings).
- This rent runs 32% of the median local income ($87k/yr) — at the standard rent-burdened threshold; future hikes will face affordability resistance.
Forward outlook
- Local home prices are declining (-3.0%/yr); year-one equity from $18 of loan paydown is wiped out by about $78 of value loss. Plan a longer hold.
- Solano County population projected at +15% by 2050 — modest demand growth; plan on rents tracking national, not racing it.
- At projected returns (-3.0% appreciation + 0.1% rent growth), your $728 cash investment doubles in ~1 year — after that, you're playing with house money.
Negotiation context
- Only 4 days on market — expect competitive offers; lowballing is unlikely to land.
- 7 sale attempts since 5y ago with the ask held roughly flat each time — persistent listings suggest the price (not the market) is what's stuck; bring a comps-based counter.
Risks & watch-outs
- Climate carrying-cost: extreme-heat days projected 7→14/yr by 2055 (HVAC capex compounding) — expect insurance premiums to compound above CPI over the hold.
Questions for the listing agent
- What does the HOA fee cover, when was the last increase, and are there any pending special assessments or reserve-fund shortfalls?
- Any open or pending special assessments — roof, HVAC, plumbing, elevator, façade? What's the per-unit balance and payoff schedule, and is the seller paying it off at close or rolling it to the buyer?
- Is there a deadline driving the sale (1031 exchange, divorce, estate, relocation)? That informs how much negotiation room exists.
- Crime grade is D in this area — have there been break-ins, vandalism, or insurance claims at this property in the last 3 years? What carrier currently insures it and at what premium?
- The area grade is low — what's the realistic commute time and amenity access for the typical tenant pool here? Any planned neighborhood developments (good or bad) we should know about?
- What's the average days-on-market for RENTAL listings here right now (not sales)? A rising rental-DOM trend means longer vacancies and softer asking-rent achievability than the comps imply.
- What's the recent tenant-quality profile in this submarket — average credit score on applications, eviction rate, late-payment / NSF rate, and stable-employment percentage? A property-management company in the area should have these aggregated.
- How much new apartment / multifamily construction is in the pipeline within 1–3 miles? Heavy new supply (>2% of stock underway) typically softens rents 12–24 months out; light construction supports rent growth.
Investment metrics
- 1% rule
- 90.95% ✓
- Cap rate
- 814.07%
- Cash-on-cash
- 2884.93%
- DSCR
- 129.36
- GRM
- 0.1
CMA / ARV
- ARV (median comp)
- $329,375
- List price
- $2,600
- Delta
- 22.96%
- Verdict
- OVERPRICED
- Comps
- 20 within 1.0 mi
Projected returns pro-forma
-3.0% appreciation · 0.15% rent growth · sell at horizon
- IRR
- —
- Equity multiple
- 144.62×
- Total profit
- $104,553
- Equity at exit
- $388
- IRR
- —
- Equity multiple
- 288.66×
- Total profit
- $209,417
- Equity at exit
- $225
Cash invested: $728 (down + closing). Projections, not guarantees.
Landlord ↔ Tenant lean methodology
- Overall (STATE)
- 18 Strongly Tenant-Friendly
- State California
- 18 Strongly Tenant-Friendly · D+13
- County
- — inherits STATE
- City
- — inherits STATE
ZIP-level market 94533
- Rents YoY
- 0.1%
- Active inventory
- 264
- Price-to-rent
- 0.1×
Monthly cashflow live
- Estimated rent
- $2,365 high interval (Pro) →
- Mortgage (P&I)
- −$14
- Tax est. 1.5%
- −$3 /mo · $39/yr
- Insurance
- −$1
- HOA
- −$100
- Vacancy / Maint / Mgmt
- −$497
- Net cashflow
- $1,750
Break-even live
UW: 25.0% down · 7.5% · 30yr · 1.5% tax · 5.0% vac · 8.0% maint · 8.0% mgmt
Financing live
Cash to close
- Down payment
- $650
- Closing costs
- $78
- Reserves months
- —
- Total cash needed
- —
Loan-product check · same deal, 3 products live
Conventional
25% down · 7.5% · 30yr
- Down + closing
- —
- Monthly P&I
- —
- Monthly cashflow
- —
- DSCR
- —
- Eligible?
- —
Personal DTI + credit; lowest rate.
DSCR
20% down · 8.5% · 30yr
- Down + closing
- —
- Monthly P&I
- —
- Monthly cashflow
- —
- DSCR
- —
- Eligible?
- —
No personal income docs; deal must DSCR.
Hard money
10% down · 12.0% · 12mo
- Down + closing
- —
- Monthly P&I
- —
- Monthly cashflow
- —
- DSCR
- —
- Eligible?
- —
Short-term bridge; refi at stabilization.
Rent comps 40 comps
| Address | Beds | Baths | Sqft | Rent | $/sqft | DOM | Units | Dist |
|---|---|---|---|---|---|---|---|---|
| 362 Tabor Ave Fairfield, CA | 2.0 | 2.5 | 1269 | $2,500 | $1.97 | 23d | 1 | 0.04mi |
| 451 Tabor Ave Fairfield, CA | 2.0 | 2.5 | 1269 | $2,500 | $1.97 | 43d | 1 | 0.11mi |
| 101 Tabor Ave Unit A Fairfield, CA | 3.0 | 1.0 | 900 | $2,100 | $2.33 | 43d | 1 | 0.21mi |
| 2124 Santa Ana Dr Fairfield, CA | 2.0 | 1.0 | 1000 | $2,020 | $2.02 | 43d | 1 | 0.27mi |
| 195 E Pacific Ave Unit 19 Fairfield, CA | 2.0 | 2.0 | 1000 | $1,949 | $1.95 | 13d | 1 | 0.28mi |
| 2134 Union Ave Fairfield, CA | 2.0 | 1.0 | 950 | $2,395 | $2.52 | 43d | 1 | 0.37mi |
| 519 San Remo St Fairfield, CA | 3.0 | 2.0 | 1860 | $2,700 | $1.45 | 43d | 1 | 0.49mi |
| 2217 Santa Fe Ct Fairfield, CA | 3.0 | 2.0 | 1398 | $2,700 | $1.93 | 43d | 1 | 0.55mi |
| 1600 Travion Ct Fairfield, CA | 2.0 | 1.0 | 837 | $1,950 | $2.33 | 43d | 3 | 0.56mi |
| 708 E Tabor Ave Unit 76612 Fairfield, CA | 2.0 | 1.0 | 950 | $1,750 | $1.84 | 43d | 1 | 0.59mi |
| 1890 Dover Ave Fairfield, CA | 1.0–2.0 | 1.0–2.0 | 835 | $1,995 | $2.39 | 13d | 2 | 0.60mi |
| 287 Camellia St Fairfield, CA | 3.0 | 2.0 | 1750 | $2,950 | $1.69 | 13d | 1 | 0.69mi |
| 766 E Tabor Ave Unit 12 Fairfield, CA | 2.0 | 1.0 | 950 | $1,750 | $1.84 | 43d | 1 | 0.71mi |
| 53 El Basset Ct Fairfield, CA | 2.0 | 1.5 | 997 | $2,100 | $2.11 | 13d | 1 | 0.76mi |
| 1206 Dana Dr Unit 02 Fairfield, CA | 2.0 | 1.5 | 1100 | $1,925 | $1.75 | 43d | 1 | 0.76mi |
| 713 E Travis Blvd Fairfield, CA | 1.0–2.0 | 1.0–1.5 | 827 | $2,277 | $2.75 | 43d | 1 | 0.78mi |
| 1240 Dana Dr Fairfield, CA | 2.0 | 2.0 | 950 | $1,800 | $1.89 | 43d | 1 | 0.80mi |
| 1111 Alaska Ave Fairfield, CA | 1.0–2.0 | 1.0 | 787 | $2,249 | $2.86 | 13d | 10 | 0.80mi |
| 145 Del Rey Ct Fairfield, CA | 3.0 | 1.5 | 1164 | $2,500 | $2.15 | 13d | 1 | 0.86mi |
| 849 Finch Way Fairfield, CA | 3.0 | 2.0 | 1300 | $2,895 | $2.23 | 44d | 1 | 0.86mi |
| 849 Finch Way Fairfield, CA | 3.0 | 2.0 | 1300 | $2,895 | $2.23 | 43d | 1 | 0.86mi |
| 2308 Pennsylvania Ave Fairfield, CA | 2.0 | 1.0 | 1852 | $2,395 | $1.29 | 43d | 1 | 0.91mi |
| 1777 Daniel Ct Fairfield, CA | 3.0 | 2.5 | 1600 | $2,955 | $1.85 | 23d | 1 | 0.93mi |
| 824 Taft St Fairfield, CA | 3.0 | 1.0 | 1200 | $2,600 | $2.17 | 13d | 1 | 0.94mi |
| 2578 Pembrook Way Fairfield, CA | 3.0 | 2.0 | 1130 | $2,650 | $2.35 | 43d | 1 | 1.00mi |
| 1037 Mockingbird Ln Fairfield, CA | 3.0 | 2.0 | 1476 | $2,695 | $1.83 | 43d | 1 | 1.04mi |
| 100 Hawthorn Dr Fairfield, CA | 1.0–2.0 | 1.0 | 726 | $2,249 | $3.10 | 13d | 11 | 1.08mi |
| 1349 Blossom Ave Fairfield, CA | 1.0–3.0 | 1.0–3.0 | 1017 | $2,795 | $2.75 | 1d | 11 | 1.18mi |
| 2543 Hastings Way Fairfield, CA | 3.0 | 2.0 | 1603 | $3,019 | $1.88 | 43d | 1 | 1.22mi |
| 1930 Manor Pl Unit 1 Fairfield, CA | 2.0 | 1.5 | 1100 | $2,150 | $1.95 | 21d | 1 | 1.23mi |
| 2800 Dover Ave Unit G6 Fairfield, CA | 2.0 | 1.0 | 950 | $2,095 | $2.21 | 23d | 1 | 1.24mi |
| 2542 Vista Grande Fairfield, CA | 3.0 | 2.5 | 1712 | $2,850 | $1.66 | 43d | 1 | 1.25mi |
| 1955 Grande Cir Unit U Fairfield, CA | 2.0 | 1.5 | 964 | $1,800 | $1.87 | 43d | 1 | 1.26mi |
| 1955 Grande Cir Unit U Fairfield, CA | 2.0 | 1.5 | 964 | $1,800 | $1.87 | 13d | 1 | 1.26mi |
| 1960 Grande Cir #42 Fairfield, CA | 3.0 | 1.5 | 1176 | $2,500 | $2.13 | 43d | 1 | 1.30mi |
| 1970 Grande Cir #19 Fairfield, CA | 2.0 | 1.5 | 1095 | $2,200 | $2.01 | 23d | 1 | 1.32mi |
| 2550 Hilborn Rd Fairfield, CA | 1.0–2.0 | 1.0–2.0 | 870 | $2,563 | $2.95 | 13d | 16 | 1.32mi |
| 233 Marina Blvd Suisun City, CA | 2.0–3.0 | 1.0 | 815 | $2,014 | $2.47 | 43d | 1 | 1.33mi |
| 1990 Grande Cir Fairfield, CA | 2.0 | 1.0–1.5 | 895 | $2,135 | $2.39 | 3d | 15 | 1.33mi |
| 319 Flagstone Cir Suisun City, CA | 3.0 | 3.0 | 1366 | $3,400 | $2.49 | 43d | 1 | 1.34mi |
HOA detail condo
- Monthly dues
- $100 · $1,200/yr
- Assessments
- None detected in remarks — confirm with the listing agent.
Listing history 20 events
-
2026-06-18days on market $2,600 Active 4 DOM
-
2026-06-17days on market $2,600 Active 3 DOM
-
2026-06-16days on market $2,600 Active 2 DOM
-
2026-06-15remarks 699-char remark
-
2026-06-15pricedays on market $2,600 Active 1 DOM
-
2026-05-06$405,000 Active 151-char remark
-
2026-04-19$2,500
-
2024-06-27historical $2,400
-
2024-06-20price $2,400
-
2024-05-31price $2,700
-
2024-05-21$2,800
-
2024-01-28price $408,000
-
2023-12-12$420,000 Active
-
2021-11-05soldstatus $361,000
-
2021-10-15soldstatus $360,800 Sold
-
2021-09-18status Pending
-
2021-09-07$360,000 New
-
2005-06-30soldstatus $5,580,000
-
1999-09-07soldstatus $2,250,000
-
1988-07-05soldstatus $1,845,000
ⓘ Source: listings_history table (triggers on properties + properties_extension) + one-shot
backfill from property_details.listing_events for pre-trigger history.
Climate risk First Street
- Flood 3/10 Moderate FEMA zone X (unshaded) · 20% chance over 30 yrs
- Wildfire 3/10 Moderate
- Heat 6/10 Major 7 d/yr ≥97°F today · 14 d/yr by 30 yrs out
- Wind 1/10 Low
- Air quality 10/10 Extreme 21 unhealthy d/yr today · 22 by 30 yrs out
Nearby sold comps map
Loading sold comps map…
Walkable amenities ~0.75 mi
Loading nearby amenities…
Taxation est. · year 1
- Rental income
- $28,377
- − Mortgage interest
- −$146
- − Property taxes
- −$39
- − Insurance
- −$13
- − Repairs & maintenance
- −$2,270
- − Management
- −$2,270
- − HOA
- −$1,200
- − Depreciation
- −$76
- Taxable income
- $22,364
- Est. tax owed @ 24.0%
- −$5,367
- After-tax cash flow
- $15,635/yr
For passive investors: Depreciation is non-cash, so a rental often shows a tax loss while cash-flowing — sheltering income. Rental losses are passive: they offset passive income freely, and up to $25,000/yr can offset ordinary (W-2) income if you actively participate and your MAGI is under $100k (phasing out to $0 by $150k); unused losses carry forward. On sale, claimed depreciation is recaptured at up to 25%, and gains may owe capital-gains tax (a 1031 exchange can defer both). Figures are a year-1 estimate at your 24.0% rate — not tax advice; consult a CPA.
Schools (NCES district)
- District
- Fairfield-Suisun Unified
- NCES district ID
- 0613360
- Math proficiency
- 23% ▼ -10.00%
- Reading proficiency
- 53% ▲ 8.00%
- Median HH income
- $69,654
- Composite
- 34.59/100
- National rank
- #5157
- State rank
- #238 of 517 in CA
Livability — Fairfield
- Score
- 67/100
- State rank
- #314
- US rank
- #10551
Category grades
Schools grade is shown separately in the Schools card above.
Census & demographics
- Census place
- Fairfield, CA
- County
- Solano County · 433,239 people
- City population
- 120,008
- Metro
- Vallejo, CA
- Population (ZIP)
- 78,805
- Household income
- $87,384
- Rent vs Own
- Severe rent burden
- 3474.0
Population outlook (Solano County) Hauer SSP2
- Today (2025)
- 478,685 people
- By 2030
- 497,974 · +4.0%
- By 2040
- 528,515 · +10.4%
- By 2050
- 549,115 · +14.7%
- By 2075
- 587,229 · +22.7%
- By 2100
- 571,378 · +19.4%
Race, ethnicity, and origin ACS 2023
- Neighborhood character
- Highly diverse neighborhood (Simpson 0.75)
- Race & ethnicity
- Hispanic / Latino 39% White 23% Black 16% Two or more races 16% Asian 14% Pacific Islander 1%
- Hispanic origin (detail)
- Mexican 34%
- Common ancestry
- Italian 5% Lithuanian 1% Slovak 1%
- Foreign-born
- 26% · Canada, Vietnam, China
- Languages at home
- 59% English-only · Spanish 28% Tagalog/Filipino 6% Other Indo-European 2%
Political lean MEDSL · Solano
- 2024 margin
- Strong D (+23.0) · D 60.0% · R 37.1% · Other 2.9%
- 2008→2024 swing
- -5.6pp toward R · 2008: 28.6pp · 2024: 23.0pp
- All cycles
- 2024: D+23.0 2020: D+30.3 2016: D+30.5 2012: D+28.1 2008: D+28.6
Not yet ingested
- Civics
- —
Market trends
- HPI YoY
- ▼ -258.88%
- Current HPI
- 285.4365
- Rent YoY
- ▲ 0.15%
- Metro
- Vallejo, CA
- State GDP YoY
- ▲ 3.21%
- F500 in state
- 116
Industry mix (Fortune 500 HQ in CA)
| Industry | F500 HQs | Revenue |
|---|---|---|
| Technology | 27 | $1,492B |
|
||
| Financial Services | 3 | $174B |
|
||
| Retail | 3 | $44B |
|
||
| Insurance | 3 | $26B |
|
||
| Media / Entertainment | 2 | $115B |
|
||
| Pharmaceuticals / Biotech | 2 | $62B |
|
||
Price history
-99.9% since first listed19 events — show timeline
- 2026-06-17 Listed for Rent $2,600 TURBOTENANT
- 2026-06-15 Price Changed $2,600 BAREIS
- 2026-06-14 Listed $2,600,000 BAREIS
- 2026-06-04 Rental Removed $2,500 APPFOLIO
- 2026-05-06 Listed $405,000 BAREIS
- 2026-04-19 Listed for Rent $2,500 APPFOLIO
- 2024-06-27 Rental Removed $2,400 APPFOLIO
- 2024-06-20 Price Changed $2,400 APPFOLIO
- 2024-05-31 Price Changed $2,700 APPFOLIO
- 2024-05-21 Listed for Rent $2,800 APPFOLIO
- 2024-01-28 Price Changed $408,000 BAREIS
- 2023-12-12 Listed $420,000 BAREIS
- 2021-11-05 Sold (Public Records) $361,000 Public Records
- 2021-10-15 Sold (MLS) $360,800 bridgeMLS, Bay East AOR, or Contra Costa AOR
- 2021-09-18 Pending — bridgeMLS, Bay East AOR, or Contra Costa AOR
- 2021-09-07 Listed $360,000 bridgeMLS, Bay East AOR, or Contra Costa AOR
- 2005-06-30 Sold (Public Records) $5,580,000 Public Records
- 1999-09-07 Sold (Public Records) $2,250,000 Public Records
- 1988-07-05 Sold (Public Records) $1,845,000 Public Records
Property tax history
+3.2%/yrLatest (2025): $4,205 · +0.0% YoY. Source: county tax records.
Cash-flow waterfall
monthlySold comps — $/sqft
last 12 mo · ≤1 miLoading sold comps…