 🏗️ New Construction
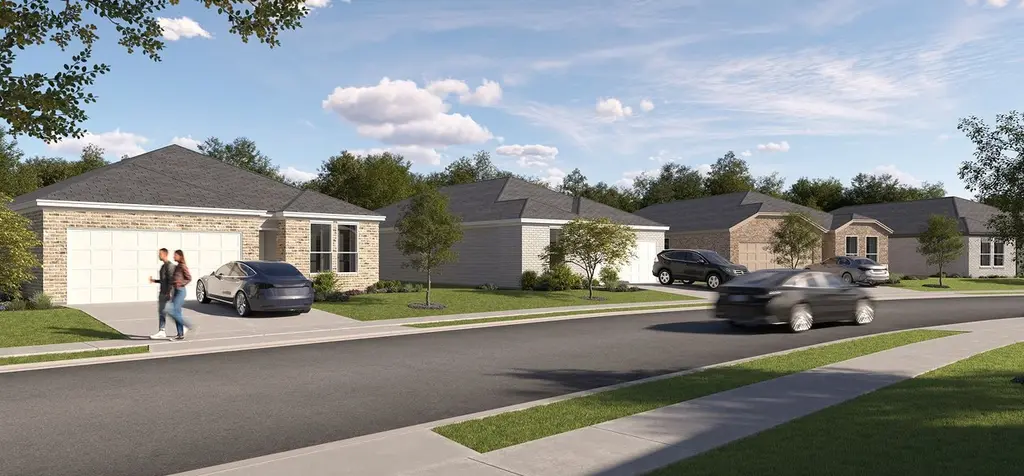
Canon Plan · San Antonio, TX
Flood risk No data
- FEMA flood zone
- —
- Chance of flooding over 30 yrs
- —
- Est. flood insurance / yr
- —
Fire risk No data
- Est. fire insurance / yr
- —
Heat risk No data
- Hot days now (above threshold)
- —
- Hot days in 30 yrs
- —
Wind risk No data
- Chance of severe wind over 30 yrs
- —
Air-quality risk No data
- Unhealthy air days now
- —
- Unhealthy air days in 30 yrs
- —
Risk factors via First Street. Map © Google.
Why this score? — see what drove the F grade
The composite is a weighted blend of 9 inputs, each scored 0–100. Each bar is that input's sub-score; the figure is the points it added to the 100-point composite (weight × sub-score).
- ARV discount +7.5/15.0
- Livability +4.0/5.0
- Schools +3.8/10.0
- Cash flow +2.2/30.0
- Rent growth +1.7/5.0
- Condition / age +1.0/5.0
- 1% rule +0.0/10.0
- DSCR +0.0/10.0
- Appreciation +0.0/10.0
$313,999
🖨 Deal sheet (PDF) 📄 Offer letter ✓ Due diligence
Listing remarks MLS
The Coastline Collection is a new series of single-family homes in the Grace Gardens masterplan in San Antonio, TX, offering affordable new home options with a variety of floorplan designs. Residents will enjoy proximity to Loop 410 for easy access to local shopping, dining and entertainment options. Outdoor recreation is a short drive away on Calaveras Lake, and the community is located near Brooks City Base, perfect for military families and personnel.
Key facts
- Outdoor recreation
- Calaveras lake
- 2 garage spots
Tags
Neighborhood map
What this means for you Summary
Snapshot
- This is a 5-bed/3.0-bath single-family listed at $314k. Condition is rated poor.
Deal economics
- At list price, monthly cash flow is $-2k ($-25k/yr) — negative.
- To cash-flow at today's rent, offer at most $275k (12.4% below list).
- To meet the 1% rule (rent ≥ 1% of price), the offer needs to be $241k (23.4% below list).
- Recommended offer: $241k (23.4% below list) — sets the bar for 1% rule.
- Cap rate 2.0% vs local median 3.8% in San Antonio — below-typical yield; the buyer is paying a premium for something (appreciation thesis, condition, location) that the cap rate doesn't capture.
Location & tenants
- Location reads 80/100 on livability (#31 in TX, #1,616 nationally) — a professional / high-income tenant draw. Strengths: amenities A+, commute A+, cost of living A+; Watch: crime F.
- North East ISD (urban): math 38% / reading 49% proficiency, ranked #276 of 826 in TX (top 33%) — families likely to look elsewhere, expect single-tenant / working-renter base with shorter leases.
- Zoned schools: Oak Grove El (math 17% / reading 37%, grade F, #2,791 of 4,322 statewide, top 68%, 389 students, 88% FRL); Garner Middle (math 17% / reading 30%, grade F, #1,317 of 1,662 statewide, top 80%, 804 students, 83% FRL); Macarthur H S (math 31% / reading 51%, grade F, #774 of 1,632 statewide, top 49%, 2,055 students, 58% FRL) — zoned schools average 77% FRL vs 41% district-wide (35 pts higher); higher-poverty schools than district average — tighter screening recommended.
- Zoned-school proficiency averages 30% at this address vs 44% district-wide (-13 pts) — the specific schools serving this property underperform the North East ISD average; the district grade overstates school quality for this exact location.
- Market conditions: Rents falling (-3.4%/yr); 344 active listings in the ZIP; 4 comparable units currently listed for rent nearby; rentals leasing fast (median 7d on market — plan ~1-2 weeks tenant-placement turnaround); 8,308 units permitted in Bexar County in 2024 (2,506 in 5+ unit buildings).
- At $2,406/mo this rent would consume 55% of the median local household income ($52k/yr) (locally 2809% of renters already pay >50% of income on rent) — very limited rent-growth headroom before tenants either downsize or default.
Forward outlook
- Local home prices are declining (-3.0%/yr); year-one equity from $4k of loan paydown is wiped out by about $17k of value loss. Plan a longer hold.
- Bexar County population projected at +50% by 2050 — long-run rental-demand tailwind backs the buy-and-hold thesis.
Negotiation context
- It's been on market 122 days — a 12% lower offer ($276k) is reasonable based on typical stale-listing flexibility.
Risks & watch-outs
- Watch-outs: property tax is 2.8% of price.
Questions for the listing agent
- What do current leases actually rent for vs. the listed asking? Can we see a recent rent roll and the last 12 months of T-12 income?
- It's been on market 122 days. Have you received any prior offers? Is the seller open to a 23% concession, seller financing, or rate buy-down credit?
- Have any recent inspections been done? Can we get a copy of the seller's disclosures and any deferred-maintenance estimates?
- Property tax is high relative to price — has the assessment been appealed recently, and will the sale trigger a re-assessment?
- Why hasn't it sold? Are there any deal-killer items the seller is aware of (foundation, flood, title, zoning, code violations)?
- Is there a deadline driving the sale (1031 exchange, divorce, estate, relocation)? That informs how much negotiation room exists.
- Crime grade is F in this area — have there been break-ins, vandalism, or insurance claims at this property in the last 3 years? What carrier currently insures it and at what premium?
- The area grade is low — what's the realistic commute time and amenity access for the typical tenant pool here? Any planned neighborhood developments (good or bad) we should know about?
- What's the average days-on-market for RENTAL listings here right now (not sales)? A rising rental-DOM trend means longer vacancies and softer asking-rent achievability than the comps imply.
- What's the recent tenant-quality profile in this submarket — average credit score on applications, eviction rate, late-payment / NSF rate, and stable-employment percentage? A property-management company in the area should have these aggregated.
- How much new for-sale + rental construction is in the pipeline within 1–3 miles? Heavy new supply typically softens prices + rents 12–24 months out; constrained supply supports both.
Investment metrics
- 1% rule
- 0.42% ✗
- Cap rate
- 1.96%
- Cash-on-cash
- -15.49%
- DSCR
- 0.31
- GRM
- 20.0
CMA / ARV
- ARV (median comp)
- $576,478
- List price
- $313,999
- Delta
- -45.53%
- Verdict
- UNDERPRICED
- Comps
- 20 within 1.0 mi
Show comp detail 9 sales within ~0.75 mi
| Address | Dist | Beds/Ba | Sqft | Sold | Price | $/sf | Match |
|---|---|---|---|---|---|---|---|
| 443 Laramie | 0.49mi | 4/3.0 (-1) | 2,873 (+2%) | 6mo | $750,000 | $261 | 64 |
| 1511 Haskin Dr | 0.66mi | 4/3.0 (-1) | 2,772 (-1%) | 2mo | $775,000 | $280 | 60 |
| 622 Wyndale St | 0.39mi | 4/3.0 (-1) | 2,981 (+6%) | 16mo | $665,000 | $223 | 53 |
| 8731 Oak Ledge | 0.55mi | 4/3.0 (-1) | 2,618 (-7%) | 10mo | $450,000 | $172 | 50 |
| 315 Royal Oaks | 0.37mi | 4/2.5 (-1) | 2,412 (-14%) | 3mo | $579,999 | $240 | 50 |
| 9319 Oak Ledge | 0.58mi | 4/4.0 (-1) | 2,982 (+6%) | 8mo | $650,000 | $218 | 47 |
| 647 Cave Ln | 0.55mi | 4/3.0 (-1) | 2,412 (-14%) | 1mo | $550,000 | $228 | 45 |
| 8306 Country Side | 0.74mi | 5/3.5 | 3,001 (+7%) | 12mo | $1,199,990 | $400 | 42 |
| 218 Laramie Dr | 0.64mi | 4/3.5 (-1) | 2,843 (+1%) | 24mo | $789,000 | $278 | 42 |
Match score weights: distance 35% · size 25% · config 20% · recency 20%. Top-matched comps best support the ARV.
Projected returns pro-forma
-3.0% appreciation · 0.0% rent growth · sell at horizon
- IRR
- -49.3%
- Equity multiple
- -0.44×
- Total profit
- $-233,113
- Equity at exit
- $85,955
- IRR
- —
- Equity multiple
- -1.48×
- Total profit
- $-400,943
- Equity at exit
- $49,843
Cash invested: $161,414 (down + closing). Projections, not guarantees.
Landlord ↔ Tenant lean methodology
- Overall (STATE)
- 87 Strongly Landlord-Friendly
- State Texas
- 87 Strongly Landlord-Friendly · R+5
- County
- — inherits STATE
- City
- — inherits STATE
ZIP-level market 78223
- Home prices YoY
- -16.4%
- Rents YoY
- -3.4%
- Active inventory
- 344
- Price-to-rent
- 10.9×
Monthly cashflow live
- Estimated rent
- $2,406 medium interval (Pro) →
- Mortgage (P&I)
- −$3,023
- Tax est. 1.5%
- −$721 /mo · $8,647/yr
- Insurance
- −$240
- HOA
- −$0
- Lot rent
- −$0
- Vacancy / Maint / Mgmt
- −$505
- Net cashflow
- $-2,083
Break-even live
Sensitivity live
| Price | -10% $-1,685 | -5% $-1,884 | +0% $-2,083 | +5% $-2,282 | +10% $-2,482 |
|---|---|---|---|---|---|
| Rent | -10% $-2,273 | -5% $-2,178 | +0% $-2,083 | +5% $-1,988 | +10% $-1,893 |
| Rate | -1.0pp $-1,793 | -0.5pp $-1,937 | base $-2,083 | +0.5pp $-2,233 | +1.0pp $-2,385 |
UW: 25.0% down · 7.5% · 30yr · 1.5% tax · 5.0% vac · 8.0% maint · 8.0% mgmt
Financing live
Cash to close
- Down payment
- $144,119
- Closing costs
- $17,294
- Reserves months
- —
- Total cash needed
- —
Loan-product check · same deal, 3 products live
Conventional
25% down · 7.5% · 30yr
- Down + closing
- —
- Monthly P&I
- —
- Monthly cashflow
- —
- DSCR
- —
- Eligible?
- —
Personal DTI + credit; lowest rate.
DSCR
20% down · 8.5% · 30yr
- Down + closing
- —
- Monthly P&I
- —
- Monthly cashflow
- —
- DSCR
- —
- Eligible?
- —
No personal income docs; deal must DSCR.
Hard money
10% down · 12.0% · 12mo
- Down + closing
- —
- Monthly P&I
- —
- Monthly cashflow
- —
- DSCR
- —
- Eligible?
- —
Short-term bridge; refi at stabilization.
Rent comps 4 comps
| Address | Beds | Baths | Sqft | Rent | $/sqft | DOM | Units | Dist |
|---|---|---|---|---|---|---|---|---|
| 3206 Albin Dr San Antonio, TX | 4.0 | 2.5 | 2445 | $3,500 | $1.43 | 0d | 1 | 1.23mi |
| 8227 Campobello Dr San Antonio, TX | 5.0 | 2.0 | 2180 | $2,100 | $0.96 | 5d | 1 | 1.27mi |
| 4035 Barrington St San Antonio, TX | 4.0 | 4.5 | 2078 | $2,000 | $0.96 | 7d | 1 | 1.36mi |
| 2904 Knight Robin Dr San Antonio, TX | 5.0 | 3.5 | 2780 | $2,250 | $0.81 | 10d | 1 | 1.46mi |
Listing history 22 events
-
2026-06-22days on market $313,999 Active 122 DOM
-
2026-06-21pricedays on market $313,999 Active 121 DOM
-
2026-06-18price $313,499 Active 118 DOM
-
2026-06-18days on market $312,999 Active 118 DOM
-
2026-06-17days on market $312,999 Active 117 DOM
-
2026-06-16days on market $312,999 Active 116 DOM
-
2026-06-13pricedays on market $312,999 Active 113 DOM
-
2026-06-13pricedays on market $312,499 Active 112 DOM
-
2026-06-10price $311,499 Active 109 DOM
-
2026-06-09days on market $310,999 Active 109 DOM
-
2026-06-08days on market $310,999 Active 108 DOM
-
2026-06-08price $310,999 Active 107 DOM
-
2026-06-07days on market $310,499 Active 107 DOM
-
2026-06-04days on market $310,499 Active 104 DOM
-
2026-06-03days on market $310,499 Active 103 DOM
-
2026-06-02pricedays on market $310,499 Active 102 DOM
-
2026-06-01days on market $309,999 Active 101 DOM
-
2026-05-31days on market $309,999 Active 100 DOM
-
2026-05-12price $309,999 458-char remark
Show marketing remark (458 chars)
The Coastline Collection is a new series of single-family homes in the Grace Gardens masterplan in San Antonio, TX, offering affordable new home options with a variety of floorplan designs. Residents will enjoy proximity to Loop 410 for easy access to local shopping, dining and entertainment options. Outdoor recreation is a short drive away on Calaveras Lake, and the community is located near Brooks City Base, perfect for military families and personnel.
-
2026-05-08price $312,999 458-char remark
Show marketing remark (458 chars)
The Coastline Collection is a new series of single-family homes in the Grace Gardens masterplan in San Antonio, TX, offering affordable new home options with a variety of floorplan designs. Residents will enjoy proximity to Loop 410 for easy access to local shopping, dining and entertainment options. Outdoor recreation is a short drive away on Calaveras Lake, and the community is located near Brooks City Base, perfect for military families and personnel.
-
2026-05-05price $314,999 458-char remark
Show marketing remark (458 chars)
The Coastline Collection is a new series of single-family homes in the Grace Gardens masterplan in San Antonio, TX, offering affordable new home options with a variety of floorplan designs. Residents will enjoy proximity to Loop 410 for easy access to local shopping, dining and entertainment options. Outdoor recreation is a short drive away on Calaveras Lake, and the community is located near Brooks City Base, perfect for military families and personnel.
-
2026-02-20$318,999 Active 458-char remark
Show marketing remark (458 chars)
The Coastline Collection is a new series of single-family homes in the Grace Gardens masterplan in San Antonio, TX, offering affordable new home options with a variety of floorplan designs. Residents will enjoy proximity to Loop 410 for easy access to local shopping, dining and entertainment options. Outdoor recreation is a short drive away on Calaveras Lake, and the community is located near Brooks City Base, perfect for military families and personnel.
ⓘ Source: listings_history table (triggers on properties + properties_extension) + one-shot
backfill from property_details.listing_events for pre-trigger history.
Nearby sold comps map
Loading sold comps map…
Walkable amenities ~0.75 mi
Loading nearby amenities…
Taxation est. · year 1
- Rental income
- $28,871
- − Mortgage interest
- −$32,292
- − Property taxes
- −$8,647
- − Insurance
- −$2,882
- − Repairs & maintenance
- −$2,310
- − Management
- −$2,310
- − Depreciation
- −$16,770
- Taxable loss
- −$36,340
- Est. tax savings @ 24.0%
- +$8,722
- After-tax cash flow
- $-16,277/yr
For passive investors: Depreciation is non-cash, so a rental often shows a tax loss while cash-flowing — sheltering income. Rental losses are passive: they offset passive income freely, and up to $25,000/yr can offset ordinary (W-2) income if you actively participate and your MAGI is under $100k (phasing out to $0 by $150k); unused losses carry forward. On sale, claimed depreciation is recaptured at up to 25%, and gains may owe capital-gains tax (a 1031 exchange can defer both). Figures are a year-1 estimate at your 24.0% rate — not tax advice; consult a CPA.
Condition & rehab AI · 1 photo
This home requires extensive repairs and maintenance, including major work on the exterior siding, roof, flooring, and interior painting. Significant improvements in these areas will substantially increase its resale and rental value.
Repairs flagged
- Major exterior siding — Severe damage and peeling suggest extensive replacement is needed.
- Major roof — Missing shingles and general wear indicate a full roof replacement is required.
- Major flooring — Worn carpet and visible wear suggest replacement is necessary.
- Major interior walls/paint — Peeling paint and discoloration indicate significant repainting is needed.
- Major HVAC/mechanicals — The overall condition suggests potential issues that need inspection and replacement.
- Major landscaping — Sparse and unmaintained landscaping requires significant improvement to enhance curb appeal.
Value-add opportunities
- Both exterior siding and roof replacement — Both repairs are critical for safety and appearance, significantly increasing both resale and rental value.
- Both flooring replacement — New flooring will improve the home's aesthetic and functionality, enhancing both resale and rental appeal.
- Both interior painting — Fresh paint will improve the home's appearance and appeal to potential buyers or renters.
- Both HVAC inspection and potential replacement — A functional HVAC system is essential for comfort and energy efficiency, impacting both resale and rental value.
- Both landscaping and curb appeal improvements — A well-maintained exterior enhances the home's curb appeal and can attract more interest from potential buyers or renters.
Renovation cost estimate screening
| Repair item | Severity | Est. cost |
|---|---|---|
| exterior siding · Severe damage and peeling suggest extensive replacement is needed. | Major | $15,000–50,000 |
| roof · Missing shingles and general wear indicate a full roof replacement is required. | Major | $15,000–50,000 |
| flooring · Worn carpet and visible wear suggest replacement is necessary. | Major | $15,000–50,000 |
| interior walls/paint · Peeling paint and discoloration indicate significant repainting is needed. | Major | $15,000–50,000 |
| HVAC/mechanicals · The overall condition suggests potential issues that need inspection and replacement. | Major | $15,000–50,000 |
| landscaping · Sparse and unmaintained landscaping requires significant improvement to enhance curb appeal. | Major | $15,000–50,000 |
| Total estimated repair cost · 6 items | $90,000–300,000 |
Value-add ROI direction
- Both exterior siding and roof replacement — Both repairs are critical for safety and appearance, significantly increasing both resale and rental value. ↑
- Both flooring replacement — New flooring will improve the home's aesthetic and functionality, enhancing both resale and rental appeal. ↑
- Both interior painting — Fresh paint will improve the home's appearance and appeal to potential buyers or renters. ↑
- Both HVAC inspection and potential replacement — A functional HVAC system is essential for comfort and energy efficiency, impacting both resale and rental value. ↑
- Both landscaping and curb appeal improvements — A well-maintained exterior enhances the home's curb appeal and can attract more interest from potential buyers or renters. ↑
ⓘ Cost ranges are severity-bucket heuristics (US national rule-of-thumb). Get contractor quotes + a written scope before underwriting a rehab budget.
Schools (NCES district)
- District
- North East ISD
- NCES district ID
- 4832940
- Math proficiency
- 38% ▼ -14.00%
- Reading proficiency
- 49% ▼ -4.00%
- Median HH income
- $57,715
- Composite
- 38.1/100
- National rank
- #4276
- State rank
- #276 of 826 in TX
Livability — San Antonio
- Score
- 80/100
- State rank
- #31
- US rank
- #1616
Category grades
Schools grade is shown separately in the Schools card above.
Census & demographics
- Census place
- San Antonio, TX
- County
- Bexar County · 1,990,555 people
- City population
- 1,806,925
- Metro
- San Antonio-New Braunfels, TX
- Population (ZIP)
- 58,983
- Household income
- $52,088
- Rent vs Own
- Severe rent burden
- 2809.0
Population outlook (Bexar County) Hauer SSP2
- Today (2025)
- 2,336,851 people
- By 2030
- 2,560,728 · +9.6%
- By 2040
- 3,020,569 · +29.3%
- By 2050
- 3,493,522 · +49.5%
- By 2075
- 4,668,459 · +99.8%
- By 2100
- 5,533,242 · +136.8%
Race, ethnicity, and origin ACS 2023
- Neighborhood character
- Predominantly Hispanic (76%)
- Race & ethnicity
- Hispanic / Latino 76% Two or more races 28% White 16% Black 5% Asian 2% Native American 1%
- Hispanic origin (detail)
- Mexican 67%
- Common ancestry
- Lithuanian 2% Romanian 1% Slovak 1%
- Foreign-born
- 10% · Canada, Vietnam
- Languages at home
- 63% English-only · Spanish 36%
Political lean MEDSL · Bexar
- 2024 margin
- Lean D (+9.8) · D 54.3% · R 44.6% · Other 1.1%
- 2008→2024 swing
- +4.2pp toward D · 2008: 5.6pp · 2024: 9.8pp
- All cycles
- 2024: D+9.8 2020: D+18.2 2016: D+13.5 2012: D+4.6 2008: D+5.6
Not yet ingested
- Civics
- —
Market trends
- HPI YoY
- ▼ -52.06%
- Current HPI
- 265.2235
- Rent YoY
- ▼ -3.36%
- Metro
- San Antonio-New Braunfels, TX
- State GDP YoY
- ▲ 3.95%
- F500 in state
- 110
Industry mix (Fortune 500 HQ in TX)
| Industry | F500 HQs | Revenue |
|---|---|---|
| Energy | 16 | $1,198B |
|
||
| Technology | 5 | $198B |
|
||
| Engineering / Construction | 4 | $72B |
|
||
| Energy Services | 3 | $60B |
|
||
| Utilities | 3 | $41B |
|
||
| Healthcare | 2 | $330B |
|
||
Price history
-2.8% since first listed4 events — show timeline
- 2026-05-12 Price Changed $309,999 Zillow
- 2026-05-08 Price Changed $312,999 Zillow
- 2026-05-05 Price Changed $314,999 Zillow
- 2026-02-20 Listed $318,999 Zillow
Cash-flow waterfall
monthlySold comps — $/sqft
last 12 mo · ≤1 miLoading sold comps…