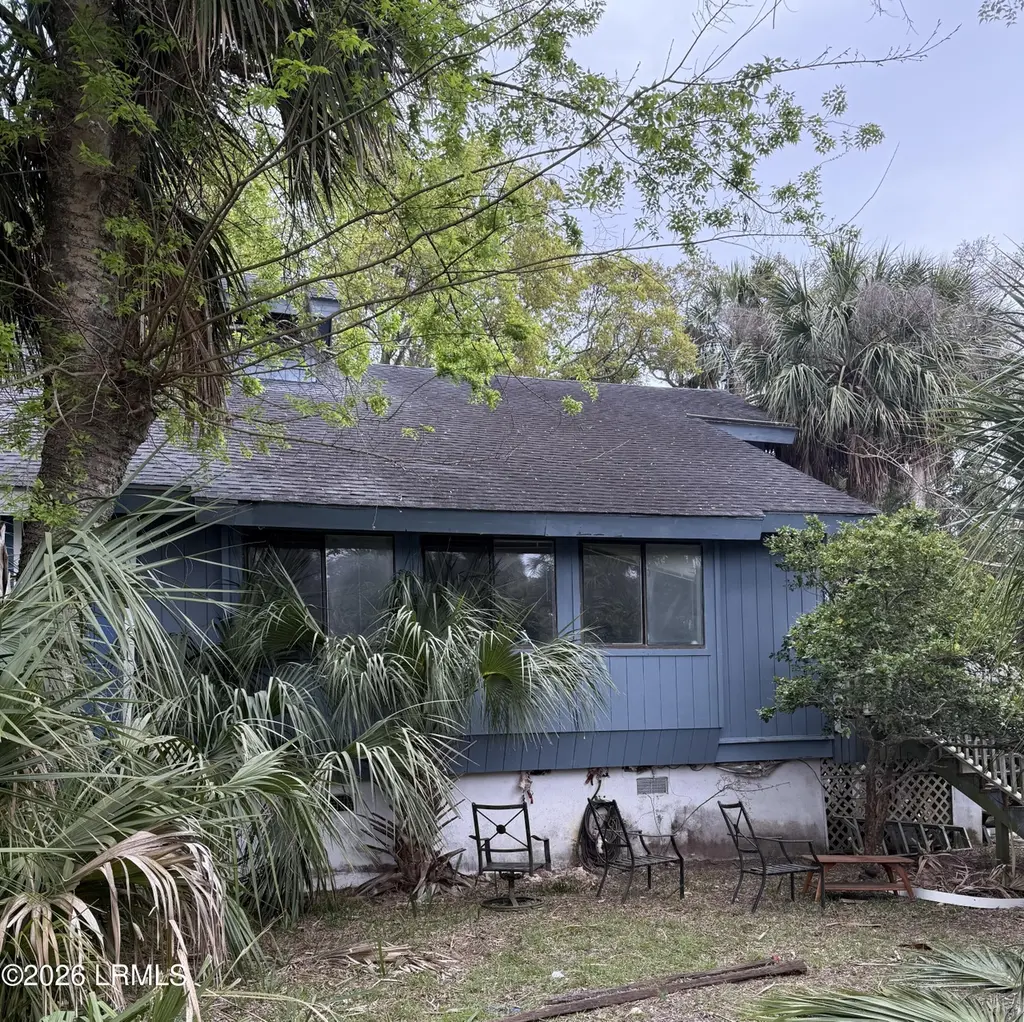
8 High Dunes · Fripp Island, SC
Flood risk 10/10 · Severe
- FEMA flood zone
- AE
- Chance of flooding over 30 yrs
- 0.99%
- Est. flood insurance / yr
- $1,737 – $8,500
Fire risk 1/10 · Minimal
- Est. fire insurance / yr
- $783 – $1,453
Heat risk 10/10 · Severe
- Hot days now (above 105°F)
- 7 days/yr
- Hot days in 30 yrs
- 22 days/yr
Wind risk 9/10 · Severe
- Chance of severe wind over 30 yrs
- 99.0%
Air-quality risk 2/10 · Minimal
- Unhealthy air days now
- 1 days/yr
- Unhealthy air days in 30 yrs
- 1 days/yr
Risk factors via First Street. Map © Google.
Why this score? — see what drove the C+ grade
The composite is a weighted blend of 9 inputs, each scored 0–100. Each bar is that input's sub-score; the figure is the points it added to the 100-point composite (weight × sub-score).
- Cash flow +27.7/30.0
- DSCR +9.8/10.0
- 1% rule +7.7/10.0
- ARV discount +7.5/15.0
- Schools +4.1/10.0
- Rent growth +2.5/5.0
- Livability +2.5/5.0
- Condition / age +2.5/5.0
- Appreciation +0.0/10.0
$160,000
🖨 Deal sheet (PDF) 📄 Offer letter ✓ Due diligence
Listing remarks
Unlock the potential of this 3-bedroom, 2-bath duplex on desirable Fripp Island. Ready for a complete renovation, this property is a true blank canvas for investors, builders, or buyers with vision. In need of a full renovation, it offers the opportunity to reimagine the space from the ground up and create a custom coastal retreat or income-producing property. Located in the sought-after island community of Fripp Island, known for its beaches, golf courses, and resort-style amenities, the possibilities here are endless. Whether you're looking to renovate and resell, hold as a rental investment, or design your own getaway, this property presents a rare chance to capitalize on value in a prim
Key facts
- Complete renovation
- Rental investment
- Prime location
Tags
Neighborhood map
What this means for you Summary
Snapshot
- This is a 1-bed/2.0-bath single-family listed at $160k.
Deal economics
- At list price, monthly cash flow is $59 ($703/yr) — positive.
- The deal already cash-flows at list — no discount required.
- Meets the 1% rule at list price ($2k rent vs $160k).
- Cap rate 9.9% vs local median 0.8% in Fripp Island — top-decile yield for the area; either an underpriced asset or a hidden risk that comps aren't pricing in. Stress-test before assuming the spread holds.
Location & tenants
- Location reads: area grade C — affects rentability + tenant quality, not the cash-flow math above.
- Beaufort 01 (town): math 42% / reading 51% proficiency, ranked #17 of 80 in SC (top 21%) — families likely to look elsewhere, expect single-tenant / working-renter base with shorter leases.
- Zoned schools: St. Helena Elementary (math 17% / reading 22%, grade F, #499 of 597 statewide, top 84%, 347 students, 100% FRL); Lady'S Island Middle (math 23% / reading 35%, grade F, #142 of 229 statewide, top 62%, 434 students, 100% FRL); Beaufort High (math 47% / reading 81%, grade B-, #92 of 196 statewide, top 48%, 1,191 students, 49% FRL) — zoned schools average 83% FRL vs 48% district-wide (35 pts higher); higher-poverty schools than district average — tighter screening recommended.
- Market conditions: 330 active listings in the ZIP; 1,824 units permitted in Beaufort County in 2024 (618 in 5+ unit buildings).
Forward outlook
- Local home prices are declining (-3.0%/yr); year-one equity from $1k of loan paydown is wiped out by about $5k of value loss. Plan a longer hold.
- Beaufort County population projected at +30% by 2050 — long-run rental-demand tailwind backs the buy-and-hold thesis.
Negotiation context
- Only 6 days on market — expect competitive offers; lowballing is unlikely to land.
- Current owner paid $53k; list at $160k implies a 203% gain — meaningful room to come down on a strong offer.
Risks & watch-outs
- Watch-outs: flood insurance adds $427/mo.
- Climate carrying-cost: in FEMA flood zone AE (mandatory federal flood insurance); severe wind risk, 99% chance of damaging wind over 30y; extreme-heat days projected 7→22/yr by 2055 (HVAC capex compounding) — expect insurance premiums to compound above CPI over the hold.
Questions for the listing agent
- Built in 1978 — when were the roof, HVAC, electrical panel, plumbing, and water heater last replaced?
- What's the actual annual flood-insurance premium (NFIP or private), and is the property in a SFHA with mandatory coverage?
- What does the HOA fee cover, when was the last increase, and are there any pending special assessments or reserve-fund shortfalls?
- Is there a deadline driving the sale (1031 exchange, divorce, estate, relocation)? That informs how much negotiation room exists.
- What's the average days-on-market for RENTAL listings here right now (not sales)? A rising rental-DOM trend means longer vacancies and softer asking-rent achievability than the comps imply.
- What's the recent tenant-quality profile in this submarket — average credit score on applications, eviction rate, late-payment / NSF rate, and stable-employment percentage? A property-management company in the area should have these aggregated.
- How much new for-sale + rental construction is in the pipeline within 1–3 miles? Heavy new supply typically softens prices + rents 12–24 months out; constrained supply supports both.
Investment metrics
- 1% rule
- 1.27% ✓
- Cap rate
- 9.93%
- Cash-on-cash
- 12.99%
- DSCR
- 1.58
- GRM
- 6.6
CMA / ARV
- ARV (on-the-fly)
- $657,923
- Comps found
- 3
Show comp detail 3 sales within ~0.75 mi
| Address | Dist | Beds/Ba | Sqft | Sold | Price | $/sf | Match |
|---|---|---|---|---|---|---|---|
| 137 Ocean Point Dr | 0.36mi | 2/2.0 (+1) | 1,354 (-5%) | 8mo | $627,500 | $463 | 64 |
| 143 Ocean Point Dr | 0.37mi | 2/2.0 (+1) | 1,354 (-5%) | 8mo | $730,000 | $539 | 63 |
| 101 Sand Piper | 0.51mi | 2/2.0 (+1) | 1,275 (-10%) | 4mo | $512,000 | $402 | 51 |
Match score weights: distance 35% · size 25% · config 20% · recency 20%. Top-matched comps best support the ARV.
Projected returns pro-forma
-3.0% appreciation · 3.0% rent growth · sell at horizon
- IRR
- -13.6%
- Equity multiple
- 0.51×
- Total profit
- $-21,895
- Equity at exit
- $23,857
- IRR
- -4.4%
- Equity multiple
- 0.71×
- Total profit
- $-13,034
- Equity at exit
- $13,834
Cash invested: $44,800 (down + closing). Projections, not guarantees.
Landlord ↔ Tenant lean methodology
- Overall (STATE)
- 90 Strongly Landlord-Friendly
- State South Carolina
- 90 Strongly Landlord-Friendly · R+6
- County
- — inherits STATE
- City
- — inherits STATE
ZIP-level market 29920
- Home prices YoY
- -14.5%
- Active inventory
- 330
- Price-to-rent
- 6.6×
Monthly cashflow live
- Estimated rent
- $2,034 medium interval (Pro) →
- Mortgage (P&I)
- −$839
- Tax from tax record
- −$101 /mo · $1,209/yr
- Insurance
- −$67
- Flood insurance flood zone
- −$427 /mo · $5,118/yr
- HOA
- −$115
- Vacancy / Maint / Mgmt
- −$427
- Net cashflow
- $59
Break-even live
Sensitivity live
| Price | -10% $149 | -5% $104 | +0% $59 | +5% $13 | +10% $-32 |
|---|---|---|---|---|---|
| Rent | -10% $-102 | -5% $-22 | +0% $59 | +5% $139 | +10% $219 |
| Rate | -1.0pp $139 | -0.5pp $99 | base $59 | +0.5pp $17 | +1.0pp $-25 |
UW: 25.0% down · 7.5% · 30yr · 1.5% tax · 5.0% vac · 8.0% maint · 8.0% mgmt
Financing live
Cash to close
- Down payment
- $40,000
- Closing costs
- $4,800
- Reserves months
- —
- Total cash needed
- —
Loan-product check · same deal, 3 products live
Conventional
25% down · 7.5% · 30yr
- Down + closing
- —
- Monthly P&I
- —
- Monthly cashflow
- —
- DSCR
- —
- Eligible?
- —
Personal DTI + credit; lowest rate.
DSCR
20% down · 8.5% · 30yr
- Down + closing
- —
- Monthly P&I
- —
- Monthly cashflow
- —
- DSCR
- —
- Eligible?
- —
No personal income docs; deal must DSCR.
Hard money
10% down · 12.0% · 12mo
- Down + closing
- —
- Monthly P&I
- —
- Monthly cashflow
- —
- DSCR
- —
- Eligible?
- —
Short-term bridge; refi at stabilization.
HOA detail
- Monthly dues
- $115 · $1,380/yr
Listing history 4 events
-
2026-04-22status Pending
-
2026-04-21historical Under Contract - Take Backup
-
2026-04-16$160,000 Active
-
1990-12-05soldstatus $52,735
ⓘ Source: listings_history table (triggers on properties + properties_extension) + one-shot
backfill from property_details.listing_events for pre-trigger history.
Tax reassessment forecast SC · Resets to sale price
- Current annual tax
- $1,209 · $101/mo
- Projected year-2 tax
- $1,209 · $101/mo
- Expected delta
- $0/yr ($0/mo · 0.0%)
ⓘ Screening estimate from a state-policy table — verify with the county assessor before closing.
Climate risk First Street
- Flood 10/10 Extreme FEMA zone AE · 99% chance over 30 yrs
- Wildfire 1/10 Low
- Heat 10/10 Extreme 7 d/yr ≥105°F today · 22 d/yr by 30 yrs out
- Wind 9/10 Extreme 99% chance of damaging wind over 30 yrs
- Air quality 2/10 Low 1 unhealthy d/yr today · 1 by 30 yrs out
Nearby sold comps map
Loading sold comps map…
Walkable amenities ~0.75 mi
Loading nearby amenities…
Taxation est. · year 1
- Rental income
- $24,404
- − Mortgage interest
- −$8,962
- − Property taxes
- −$1,209
- − Insurance
- −$5,918
- − Repairs & maintenance
- −$1,952
- − Management
- −$1,952
- − HOA
- −$1,380
- − Depreciation
- −$4,655
- Taxable loss
- −$1,625
- Est. tax savings @ 24.0%
- +$390
- After-tax cash flow
- $1,093/yr
For passive investors: Depreciation is non-cash, so a rental often shows a tax loss while cash-flowing — sheltering income. Rental losses are passive: they offset passive income freely, and up to $25,000/yr can offset ordinary (W-2) income if you actively participate and your MAGI is under $100k (phasing out to $0 by $150k); unused losses carry forward. On sale, claimed depreciation is recaptured at up to 25%, and gains may owe capital-gains tax (a 1031 exchange can defer both). Figures are a year-1 estimate at your 24.0% rate — not tax advice; consult a CPA.
Schools (NCES district)
- District
- Beaufort 01
- NCES district ID
- 4501110
- Math proficiency
- 42% ▼ -8.00%
- Reading proficiency
- 51% ▲ 2.00%
- Median HH income
- $57,430
- Composite
- 40.56/100
- National rank
- #3699
- State rank
- #17 of 80 in SC
Livability — Fripp Island
No livability data for this city. (Only ~50 U.S. cities are tracked.)
Census & demographics
- Census place
- Fripp Island, SC
- Population (ZIP)
- 9,918
Population outlook (Beaufort County) Hauer SSP2
- Today (2025)
- 211,915 people
- By 2030
- 227,272 · +7.2%
- By 2040
- 253,861 · +19.8%
- By 2050
- 275,126 · +29.8%
- By 2075
- 311,022 · +46.8%
- By 2100
- 321,286 · +51.6%
Race, ethnicity, and origin ACS 2023
- Neighborhood character
- Diverse neighborhood (Simpson 0.60)
- Race & ethnicity
- Black 48% White 41% Hispanic / Latino 7% Two or more races 6%
- Hispanic origin (detail)
- Mexican 5%
- Common ancestry
- Slovak 2% Serbian 2% Romanian 1%
- Foreign-born
- 6% · Canada
- Languages at home
- 93% English-only · Spanish 5%
Political lean MEDSL · Beaufort
- 2024 margin
- R (+14.5) · D 42.1% · R 56.6% · Other 1.2%
- 2008→2024 swing
- -3.7pp toward R · 2008: -10.8pp · 2024: -14.5pp
- All cycles
- 2024: R+14.5 2020: R+10.0 2016: R+14.3 2012: R+17.5 2008: R+10.8
Not yet ingested
- Civics
- —
Market trends
- HPI YoY
- ▼ -48.29%
- Current HPI
- 284.2064
- Rent YoY
- —
- Metro
- —
- State GDP YoY
- ▲ 4.51%
- F500 in state
- 2
Industry mix (Fortune 500 HQ in SC)
| Industry | F500 HQs | Revenue |
|---|---|---|
| Packaging | 1 | $7B |
|
||
Price history
+203.4% since first listed4 events — show timeline
- 2026-04-22 Pending — LRMLS
- 2026-04-21 Contingent — LRMLS
- 2026-04-16 Listed $160,000 LRMLS
- 1990-12-05 Sold (Public Records) $52,735 Public Records
Property tax history
-4.5%/yrLatest (2025): $1,209 · +6.0% YoY. Source: county tax records.
Cash-flow waterfall
monthlySold comps — $/sqft
last 12 mo · ≤1 miLoading sold comps…