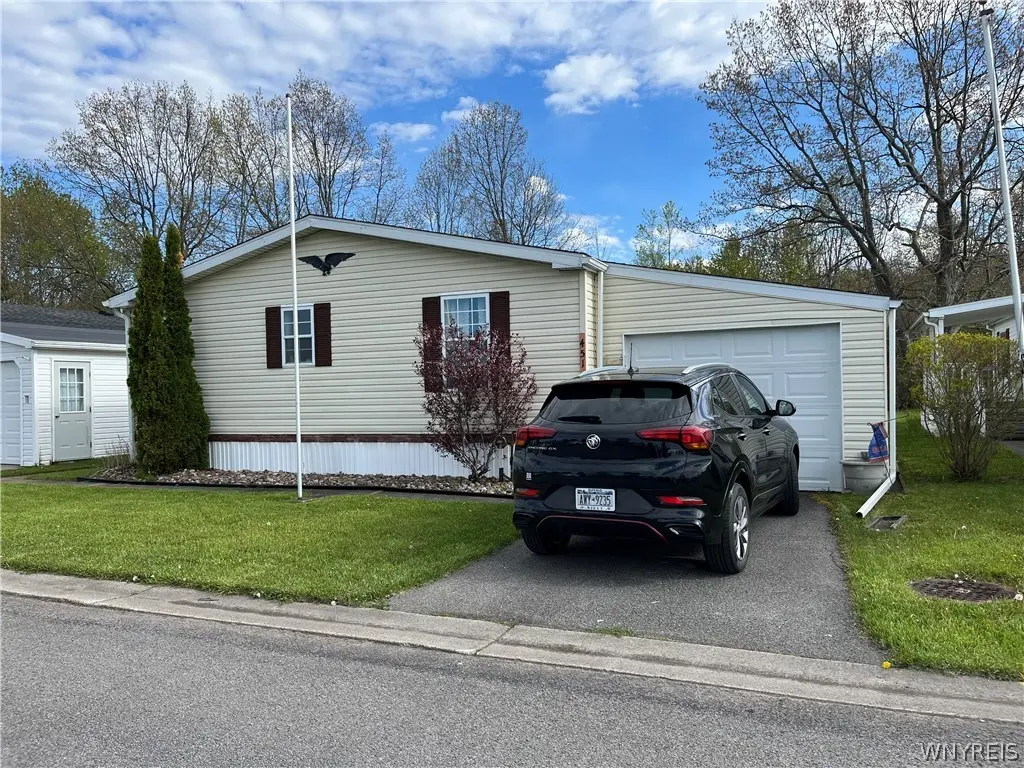
451 Jim Kelly Dr · South Lockport, NY
Flood risk 1/10 · Minimal
- FEMA flood zone
- X (unshaded)
- Chance of flooding over 30 yrs
- 0.0%
- Est. flood insurance / yr
- $507 – $1,088
Fire risk 3/10 · Minor
- Est. fire insurance / yr
- $691 – $1,283
Heat risk 2/10 · Minimal
- Hot days now (above 95°F)
- 7 days/yr
- Hot days in 30 yrs
- 15 days/yr
Wind risk 1/10 · Minimal
- Chance of severe wind over 30 yrs
- —
Air-quality risk 2/10 · Minimal
- Unhealthy air days now
- 2 days/yr
- Unhealthy air days in 30 yrs
- 2 days/yr
Risk factors via First Street. Map © Google.
Why this score? — see what drove the B- grade
The composite is a weighted blend of 9 inputs, each scored 0–100. Each bar is that input's sub-score; the figure is the points it added to the 100-point composite (weight × sub-score).
- Cash flow +30.0/30.0
- 1% rule +10.0/10.0
- DSCR +10.0/10.0
- ARV discount +5.3/15.0
- Schools +3.9/10.0
- Rent growth +3.4/5.0
- Livability +3.3/5.0
- Condition / age +2.8/5.0
- Appreciation +0.0/10.0
$89,900
🖨 Deal sheet (PDF) 📄 Offer letter ✓ Due diligence
Listing remarks
Beautiful 3-bed, 2-bath home situated on a concrete pad with a one car garage. This spacious home also features central air and a welcoming living room, formal dining area, and a cozy family room complete with a gas fireplace. The kitchen has abundant cabinet space, perfect for storage and entertaining. The primary suite is designed for comfort with a luxurious garden tub, oversized walk-in shower, double sinks and separate vanities. Guests will appreciate the large parking area conveniently located directly across from the home. Step outside to enjoy the private back deck overlooking a peaceful wooded area with no rear neighbors--the perfect setting for relaxing mornings or evening gatheri
Key facts
- Garage
- Community pool
- Built 1995
Property features AI
Finance
- Other: Lot dimensions approximately 50 x 100
- Financial info: Monthly land lease payment
- HOA & community: Land lease applicable
Exterior
- Parking: Attached garage with electric and automatic garage door opener (1 car)
- Utilities: Public water connected; Sewer connected; Cable available; High-speed internet available
- Home design: Single-story home; Double-wide manufactured home (Schultz); Resale property; City street frontage; Lot is rectangular and wooded; near public transit
- Construction: Vinyl siding; Existing construction
- Exterior features: Blacktop driveway; Deck; Community pool
Interior
- Kitchen: Electric cooktop; Dishwasher; Refrigerator; Kitchen island
- Bedrooms: Three main-level bedrooms; Bedroom 1 (15 x 13); Bedroom 2 (13 x 10); Bedroom 3 (10 x 10)
- Flooring: Carpet; Laminate; Varies
- Bathrooms: Two full bathrooms (both on the main level)
- Heating & cooling: Forced air heating (gas); Central air conditioning
- Interior features: Skylights; Ceiling fans; Kitchen island; Formal living room; Formal dining room; Main-level primary bedroom; Primary bedroom with bath; No stairs (single-level accessibility); Accessible bedroom; Low-threshold shower
- Laundry & utility: Washer and dryer; Main-level laundry / accessible utilities
Neighborhood map
What this means for you Summary
Snapshot
- This is a 3-bed/2.0-bath manufactured listed at $90k. Condition is rated average.
Deal economics
- At list price, monthly cash flow is $566 ($7k/yr) — positive.
- The deal already cash-flows at list — no discount required.
- Meets the 1% rule at list price ($2k rent vs $90k).
- Cap rate 13.8% vs local median 1.5% in South Lockport — top-decile yield for the area; either an underpriced asset or a hidden risk that comps aren't pricing in. Stress-test before assuming the spread holds.
Location & tenants
- Location reads 66/100 on livability (#633 in NY) — a middle-class / working-renter tenant base. Strengths: cost of living A+, health & safety A+; Watch: employment D+, schools F, crime F.
- Lockport City School District (town): math 44% / reading 49% proficiency, ranked #452 of 590 in NY (top 77%) — families likely to look elsewhere, expect single-tenant / working-renter base with shorter leases.
- Market conditions: Rents rising (+3.7%/yr); 357 active listings in the ZIP; 1 comparable units currently listed for rent nearby; solid renter incomes; 167 units permitted in Niagara County in 2024 (0 in 5+ unit buildings).
Forward outlook
- Local home prices are declining (-3.0%/yr); year-one equity from $622 of loan paydown is wiped out by about $3k of value loss. Plan a longer hold.
- Niagara County population projected at -19% by 2050 — secular population decline; favor cash flow + early exit over multi-decade hold.
- At projected returns (-3.0% appreciation + 3.7% rent growth), your $25k cash investment doubles in ~5 years — after that, you're playing with house money.
Negotiation context
- Only 8 days on market — expect competitive offers; lowballing is unlikely to land.
Questions for the listing agent
- Is there a deadline driving the sale (1031 exchange, divorce, estate, relocation)? That informs how much negotiation room exists.
- Schools are F-rated, which usually means shorter tenancies and higher turnover. Who's the typical renter profile here, and what's been the actual vacancy rate?
- Crime grade is F in this area — have there been break-ins, vandalism, or insurance claims at this property in the last 3 years? What carrier currently insures it and at what premium?
- What's the average days-on-market for RENTAL listings here right now (not sales)? A rising rental-DOM trend means longer vacancies and softer asking-rent achievability than the comps imply.
- What's the recent tenant-quality profile in this submarket — average credit score on applications, eviction rate, late-payment / NSF rate, and stable-employment percentage? A property-management company in the area should have these aggregated.
- How much new for-sale + rental construction is in the pipeline within 1–3 miles? Heavy new supply typically softens prices + rents 12–24 months out; constrained supply supports both.
Investment metrics
- 1% rule
- 1.67% ✓
- Cap rate
- 13.84%
- Cash-on-cash
- 26.97%
- DSCR
- 2.20
- GRM
- 5.0
CMA / ARV
- ARV (on-the-fly)
- $85,680
- Comps found
- 12
Show comp detail 12 sales within ~0.75 mi
| Address | Dist | Beds/Ba | Sqft | Sold | Price | $/sf | Match |
|---|---|---|---|---|---|---|---|
| 701 Gardenwood Dr | 0.37mi | 3/2.0 | 1,792 (+7%) | 1mo | $36,200 | $20 | 71 |
| 1172 Underwood Ct | 0.49mi | 3/2.0 | 1,568 (-7%) | 5mo | $80,000 | $51 | 61 |
| 1218 Maplewood Dr | 0.59mi | 3/2.0 | 1,568 (-7%) | 0mo | $70,000 | $45 | 61 |
| 352 Applewood Dr | 0.53mi | 3/2.5 | 1,792 (+7%) | 5mo | $96,000 | $54 | 58 |
| 807 Fernwood Dr | 0.71mi | 3/2.0 | 1,730 (+3%) | 5mo | $82,000 | $47 | 58 |
| 472 Chestnut Dr | 0.42mi | 3/2.0 | 1,456 (-13%) | 8mo | $75,000 | $52 | 51 |
| 1009 Ridgewood | 0.61mi | 3/2.0 | 1,461 (-13%) | 1mo | $50,000 | $34 | 49 |
| 779 Fernwood Dr | 0.64mi | 3/2.0 | 1,848 (+10%) | 8mo | $94,900 | $51 | 46 |
| 625 Birchwood Dr | 0.55mi | 3/2.0 | 1,456 (-13%) | 9mo | $45,000 | $31 | 45 |
| 901 Hollywood Dr | 0.71mi | 3/2.0 | 1,456 (-13%) | 2mo | $82,000 | $56 | 44 |
| 519 Applewood Dr #519 | 0.53mi | 4/2.0 (+1) | 1,456 (-13%) | 5mo | $42,500 | $29 | 44 |
| 837 Willowbrook Dr | 0.75mi | 3/2.5 | 1,904 (+13%) | 6mo | $107,000 | $56 | 36 |
Match score weights: distance 35% · size 25% · config 20% · recency 20%. Top-matched comps best support the ARV.
Projected returns pro-forma
-3.0% appreciation · 3.67% rent growth · sell at horizon
- IRR
- 21.7%
- Equity multiple
- 1.89×
- Total profit
- $22,502
- Equity at exit
- $13,404
- IRR
- 30.2%
- Equity multiple
- 3.79×
- Total profit
- $70,319
- Equity at exit
- $7,773
Cash invested: $25,172 (down + closing). Projections, not guarantees.
Landlord ↔ Tenant lean methodology
- Overall (STATE)
- 15 Strongly Tenant-Friendly
- State New York
- 15 Strongly Tenant-Friendly · D+10
- County
- — inherits STATE
- City
- — inherits STATE
ZIP-level market 14094
- Rents YoY
- 3.7%
- Active inventory
- 357
- Price-to-rent
- 5.0×
Monthly cashflow live
- Estimated rent
- $1,502 medium interval (Pro) →
- Mortgage (P&I)
- −$471
- Tax est. 1.5%
- −$112 /mo · $1,348/yr
- Insurance
- −$37
- HOA
- −$0
- Vacancy / Maint / Mgmt
- −$316
- Net cashflow
- $566
Break-even live
Sensitivity live
| Price | -10% $628 | -5% $597 | +0% $566 | +5% $535 | +10% $504 |
|---|---|---|---|---|---|
| Rent | -10% $447 | -5% $506 | +0% $566 | +5% $625 | +10% $684 |
| Rate | -1.0pp $611 | -0.5pp $589 | base $566 | +0.5pp $542 | +1.0pp $519 |
UW: 25.0% down · 7.5% · 30yr · 1.5% tax · 5.0% vac · 8.0% maint · 8.0% mgmt
Financing live
Cash to close
- Down payment
- $22,475
- Closing costs
- $2,697
- Reserves months
- —
- Total cash needed
- —
Loan-product check · same deal, 3 products live
Conventional
25% down · 7.5% · 30yr
- Down + closing
- —
- Monthly P&I
- —
- Monthly cashflow
- —
- DSCR
- —
- Eligible?
- —
Personal DTI + credit; lowest rate.
DSCR
20% down · 8.5% · 30yr
- Down + closing
- —
- Monthly P&I
- —
- Monthly cashflow
- —
- DSCR
- —
- Eligible?
- —
No personal income docs; deal must DSCR.
Hard money
10% down · 12.0% · 12mo
- Down + closing
- —
- Monthly P&I
- —
- Monthly cashflow
- —
- DSCR
- —
- Eligible?
- —
Short-term bridge; refi at stabilization.
Rent comps 1 comps
| Address | Beds | Baths | Sqft | Rent | $/sqft | DOM | Units | Dist |
|---|---|---|---|---|---|---|---|---|
| 5834 S Transit Rd Lockport, NY | 2.0 | 1.0 | 1200 | $1,600 | $1.33 | 2d | 1 | 0.98mi |
Listing history 2 events
-
2026-05-20status Pending
-
2026-05-12$89,900 Active
ⓘ Source: listings_history table (triggers on properties + properties_extension) + one-shot
backfill from property_details.listing_events for pre-trigger history.
Climate risk First Street
- Flood 1/10 Low FEMA zone X (unshaded) · 0% chance over 30 yrs
- Wildfire 3/10 Moderate
- Heat 2/10 Low 7 d/yr ≥95°F today · 15 d/yr by 30 yrs out
- Wind 1/10 Low
- Air quality 2/10 Low 2 unhealthy d/yr today · 2 by 30 yrs out
Nearby sold comps map
Loading sold comps map…
Walkable amenities ~0.75 mi
Loading nearby amenities…
Taxation est. · year 1
- Rental income
- $18,030
- − Mortgage interest
- −$5,036
- − Property taxes
- −$1,348
- − Insurance
- −$450
- − Repairs & maintenance
- −$1,442
- − Management
- −$1,442
- − Depreciation
- −$2,615
- Taxable income
- $5,696
- Est. tax owed @ 24.0%
- −$1,367
- After-tax cash flow
- $5,421/yr
For passive investors: Depreciation is non-cash, so a rental often shows a tax loss while cash-flowing — sheltering income. Rental losses are passive: they offset passive income freely, and up to $25,000/yr can offset ordinary (W-2) income if you actively participate and your MAGI is under $100k (phasing out to $0 by $150k); unused losses carry forward. On sale, claimed depreciation is recaptured at up to 25%, and gains may owe capital-gains tax (a 1031 exchange can defer both). Figures are a year-1 estimate at your 24.0% rate — not tax advice; consult a CPA.
Condition & rehab AI · 1 photo
This 3-bedroom, 2-bath manufactured home is in average condition with some cosmetic repairs needed. It offers a spacious layout with central air and a cozy family room. The property has a one-car garage and a private back deck, making it ideal for a family or investor looking for a move-in-ready home.
Repairs flagged
- Minor Paint touch-ups — Light wear on exterior siding
- Minor Landscaping — Some overgrown bushes
Value-add opportunities
- Both Paint exterior siding — Enhances curb appeal and value
- Both Landscaping — Improves curb appeal and enhances property value
Renovation cost estimate screening
| Repair item | Severity | Est. cost |
|---|---|---|
| Paint touch-ups · Light wear on exterior siding | Minor | $500–3,000 |
| Landscaping · Some overgrown bushes | Minor | $500–3,000 |
| Total estimated repair cost · 2 items | $1,000–6,000 |
Value-add ROI direction
- Both Paint exterior siding — Enhances curb appeal and value ↑
- Both Landscaping — Improves curb appeal and enhances property value ↑
ⓘ Cost ranges are severity-bucket heuristics (US national rule-of-thumb). Get contractor quotes + a written scope before underwriting a rehab budget.
Schools (NCES district)
- District
- Lockport City School District
- NCES district ID
- 3617670
- Math proficiency
- 44% ▼ -7.00%
- Reading proficiency
- 49% ▲ 3.00%
- Median HH income
- $43,793
- Composite
- 39.28/100
- National rank
- #3997
- State rank
- #452 of 590 in NY
Livability — South Lockport
- Score
- 66/100
- State rank
- #633
- US rank
- #11642
Category grades
Schools grade is shown separately in the Schools card above.
Census & demographics
- Census place
- South Lockport, NY
- County
- Niagara County · 157,377 people
- Metro
- Buffalo-Cheektowaga, NY
- Population (ZIP)
- 50,153
- Household income
- $75,427
- Rent vs Own
- Severe rent burden
- 1112.0
Population outlook (Niagara County) Hauer SSP2
- Today (2025)
- 204,149 people
- By 2030
- 197,900 · -3.1%
- By 2040
- 182,239 · -10.7%
- By 2050
- 165,198 · -19.1%
- By 2075
- 129,416 · -36.6%
- By 2100
- 96,222 · -52.9%
Race, ethnicity, and origin ACS 2023
- Neighborhood character
- Predominantly White (84%)
- Race & ethnicity
- White 84% Two or more races 6% Black 6% Hispanic / Latino 3%
- Common ancestry
- Romanian 9% Slovak 2% Lithuanian 2%
- Foreign-born
- 3% · Canada
- Languages at home
- 96% English-only · Spanish 1% Russian/Polish/Slavic 1% Other Indo-European 1%
Political lean MEDSL · Niagara
- 2024 margin
- R (+14.9) · D 42.5% · R 57.5%
- 2008→2024 swing
- -15.9pp toward R · 2008: 1.0pp · 2024: -14.9pp
- All cycles
- 2024: R+14.9 2020: R+9.7 2016: R+19.0 2012: D+0.6 2008: D+1.0
Not yet ingested
- Civics
- —
Market trends
- HPI YoY
- ▼ -262.57%
- Current HPI
- 303.6109
- Rent YoY
- ▲ 3.67%
- Metro
- Buffalo-Cheektowaga, NY
- State GDP YoY
- ▲ 2.60%
- F500 in state
- 92
Industry mix (Fortune 500 HQ in NY)
| Industry | F500 HQs | Revenue |
|---|---|---|
| Financial Services | 10 | $950B |
|
||
| Consumer Goods | 9 | $162B |
|
||
| Insurance | 4 | $225B |
|
||
| Telecommunications | 2 | $144B |
|
||
| Pharmaceuticals | 2 | $112B |
|
||
| Media / Entertainment | 2 | $69B |
|
||
Price history
2 events — show timeline
- 2026-05-20 Pending — WNYREIS
- 2026-05-12 Listed $89,900 WNYREIS
Cash-flow waterfall
monthlySold comps — $/sqft
last 12 mo · ≤1 miLoading sold comps…