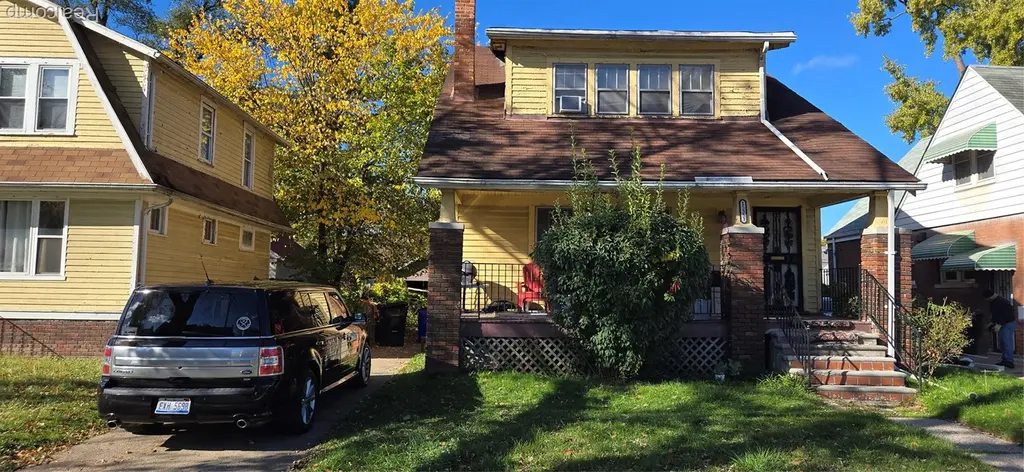
15353 Saint Marys St · Detroit, MI
Flood risk 1/10 · Minimal
- FEMA flood zone
- X (unshaded)
- Chance of flooding over 30 yrs
- 0.0%
- Est. flood insurance / yr
- $473 – $860
Fire risk 1/10 · Minimal
- Est. fire insurance / yr
- $784 – $1,456
Heat risk 3/10 · Minor
- Hot days now (above 98°F)
- 7 days/yr
- Hot days in 30 yrs
- 15 days/yr
Wind risk 2/10 · Minimal
- Chance of severe wind over 30 yrs
- —
Air-quality risk 3/10 · Minor
- Unhealthy air days now
- 2 days/yr
- Unhealthy air days in 30 yrs
- 5 days/yr
Risk factors via First Street. Map © Google.
Why this score? — see what drove the B+ grade
The composite is a weighted blend of 9 inputs, each scored 0–100. Each bar is that input's sub-score; the figure is the points it added to the 100-point composite (weight × sub-score).
- Cash flow +30.0/30.0
- ARV discount +15.0/15.0
- 1% rule +10.0/10.0
- DSCR +10.0/10.0
- Rent growth +3.9/5.0
- Livability +3.7/5.0
- Condition / age +2.5/5.0
- Schools +1.3/10.0
- Appreciation +0.0/10.0
$100,000
🖨 Deal sheet 📄 Offer letter ✓ Due diligence
Listing remarks MLS
CASH OFFERS ONLY! Lots of home for the money (1,700 square feet) the house has three bedrooms on 2nd floor one bedroom on first floor, large living room with natural fireplace, hot water heater 2022, furnace 2011, circuit breakers, lots of glass block windows on first floor, security storm doors on front and back of house, 2 car garage, house needs lots of updating and is sold in "AS IS" condition, buyers to verify all data, basement does leak. located in a very nice area! homes are selling for a lot more in this location, close to shopping, Schools and Freeways.
Key facts
- 5,227 sq ft lot
- 2 garage spots
- Built 1925
Neighborhood map
What this means for you Summary
Snapshot
- This is a 4-bed/1.5-bath single-family listed at $100k.
Deal economics
- At list price, monthly cash flow is $530 ($6k/yr) — positive.
- The deal already cash-flows at list — no discount required.
- Meets the 1% rule at list price ($1k rent vs $100k).
- Recommended offer: $88k (12.0% below list) — sets the bar for market timing.
- Cap rate 12.7% vs local median 10.2% in Detroit — meaningfully above typical; check what's discounted (condition, days-on-market, listing class) to confirm the premium yield is real.
Location & tenants
- Location reads 73/100 on livability (#218 in MI) — a middle-class / working-renter tenant base. Strengths: amenities A+, commute A+, cost of living A+; Watch: schools F, crime F, employment F.
- Detroit Public Schools Community District (urban): math 10% / reading 24% proficiency, ranked #499 of 540 in MI (top 92%) — low school quality limits family demand, transient renter base, plan for 1-2y turnover; 90% free/reduced lunch — lower-income household profile, screen leases tightly.
- Market conditions: Rents rising fast (+5.6%/yr); 385 active listings in the ZIP; 32 comparable units currently listed for rent nearby; rentals at typical pace (median 20d on market — plan ~3-4 weeks tenant-placement turnaround); lower-income renter base — watch delinquency; 2,639 units permitted in Wayne County in 2024 (1,216 in 5+ unit buildings).
- At $1,495/mo this rent would consume 49% of the median local household income ($37k/yr) (locally 2371% of renters already pay >50% of income on rent) — very limited rent-growth headroom before tenants either downsize or default.
Forward outlook
- Local home prices are declining (-3.0%/yr); year-one equity from $691 of loan paydown is wiped out by about $3k of value loss. Plan a longer hold.
- Wayne County population projected at -17% by 2050 — secular population decline; favor cash flow + early exit over multi-decade hold.
- At projected returns (-3.0% appreciation + 5.6% rent growth), your $28k cash investment doubles in ~5 years — after that, you're playing with house money.
Negotiation context
- It's been on market 234 days — a 12% lower offer ($88k) is reasonable based on typical stale-listing flexibility.
- 2 sale attempts with the ask held roughly flat each time — persistent listings suggest the price (not the market) is what's stuck; bring a comps-based counter.
Risks & watch-outs
- Watch-outs: built in 1925 — expect roof / HVAC / electrical / plumbing capex.
Questions for the listing agent
- It's been on market 234 days. Have you received any prior offers? Is the seller open to a 12% concession, seller financing, or rate buy-down credit?
- Built in 1925 — when were the roof, HVAC, electrical panel, plumbing, and water heater last replaced?
- Why hasn't it sold? Are there any deal-killer items the seller is aware of (foundation, flood, title, zoning, code violations)?
- Is there a deadline driving the sale (1031 exchange, divorce, estate, relocation)? That informs how much negotiation room exists.
- Schools are F-rated, which usually means shorter tenancies and higher turnover. Who's the typical renter profile here, and what's been the actual vacancy rate?
- Crime grade is F in this area — have there been break-ins, vandalism, or insurance claims at this property in the last 3 years? What carrier currently insures it and at what premium?
- What's the average days-on-market for RENTAL listings here right now (not sales)? A rising rental-DOM trend means longer vacancies and softer asking-rent achievability than the comps imply.
- What's the recent tenant-quality profile in this submarket — average credit score on applications, eviction rate, late-payment / NSF rate, and stable-employment percentage? A property-management company in the area should have these aggregated.
- How much new for-sale + rental construction is in the pipeline within 1–3 miles? Heavy new supply typically softens prices + rents 12–24 months out; constrained supply supports both.
Investment metrics
- 1% rule
- 1.50% ✓
- Cap rate
- 12.66%
- Cash-on-cash
- 22.73%
- DSCR
- 2.01
- GRM
- 5.6
CMA / ARV
- ARV (median comp)
- $166,312
- List price
- $100,000
- Delta
- -39.87%
- Verdict
- UNDERPRICED
- Comps
- 20 within 1.0 mi
Show comp detail 12 sales within ~0.75 mi
| Address | Dist | Beds/Ba | Sqft | Sold | Price | $/sf | Match |
|---|---|---|---|---|---|---|---|
| 15361 Mansfield St | 0.06mi | 4/1.0 | 1,766 (+4%) | 2mo | $65,000 | $37 | 88 |
| 15482 Rutherford St | 0.18mi | 3/1.0 (-1) | 1,653 (-3%) | 0mo | $65,000 | $39 | 79 |
| 15357 Rutherford St | 0.11mi | 3/1.5 (-1) | 1,592 (-6%) | 2mo | $45,000 | $28 | 77 |
| 14529 Asbury Park | 0.56mi | 4/2.0 | 1,688 (-1%) | 4mo | $127,500 | $76 | 67 |
| 15501 Whitcomb St | 0.52mi | 4/1.5 | 1,609 (-6%) | 1mo | $90,000 | $56 | 65 |
| 15762 Ferguson St | 0.28mi | 4/2.0 | 1,510 (-11%) | 4mo | $82,000 | $54 | 63 |
| 14689 Forrer St | 0.49mi | 3/1.5 (-1) | 1,627 (-4%) | 3mo | $65,000 | $40 | 62 |
| 15530 Winthrop St | 0.38mi | 3/1.0 (-1) | 1,573 (-8%) | 3mo | $60,000 | $38 | 60 |
| 14634 Abington Ave | 0.51mi | 3/1.5 (-1) | 1,618 (-5%) | 4mo | $165,000 | $102 | 59 |
| 15455 Lindsay St St | 0.35mi | 3/2.0 (-1) | 1,500 (-12%) | 4mo | $198,000 | $132 | 53 |
| 16601 Ferguson St | 0.66mi | 3/2.5 (-1) | 1,625 (-5%) | 1mo | $189,900 | $117 | 52 |
| 15468 Robson St | 0.73mi | 3/2.0 (-1) | 1,950 (+14%) | 4mo | $195,000 | $100 | 32 |
Match score weights: distance 35% · size 25% · config 20% · recency 20%. Top-matched comps best support the ARV.
Projected returns pro-forma
-3.0% appreciation · 5.59% rent growth · sell at horizon
- IRR
- 18.4%
- Equity multiple
- 1.77×
- Total profit
- $21,569
- Equity at exit
- $14,910
- IRR
- 28.5%
- Equity multiple
- 3.84×
- Total profit
- $79,565
- Equity at exit
- $8,646
Cash invested: $28,000 (down + closing). Projections, not guarantees.
Landlord ↔ Tenant lean methodology
- Overall (STATE)
- 62 Landlord-Friendly
- State Michigan
- 62 Landlord-Friendly · EVEN
- County
- — inherits STATE
- City
- — inherits STATE
ZIP-level market 48227
- Rents YoY
- 5.6%
- Active inventory
- 385
- Price-to-rent
- 5.6×
Monthly cashflow live
- Estimated rent
- $1,495 high interval (Pro) →
- Mortgage (P&I)
- −$524
- Tax from tax record
- −$85 /mo · $1,017/yr
- Insurance
- −$42
- HOA
- −$0
- Vacancy / Maint / Mgmt
- −$314
- Net cashflow
- $530
Break-even live
UW: 25.0% down · 7.5% · 30yr · 1.5% tax · 5.0% vac · 8.0% maint · 8.0% mgmt
Financing live
Cash to close
- Down payment
- $25,000
- Closing costs
- $3,000
- Reserves months
- —
- Total cash needed
- —
Loan-product check · same deal, 3 products live
Conventional
25% down · 7.5% · 30yr
- Down + closing
- —
- Monthly P&I
- —
- Monthly cashflow
- —
- DSCR
- —
- Eligible?
- —
Personal DTI + credit; lowest rate.
DSCR
20% down · 8.5% · 30yr
- Down + closing
- —
- Monthly P&I
- —
- Monthly cashflow
- —
- DSCR
- —
- Eligible?
- —
No personal income docs; deal must DSCR.
Hard money
10% down · 12.0% · 12mo
- Down + closing
- —
- Monthly P&I
- —
- Monthly cashflow
- —
- DSCR
- —
- Eligible?
- —
Short-term bridge; refi at stabilization.
Rent comps 32 comps
| Address | Beds | Baths | Sqft | Rent | $/sqft | DOM | Units | Dist |
|---|---|---|---|---|---|---|---|---|
| 15332 Saint Marys St Detroit, MI | 3.0 | 1.0 | 1200 | $1,200 | $1.00 | 16d | 1 | 0.08mi |
| 15752 Rutherford St Detroit, MI | 3.0 | 2.0 | 1174 | $1,386 | $1.18 | 5d | 1 | 0.25mi |
| 15065 Gilchrist St Detroit, MI | 3.0 | 1.0 | 1100 | $1,250 | $1.14 | 43d | 1 | 0.28mi |
| 14800 Woodmont Ave Detroit, MI | 3.0 | 2.0 | 1612 | $1,525 | $0.95 | 15d | 1 | 0.33mi |
| 15866 Mansfield St Detroit, MI | 3.0 | 1.0 | 1324 | $1,425 | $1.08 | 24d | 1 | 0.34mi |
| 16014 Hackett St Detroit, MI | 4.0 | 2.0 | 1142 | $1,500 | $1.31 | 43d | 1 | 0.35mi |
| 16210 Ferguson St Detroit, MI | 4.0 | 2.0 | 1493 | $1,750 | $1.17 | 3d | 1 | 0.51mi |
| 16535 Asbury Park Detroit, MI | 3.0 | 1.5 | 1152 | $1,450 | $1.26 | 24d | 1 | 0.56mi |
| 14893 Prest St Detroit, MI | 3.0 | 1.0 | 1100 | $1,000 | $0.91 | 15d | 1 | 0.59mi |
| 14504 Saint Marys St Detroit, MI | 4.0 | 1.0 | 1362 | $1,473 | $1.08 | 43d | 1 | 0.60mi |
| 14814 Sussex St Unit 2 Detroit, MI | 3.0 | 1.0 | 1100 | $1,000 | $0.91 | 43d | 1 | 0.76mi |
| 15341 Lauder St Detroit, MI | 4.0 | 1.5 | 1080 | $1,475 | $1.37 | 16d | 1 | 0.78mi |
| 15810 Robson St Detroit, MI | 3.0 | 1.0 | 1142 | $1,500 | $1.31 | 24d | 1 | 0.80mi |
| 16151 Robson St Detroit, MI | 3.0 | 1.0 | 1300 | $1,525 | $1.17 | 15d | 1 | 0.84mi |
| 16837 Winthrop St Detroit, MI | 5.0 | 2.0 | 1500 | $2,000 | $1.33 | 20d | 1 | 0.87mi |
| 16876 Harlow Ave Unit (NO) Detroit, MI | 3.0 | 1.0 | 1250 | $1,350 | $1.08 | 43d | 1 | 0.93mi |
| 17165 Prevost St Detroit, MI | 3.0 | 1.0 | 1060 | $2,400 | $2.26 | 1d | 1 | 0.97mi |
| 14375 Terry St Detroit, MI | 3.0 | 2.0 | 1300 | $1,425 | $1.10 | 43d | 1 | 1.02mi |
| 15762 Mark Twain St Detroit, MI | 3.0 | 2.0 | 1430 | $1,250 | $0.87 | 16d | 1 | 1.08mi |
| 14600 Strathmoor St Detroit, MI | 4.0 | 1.0 | 1300 | $1,450 | $1.12 | 43d | 1 | 1.12mi |
| 16757 Greenview Ave Unit 1A Detroit, MI | 3.0 | 1.5 | 1600 | $1,500 | $0.94 | 5d | 1 | 1.13mi |
| 14104 Coyle St Detroit, MI | 3.0 | 1.0 | 1327 | $1,350 | $1.02 | 5d | 1 | 1.15mi |
| 14590 Ardmore St Detroit, MI | 3.0 | 1.0 | 1200 | $1,195 | $1.00 | 2d | 1 | 1.27mi |
| 16823 Stahelin Ave Detroit, MI | 3.0 | 2.5 | 1500 | $1,600 | $1.07 | 17d | 1 | 1.27mi |
| 15387 Lesure St Detroit, MI | 3.0 | 1.0 | 1064 | $1,350 | $1.27 | 12d | 1 | 1.30mi |
| 16505 Stansbury St Detroit, MI | 3.0 | 1.0 | 1700 | $1,345 | $0.79 | 43d | 1 | 1.37mi |
| 16505 Stansbury St Detroit, MI | 3.0 | 1.0 | 1100 | $1,250 | $1.14 | 10d | 1 | 1.37mi |
| 12840 Grandmont Ave Detroit, MI | 3.0 | 1.0 | 1100 | $1,200 | $1.09 | 43d | 1 | 1.40mi |
| 13279 Coyle St Detroit, MI | 3.0 | 1.0 | 1444 | $1,373 | $0.95 | 43d | 1 | 1.41mi |
| 13581 Penrod St Detroit, MI | 4.0 | 1.0 | 1152 | $1,200 | $1.04 | 43d | 1 | 1.41mi |
| 15829 Minock St Detroit, MI | 3.0 | 1.5 | 1200 | $1,550 | $1.29 | 24d | 1 | 1.41mi |
| 14284 Cruse St Detroit, MI | 3.0 | 1.0 | 1121 | $1,150 | $1.03 | 16d | 1 | 1.44mi |
Listing history 14 events
-
2026-06-18days on market $100,000 Active 234 DOM
-
2026-06-17days on market $100,000 Active 233 DOM
-
2026-06-15days on market $100,000 Active 231 DOM
-
2026-06-13days on market $100,000 Active 229 DOM
-
2026-06-13days on market $100,000 Active 228 DOM
-
2026-06-09days on market $100,000 Active 225 DOM
-
2026-06-08days on market $100,000 Active 224 DOM
-
2026-06-07days on market $100,000 Active 223 DOM
-
2026-06-04days on market $100,000 Active 220 DOM
-
2026-06-03days on market $100,000 Active 219 DOM
-
2026-06-01days on market $100,000 Active 217 DOM
-
2026-05-31days on market $100,000 Active 216 DOM
-
2025-10-27$100,000 Active 580-char remark
Show marketing remark (579 chars)
CASH OFFERS ONLY! Lots of home for the money (1,700 square feet) the house has three bedrooms on 2nd floor one bedroom on first floor, large living room with natural fireplace, hot water heater 2022, furnace 2011, circuit breakers, lots of glass block windows on first floor, security storm doors on front and back of house, 2 car garage, house needs lots of updating and is sold in "AS IS" condition, buyers to verify all data, basement does leak. located in a very nice area! homes are selling for a lot more in this location, close to shopping, Schools and Freeways.
-
2025-10-27$100,000 Active 579-char remark
Show marketing remark (579 chars)
CASH OFFERS ONLY! Lots of home for the money (1,700 square feet) the house has three bedrooms on 2nd floor one bedroom on first floor, large living room with natural fireplace, hot water heater 2022, furnace 2011, circuit breakers, lots of glass block windows on first floor, security storm doors on front and back of house, 2 car garage, house needs lots of updating and is sold in "AS IS" condition, buyers to verify all data, basement does leak. located in a very nice area! homes are selling for a lot more in this location, close to shopping, Schools and Freeways.
ⓘ Source: listings_history table (triggers on properties + properties_extension) + one-shot
backfill from property_details.listing_events for pre-trigger history.
Tax reassessment forecast MI · Partial reset (capped growth)
- Current annual tax
- $1,017 · $85/mo
- Projected year-2 tax
- $1,278 · $107/mo
- Expected delta
- +$262/yr (+$22/mo · 25.7%)
ⓘ Screening estimate from a state-policy table — verify with the county assessor before closing.
Climate risk First Street
- Flood 1/10 Low FEMA zone X (unshaded) · 0% chance over 30 yrs
- Wildfire 1/10 Low
- Heat 3/10 Moderate 7 d/yr ≥98°F today · 15 d/yr by 30 yrs out
- Wind 2/10 Low
- Air quality 3/10 Moderate 2 unhealthy d/yr today · 5 by 30 yrs out
Nearby sold comps map
Loading sold comps map…
Walkable amenities ~0.75 mi
Loading nearby amenities…
Taxation est. · year 1
- Rental income
- $17,942
- − Mortgage interest
- −$5,602
- − Property taxes
- −$1,017
- − Insurance
- −$500
- − Repairs & maintenance
- −$1,435
- − Management
- −$1,435
- − Depreciation
- −$2,909
- Taxable income
- $5,044
- Est. tax owed @ 24.0%
- −$1,210
- After-tax cash flow
- $5,154/yr
For passive investors: Depreciation is non-cash, so a rental often shows a tax loss while cash-flowing — sheltering income. Rental losses are passive: they offset passive income freely, and up to $25,000/yr can offset ordinary (W-2) income if you actively participate and your MAGI is under $100k (phasing out to $0 by $150k); unused losses carry forward. On sale, claimed depreciation is recaptured at up to 25%, and gains may owe capital-gains tax (a 1031 exchange can defer both). Figures are a year-1 estimate at your 24.0% rate — not tax advice; consult a CPA.
Schools (NCES district)
- District
- Detroit Public Schools Community District
- NCES district ID
- 2601103
- Math proficiency
- 10% ▼ -2.00%
- Reading proficiency
- 24% ▲ 6.00%
- Median HH income
- $25,815
- Composite
- 13.06/100
- National rank
- #9564
- State rank
- #499 of 540 in MI
Livability — Detroit
- Score
- 73/100
- State rank
- #218
- US rank
- #5427
Category grades
Schools grade is shown separately in the Schools card above.
Census & demographics
- Census place
- Detroit, MI
- County
- Wayne County · 1,562,939 people
- City population
- 572,865
- Metro
- Detroit-Warren-Dearborn, MI
- Population (ZIP)
- 40,302
- Household income
- $36,527
- Rent vs Own
- Severe rent burden
- 2371.0
Population outlook (Wayne County) Hauer SSP2
- Today (2025)
- 1,675,273 people
- By 2030
- 1,620,300 · -3.3%
- By 2040
- 1,502,341 · -10.3%
- By 2050
- 1,384,039 · -17.4%
- By 2075
- 1,124,592 · -32.9%
- By 2100
- 881,193 · -47.4%
Race, ethnicity, and origin ACS 2023
- Neighborhood character
- Predominantly Black (95%)
- Race & ethnicity
- Black 95% Two or more races 3% White 1%
- Foreign-born
- 1%
- Languages at home
- 98% English-only · Spanish 1% French/Haitian/Cajun 1%
Political lean MEDSL · Wayne
- 2024 margin
- Strong D (+29.0) · D 62.7% · R 33.7% · Other 3.6%
- 2008→2024 swing
- -20.5pp toward R · 2008: 49.5pp · 2024: 29.0pp
- All cycles
- 2024: D+29.0 2020: D+38.1 2016: D+37.3 2012: D+46.9 2008: D+49.5
Not yet ingested
- Civics
- —
Market trends
- HPI YoY
- ▼ -125.00%
- Current HPI
- 186.4158
- Rent YoY
- ▲ 5.59%
- Metro
- Detroit-Warren-Dearborn, MI
- State GDP YoY
- ▲ 1.37%
- F500 in state
- 28
Industry mix (Fortune 500 HQ in MI)
| Industry | F500 HQs | Revenue |
|---|---|---|
| Automotive Parts | 3 | $48B |
|
||
| Automotive | 2 | $372B |
|
||
| Chemicals | 1 | $45B |
|
||
| Automotive Retail | 1 | $29B |
|
||
| Healthcare / Medical Devices | 1 | $23B |
|
||
| Automotive Technology | 1 | $20B |
|
||
Price history
+0.0% since first listed2 events — show timeline
- 2025-10-27 Listed $100,000 REALCOMP
- 2025-10-27 Listed $100,000 MiRealSource-MiMLS
Property tax history
-4.2%/yrLatest (2025): $1,017 · -59.8% YoY. Source: county tax records.
Cash-flow waterfall
monthlySold comps — $/sqft
last 12 mo · ≤1 miLoading sold comps…