1003 Dixon St S · Jacksonville, FL
Flood risk 1/10 · Minimal
- FEMA flood zone
- X (unshaded)
- Chance of flooding over 30 yrs
- 0.0%
- Est. flood insurance / yr
- $507 – $1,088
Fire risk 2/10 · Minimal
- Est. fire insurance / yr
- $947 – $1,759
Heat risk 9/10 · Severe
- Hot days now (above 107°F)
- 7 days/yr
- Hot days in 30 yrs
- 20 days/yr
Wind risk 9/10 · Severe
- Chance of severe wind over 30 yrs
- 99.0%
Air-quality risk 5/10 · Moderate
- Unhealthy air days now
- 7 days/yr
- Unhealthy air days in 30 yrs
- 7 days/yr
Risk factors via First Street. Map © Google.
Why this score? — see what drove the B- grade
The composite is a weighted blend of 9 inputs, each scored 0–100. Each bar is that input's sub-score; the figure is the points it added to the 100-point composite (weight × sub-score).
- Cash flow +22.3/30.0
- ARV discount +13.7/15.0
- DSCR +7.2/10.0
- Appreciation +6.7/10.0
- 1% rule +5.7/10.0
- Livability +4.2/5.0
- Schools +3.9/10.0
- Rent growth +2.9/5.0
- Condition / age +2.5/5.0
$115,000
🖨 Deal sheet 📄 Offer letter ✓ Due diligence
Listing remarks MLS
CURRENT SALE IS CURRENTLY FALLING APART. APPRAISAL IS 72,000.SELLER HAS RENOVATED ENTIRE HOME, CH&A APPROX. 5 YEARS OLD, NEW PAINT & CARPET. WINDOWS HAVE BEEN REPLACED AND BATHTUB HAS BEEN REFINISHED. CUTE AS A BUTTON!!GREAT CLOSET SPACE PLUS ALL BRICK FOR EASY MAINTENANCE. SELLER WILL INSTALL NEW RANGE AND REFRIGERATOR BEFORE CLOSING.
Key facts
- 6,098 sq ft lot
- Parking
- Built 1951
Property features AI
Exterior
- Parking: Detached carport (1 space)
- Utilities: Public sewer; Electricity available; Sewer available; Water available
- Home design: Single family residence; Property used for residential purposes
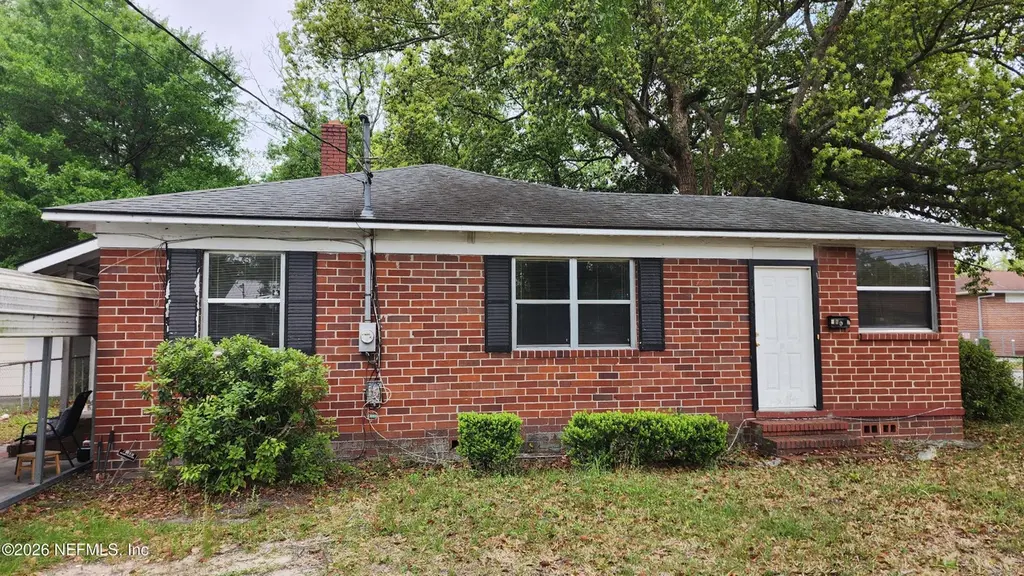
- Construction: Brick construction; Shingle roof
- Exterior features: Chain link fencing enclosing the yard; City street frontage with asphalt road surface
Interior
- Kitchen: Electric oven and electric range; Refrigerator
- Bedrooms: 3 bedrooms
- Bathrooms: 1 full bathroom
- Heating & cooling: Central heating (electric); Central air conditioning (electric)
- Interior features: Appliances include electric oven, electric range, refrigerator, and washer
- Laundry & utility: Washer included
Neighborhood map
What this means for you Summary
Snapshot
- This is a 2-bed/1.0-bath single-family listed at $115k.
Deal economics
- At list price, monthly cash flow is $190 ($2k/yr) — positive.
- The deal already cash-flows at list — no discount required.
- Meets the 1% rule at list price ($1k rent vs $115k).
- Cap rate 8.3% vs local median 4.0% in Jacksonville — top-decile yield for the area; either an underpriced asset or a hidden risk that comps aren't pricing in. Stress-test before assuming the spread holds.
Location & tenants
- Location reads 83/100 on livability (#50 in FL, #911 nationally) — a professional / high-income tenant draw. Strengths: amenities A+, commute A+, housing A+.
- Duval (urban): math 46% / reading 45% proficiency, ranked #48 of 73 in FL (top 66%) — families likely to look elsewhere, expect single-tenant / working-renter base with shorter leases.
- Market conditions: Rents rising (+1.7%/yr); 172 active listings in the ZIP; 40 comparable units currently listed for rent nearby; rentals at typical pace (median 17d on market — plan ~3-4 weeks tenant-placement turnaround); lower-income renter base — watch delinquency; 6,503 units permitted in Duval County in 2024 (1,131 in 5+ unit buildings).
- This rent runs 42% of the median local income ($35k/yr) — at the standard rent-burdened threshold; future hikes will face affordability resistance.
Forward outlook
- In year one you build about $5k of equity ($795 loan paydown + $4k appreciation (3.4% local appreciation)).
- Duval County population projected at +19% by 2050 — long-run rental-demand tailwind backs the buy-and-hold thesis.
- At projected returns (3.4% appreciation + 1.7% rent growth), your $32k cash investment doubles in ~5 years — after that, you're playing with house money.
- By year 8, paydown + projected appreciation supports a ~$35k cash-out refi (75% LTV) — recoverable capital for the next deal without selling this one.
Negotiation context
- Only 4 days on market — expect competitive offers; lowballing is unlikely to land.
- 2 sale attempts since 22y ago; this cycle's ask is 28% above the opening price — seller raised mid-cycle; expect resistance to lowballs.
- Current owner paid $74k; list at $115k implies a 55% gain — meaningful room to come down on a strong offer.
Risks & watch-outs
- Watch-outs: built in 1951 — expect roof / HVAC / electrical / plumbing capex.
- Climate carrying-cost: severe wind risk, 99% chance of damaging wind over 30y; extreme-heat days projected 7→20/yr by 2055 (HVAC capex compounding) — expect insurance premiums to compound above CPI over the hold.
Questions for the listing agent
- Built in 1951 — when were the roof, HVAC, electrical panel, plumbing, and water heater last replaced?
- Is there a deadline driving the sale (1031 exchange, divorce, estate, relocation)? That informs how much negotiation room exists.
- Schools are B-rated — typically a magnet for longer-tenancy family renters. What's the average tenant stay here, and is there a school-zone premium baked into asking?
- What's the average days-on-market for RENTAL listings here right now (not sales)? A rising rental-DOM trend means longer vacancies and softer asking-rent achievability than the comps imply.
- What's the recent tenant-quality profile in this submarket — average credit score on applications, eviction rate, late-payment / NSF rate, and stable-employment percentage? A property-management company in the area should have these aggregated.
- How much new for-sale + rental construction is in the pipeline within 1–3 miles? Heavy new supply typically softens prices + rents 12–24 months out; constrained supply supports both.
Investment metrics
- 1% rule
- 1.07% ✓
- Cap rate
- 8.28%
- Cash-on-cash
- 7.09%
- DSCR
- 1.32
- GRM
- 7.8
CMA / ARV
- ARV (on-the-fly)
- $133,440
- Comps found
- 12
Show comp detail 12 sales within ~0.75 mi
| Address | Dist | Beds/Ba | Sqft | Sold | Price | $/sf | Match |
|---|---|---|---|---|---|---|---|
| 954 Allison St | 0.10mi | 3/1.5 (+1) | 1,084 (-2%) | 1mo | $130,000 | $120 | 84 |
| 941 Huron St | 0.21mi | 3/1.0 (+1) | 1,208 (+9%) | 2mo | $125,000 | $103 | 69 |
| 1227 Dena St | 0.36mi | 3/1.0 (+1) | 1,033 (-7%) | 5mo | $55,000 | $53 | 62 |
| 2667 Amy St | 0.49mi | 3/1.0 (+1) | 1,038 (-7%) | 0mo | $117,000 | $113 | 61 |
| 3130 Mell Ct | 0.47mi | 3/2.0 (+1) | 1,056 (-5%) | 1mo | $180,000 | $170 | 60 |
| 2952 W 8th St | 0.67mi | 3/1.5 (+1) | 1,119 (+1%) | 3mo | $95,000 | $85 | 58 |
| 1050 Hood Ave | 0.53mi | 3/1.0 (+1) | 1,051 (-6%) | 4mo | $73,000 | $69 | 58 |
| 1056 Hood Ave | 0.53mi | 3/1.0 (+1) | 1,024 (-8%) | 2mo | $154,500 | $151 | 55 |
| 3242 Deason Ave | 0.53mi | 3/2.0 (+1) | 1,197 (+8%) | 2mo | $223,500 | $187 | 52 |
| 2908 Broadway Ave | 0.28mi | 3/2.5 (+1) | 1,268 (+14%) | 1mo | $185,000 | $146 | 52 |
| 3125 3rd St Cir S | 0.41mi | 3/2.0 (+1) | 1,224 (+10%) | 4mo | $148,500 | $121 | 52 |
| 1630 Detroit St | 0.61mi | 3/2.0 (+1) | 976 (-12%) | 4mo | $106,000 | $109 | 39 |
Match score weights: distance 35% · size 25% · config 20% · recency 20%. Top-matched comps best support the ARV.
Projected returns pro-forma
3.41% appreciation · 1.7% rent growth · sell at horizon
- IRR
- 14.4%
- Equity multiple
- 1.84×
- Total profit
- $26,922
- Equity at exit
- $54,403
- IRR
- 15.3%
- Equity multiple
- 3.29×
- Total profit
- $73,719
- Equity at exit
- $85,998
Cash invested: $32,200 (down + closing). Projections, not guarantees.
Landlord ↔ Tenant lean methodology
- Overall (STATE)
- 87 Strongly Landlord-Friendly
- State Florida
- 87 Strongly Landlord-Friendly · R+3
- County
- — inherits STATE
- City
- — inherits STATE
ZIP-level market 32254
- Home prices YoY
- 1.2%
- Rents YoY
- 1.7%
- Active inventory
- 172
- Price-to-rent
- 7.8×
Monthly cashflow live
- Estimated rent
- $1,236 high interval (Pro) →
- Mortgage (P&I)
- −$603
- Tax from tax record
- −$135 /mo · $1,620/yr
- Insurance
- −$48
- HOA
- −$0
- Vacancy / Maint / Mgmt
- −$260
- Net cashflow
- $190
Break-even live
UW: 25.0% down · 7.5% · 30yr · 1.5% tax · 5.0% vac · 8.0% maint · 8.0% mgmt
Financing live
Cash to close
- Down payment
- $28,750
- Closing costs
- $3,450
- Reserves months
- —
- Total cash needed
- —
Loan-product check · same deal, 3 products live
Conventional
25% down · 7.5% · 30yr
- Down + closing
- —
- Monthly P&I
- —
- Monthly cashflow
- —
- DSCR
- —
- Eligible?
- —
Personal DTI + credit; lowest rate.
DSCR
20% down · 8.5% · 30yr
- Down + closing
- —
- Monthly P&I
- —
- Monthly cashflow
- —
- DSCR
- —
- Eligible?
- —
No personal income docs; deal must DSCR.
Hard money
10% down · 12.0% · 12mo
- Down + closing
- —
- Monthly P&I
- —
- Monthly cashflow
- —
- DSCR
- —
- Eligible?
- —
Short-term bridge; refi at stabilization.
Rent comps 40 comps
| Address | Beds | Baths | Sqft | Rent | $/sqft | DOM | Units | Dist |
|---|---|---|---|---|---|---|---|---|
| 1037 Detroit St Jacksonville, FL | 3.0 | 2.0 | 912 | $1,250 | $1.37 | 1d | 1 | 0.08mi |
| 2851 Sophia St Jacksonville, FL | 2.0 | 1.0 | 846 | $1,000 | $1.18 | 23d | 3 | 0.16mi |
| 912 Huron St Jacksonville, FL | 2.0 | 1.0 | 900 | $1,100 | $1.22 | 14d | 1 | 0.21mi |
| 3034 Detroit Cir E Jacksonville, FL | 3.0 | 2.0 | 1300 | $1,399 | $1.08 | 23d | 1 | 0.21mi |
| 2862 W 1st St Jacksonville, FL | 2.0 | 1.0 | 800 | $895 | $1.12 | 3d | 1 | 0.21mi |
| 2862 W 1st St Unit 1 Jacksonville, FL | 2.0 | 1.0 | 800 | $895 | $1.12 | 14d | 1 | 0.21mi |
| 2852 W 1st St Jacksonville, FL | 2.0 | 1.0 | 800 | $895 | $1.12 | 7d | 1 | 0.22mi |
| 3012 Imperial St Jacksonville, FL | 3.0 | 1.0 | 1089 | $1,395 | $1.28 | 23d | 1 | 0.27mi |
| 2913 W 2nd St Jacksonville, FL | 2.0 | 1.0 | 720 | $1,000 | $1.39 | 1d | 1 | 0.29mi |
| 3055 2nd Street Cir Jacksonville, FL | 3.0 | 1.5 | 1050 | $1,340 | $1.28 | 17d | 1 | 0.35mi |
| 1227 Dena St Jacksonville, FL | 3.0 | 1.0 | 1033 | $1,325 | $1.28 | 23d | 1 | 0.35mi |
| 841 Ontario St Jacksonville, FL | 2.0 | 1.0 | 1000 | $1,285 | $1.28 | 23d | 1 | 0.37mi |
| 3101 3rd Street Cir N Jacksonville, FL | 2.0 | 1.0 | 870 | $1,150 | $1.32 | 7d | 1 | 0.40mi |
| 1021 Woodstock Ave Jacksonville, FL | 3.0 | 2.0 | 1012 | $1,495 | $1.48 | 23d | 1 | 0.41mi |
| 1021 Woodstock Ave Jacksonville, FL | 3.0 | 2.0 | 1012 | $1,495 | $1.48 | 7d | 1 | 0.41mi |
| 2965 Sunset St Jacksonville, FL | 3.0 | 2.0 | 1056 | $1,375 | $1.30 | 3d | 1 | 0.44mi |
| 2965 Sunset St Jacksonville, FL | 3.0 | 1.5 | 1056 | $1,375 | $1.30 | 7d | 1 | 0.44mi |
| 2902 W 5th St Jacksonville, FL | 3.0 | 2.0 | 1379 | $1,050 | $0.76 | 7d | 1 | 0.47mi |
| 1305 Melson Ave Jacksonville, FL | 3.0 | 2.0 | 1224 | $1,399 | $1.14 | 20d | 1 | 0.47mi |
| 3303 Broadway Ave Jacksonville, FL | 3.0 | 2.0 | 1072 | $1,550 | $1.45 | 3d | 1 | 0.54mi |
| 2939 W 6th St Jacksonville, FL | 3.0 | 2.0 | 1269 | $1,225 | $0.97 | 1d | 1 | 0.55mi |
| 2587 Orchard St Jacksonville, FL | 2.0 | 2.0 | 992 | $1,295 | $1.31 | 7d | 1 | 0.56mi |
| 3368 Columbus Ave Jacksonville, FL | 2.0 | 1.0 | 955 | $1,300 | $1.36 | 4d | 1 | 0.56mi |
| 1612 Alfen St Jacksonville, FL | 3.0 | 1.5 | 945 | $1,113 | $1.18 | 7d | 1 | 0.58mi |
| 3326 W 1st St Jacksonville, FL | 2.0 | 1.0 | 791 | $995 | $1.26 | 23d | 1 | 0.58mi |
| 3305 Sunnybrook Ave N Jacksonville, FL | 2.0 | 1.0 | 1012 | $1,021 | $1.01 | 23d | 1 | 0.61mi |
| 3350 Sunnybrook Ave N Jacksonville, FL | 2.0 | 1.0 | 900 | $1,095 | $1.22 | 23d | 1 | 0.68mi |
| 3450 Lowell Ave Jacksonville, FL | 3.0 | 2.0 | 1209 | $1,578 | $1.31 | 23d | 1 | 0.71mi |
| 3433 Brookhaven Dr Jacksonville, FL | 2.0 | 1.0 | 754 | $1,295 | $1.72 | 7d | 1 | 0.77mi |
| 2410 McQuade St Jacksonville, FL | 3.0 | 2.0 | 1307 | $1,425 | $1.09 | 23d | 1 | 0.78mi |
| 3688 Dillon St Jacksonville, FL | 3.0 | 2.0 | 1230 | $1,421 | $1.16 | 23d | 1 | 0.82mi |
| 3352 Dillon St Jacksonville, FL | 3.0 | 2.0 | 1229 | $1,372 | $1.12 | 23d | 1 | 0.84mi |
| 3515 Dignan St Jacksonville, FL | 3.0 | 1.0 | 915 | $1,036 | $1.13 | 2d | 1 | 0.85mi |
| 2939 W 11th St Jacksonville, FL | 3.0 | 1.0 | 1086 | $1,295 | $1.19 | 23d | 1 | 0.86mi |
| 2325 Westbrook Cir N Jacksonville, FL | 3.0 | 2.0 | 812 | $1,200 | $1.48 | 23d | 1 | 0.89mi |
| 3318 Dignan St Jacksonville, FL | 3.0 | 2.0 | 960 | $1,200 | $1.25 | 23d | 1 | 0.90mi |
| 2854 Wickwire St Jacksonville, FL | 2.0 | 1.0 | 948 | $1,300 | $1.37 | 3d | 1 | 0.90mi |
| 3323 Nolan St Jacksonville, FL | 3.0 | 1.0 | 927 | $1,050 | $1.13 | 1d | 1 | 0.92mi |
| 1213 Moat St Jacksonville, FL | 2.0 | 2.5 | 1022 | $1,283 | $1.26 | 17d | 1 | 0.93mi |
| 3319 Hunt St Jacksonville, FL | 3.0 | 1.0 | 924 | $1,295 | $1.40 | 23d | 1 | 0.96mi |
Listing history 11 events
-
2026-06-09days on market $115,000 Active 4 DOM
-
2026-06-08days on market $115,000 Active 3 DOM
-
2026-06-07pricestatusdays on market $115,000 Active 2 DOM
-
2026-04-30status Pending
-
2026-04-09$89,950 Active
-
2004-08-16soldstatus $74,000
-
2004-08-10historical 345-char remark
Show marketing remark (345 chars)
CURRENT SALE IS CURRENTLY FALLING APART. APPRAISAL IS 72,000.SELLER HAS RENOVATED ENTIRE HOME, CH&A APPROX. 5 YEARS OLD, NEW PAINT & CARPET. WINDOWS HAVE BEEN REPLACED AND BATHTUB HAS BEEN REFINISHED. CUTE AS A BUTTON!!GREAT CLOSET SPACE PLUS ALL BRICK FOR EASY MAINTENANCE. SELLER WILL INSTALL NEW RANGE AND REFRIGERATOR BEFORE CLOSING.
-
2004-08-06soldstatus $74,000 345-char remark
Show marketing remark (345 chars)
CURRENT SALE IS CURRENTLY FALLING APART. APPRAISAL IS 72,000.SELLER HAS RENOVATED ENTIRE HOME, CH&A APPROX. 5 YEARS OLD, NEW PAINT & CARPET. WINDOWS HAVE BEEN REPLACED AND BATHTUB HAS BEEN REFINISHED. CUTE AS A BUTTON!!GREAT CLOSET SPACE PLUS ALL BRICK FOR EASY MAINTENANCE. SELLER WILL INSTALL NEW RANGE AND REFRIGERATOR BEFORE CLOSING.
-
2004-02-11$69,000 345-char remark
Show marketing remark (345 chars)
CURRENT SALE IS CURRENTLY FALLING APART. APPRAISAL IS 72,000.SELLER HAS RENOVATED ENTIRE HOME, CH&A APPROX. 5 YEARS OLD, NEW PAINT & CARPET. WINDOWS HAVE BEEN REPLACED AND BATHTUB HAS BEEN REFINISHED. CUTE AS A BUTTON!!GREAT CLOSET SPACE PLUS ALL BRICK FOR EASY MAINTENANCE. SELLER WILL INSTALL NEW RANGE AND REFRIGERATOR BEFORE CLOSING.
-
1982-08-06soldstatus $29,000
-
1981-10-01soldstatus $30,500
ⓘ Source: listings_history table (triggers on properties + properties_extension) + one-shot
backfill from property_details.listing_events for pre-trigger history.
Tax reassessment forecast FL · Resets to sale price
- Current annual tax
- $1,620 · $135/mo
- Projected year-2 tax
- $1,620 · $135/mo
- Expected delta
- $0/yr ($0/mo · 0.0%)
ⓘ Screening estimate from a state-policy table — verify with the county assessor before closing.
Climate risk First Street
- Flood 1/10 Low FEMA zone X (unshaded) · 0% chance over 30 yrs
- Wildfire 2/10 Low
- Heat 9/10 Extreme 7 d/yr ≥107°F today · 20 d/yr by 30 yrs out
- Wind 9/10 Extreme 99% chance of damaging wind over 30 yrs
- Air quality 5/10 Major 7 unhealthy d/yr today · 7 by 30 yrs out
Nearby sold comps map
Loading sold comps map…
Walkable amenities ~0.75 mi
Loading nearby amenities…
Taxation est. · year 1
- Rental income
- $14,829
- − Mortgage interest
- −$6,442
- − Property taxes
- −$1,620
- − Insurance
- −$575
- − Repairs & maintenance
- −$1,186
- − Management
- −$1,186
- − Depreciation
- −$3,345
- Taxable income
- $474
- Est. tax owed @ 24.0%
- −$114
- After-tax cash flow
- $2,169/yr
For passive investors: Depreciation is non-cash, so a rental often shows a tax loss while cash-flowing — sheltering income. Rental losses are passive: they offset passive income freely, and up to $25,000/yr can offset ordinary (W-2) income if you actively participate and your MAGI is under $100k (phasing out to $0 by $150k); unused losses carry forward. On sale, claimed depreciation is recaptured at up to 25%, and gains may owe capital-gains tax (a 1031 exchange can defer both). Figures are a year-1 estimate at your 24.0% rate — not tax advice; consult a CPA.
Schools (NCES district)
- District
- Duval
- NCES district ID
- 1200480
- Math proficiency
- 46% ▼ -11.00%
- Reading proficiency
- 45% ▼ -4.00%
- Median HH income
- $48,987
- Composite
- 38.97/100
- National rank
- #4076
- State rank
- #48 of 73 in FL
Livability — Jacksonville
- Score
- 83/100
- State rank
- #50
- US rank
- #911
Category grades
Schools grade is shown separately in the Schools card above.
Census & demographics
- Census place
- Jacksonville, FL
- County
- Duval County · 1,015,274 people
- City population
- 979,034
- Metro
- Jacksonville, FL
- Population (ZIP)
- 13,927
- Household income
- $34,953
- Rent vs Own
- Severe rent burden
- 882.0
Population outlook (Duval County) Hauer SSP2
- Today (2025)
- 1,013,010 people
- By 2030
- 1,059,228 · +4.6%
- By 2040
- 1,141,439 · +12.7%
- By 2050
- 1,205,258 · +19.0%
- By 2075
- 1,324,282 · +30.7%
- By 2100
- 1,319,620 · +30.3%
Race, ethnicity, and origin ACS 2023
- Neighborhood character
- Diverse neighborhood (Simpson 0.56)
- Race & ethnicity
- Black 60% White 28% Two or more races 7% Hispanic / Latino 5%
- Hispanic origin (detail)
- Puerto Rican 1%
- Common ancestry
- Slovak 1% Hispanic 1% Lithuanian 1%
- Foreign-born
- 4% · Canada
- Languages at home
- 94% English-only · Spanish 4% French/Haitian/Cajun 2%
Political lean MEDSL · Duval
- 2024 margin
- Toss-up / Even · D 48.7% · R 50.1% · Other 1.2%
- 2008→2024 swing
- +0.4pp no change · 2008: -1.9pp · 2024: -1.5pp
- All cycles
- 2024: R+1.5 2020: D+3.8 2016: R+1.5 2012: R+3.6 2008: R+1.9
Not yet ingested
- Civics
- —
Market trends
- HPI YoY
- ▲ 3.41%
- Current HPI
- 282.2981
- Rent YoY
- ▲ 1.70%
- Metro
- Jacksonville, FL
- State GDP YoY
- ▲ 3.28%
- F500 in state
- 36
Industry mix (Fortune 500 HQ in FL)
| Industry | F500 HQs | Revenue |
|---|---|---|
| Industrial Technology | 2 | $29B |
|
||
| Insurance | 2 | $17B |
|
||
| Retail | 1 | $60B |
|
||
| Technology Distribution | 1 | $58B |
|
||
| Homebuilding | 1 | $35B |
|
||
| Technology Manufacturing | 1 | $35B |
|
||
Price history
+194.9% since first listed8 events — show timeline
- 2026-04-30 Pending — realMLS
- 2026-04-09 Listed $89,950 realMLS
- 2004-08-16 Sold (Public Records) $74,000 Public Records
- 2004-08-10 Listing Removed — realMLS
- 2004-08-06 Sold (MLS) $74,000 realMLS
- 2004-02-11 Listed $69,000 realMLS
- 1982-08-06 Sold (Public Records) $29,000 Public Records
- 1981-10-01 Sold (Public Records) $30,500 Public Records
Property tax history
+4.2%/yrLatest (2025): $1,620 · +27.1% YoY. Source: county tax records.
Cash-flow waterfall
monthlySold comps — $/sqft
last 12 mo · ≤1 miLoading sold comps…