 Duplex
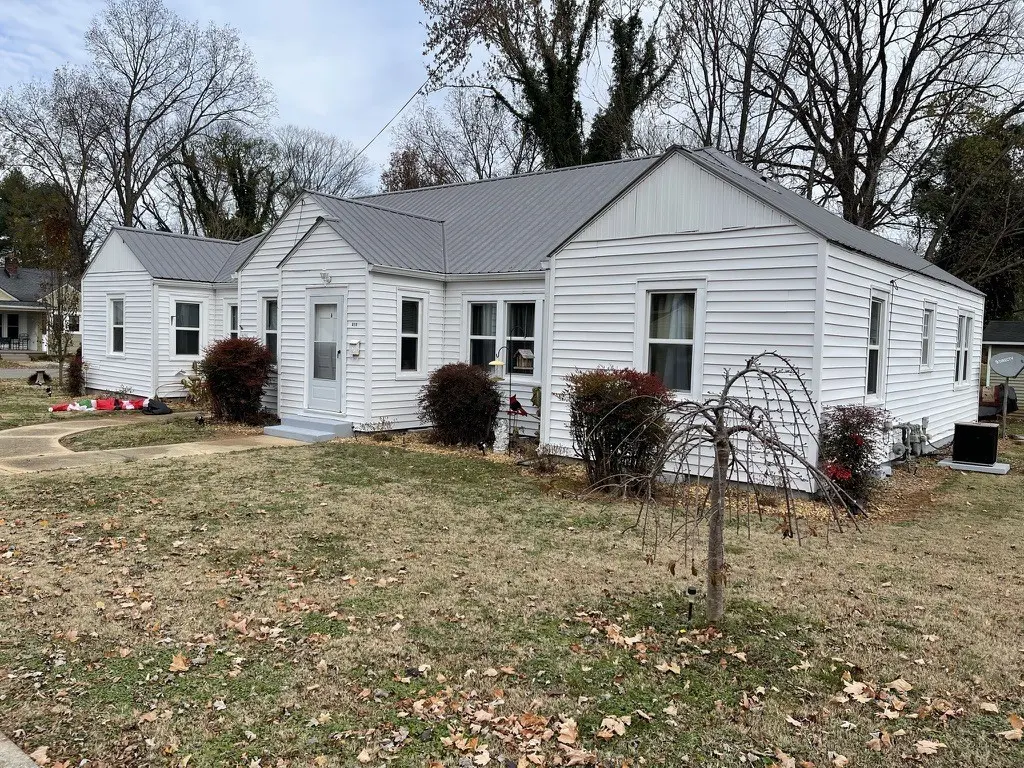
810 N High St · Winchester, TN
Flood risk 1/10 · Minimal
- FEMA flood zone
- X (unshaded)
- Chance of flooding over 30 yrs
- 0.0%
- Est. flood insurance / yr
- $507 – $1,088
Fire risk 3/10 · Minor
- Est. fire insurance / yr
- $949 – $1,763
Heat risk 5/10 · Moderate
- Hot days now (above 105°F)
- 7 days/yr
- Hot days in 30 yrs
- 20 days/yr
Wind risk 4/10 · Minor
- Chance of severe wind over 30 yrs
- 12.0%
Air-quality risk 2/10 · Minimal
- Unhealthy air days now
- 2 days/yr
- Unhealthy air days in 30 yrs
- 2 days/yr
Risk factors via First Street. Map © Google.
Why this score? — see what drove the B- grade
The composite is a weighted blend of 9 inputs, each scored 0–100. Each bar is that input's sub-score; the figure is the points it added to the 100-point composite (weight × sub-score).
- Cash flow +30.0/30.0
- ARV discount +10.8/15.0
- DSCR +10.0/10.0
- 1% rule +8.4/10.0
- Livability +3.2/5.0
- Rent growth +2.5/5.0
- Condition / age +2.5/5.0
- Schools +1.7/10.0
- Appreciation +0.0/10.0
$265,000
🖨 Deal sheet 📄 Offer letter ✓ Due diligence
Multi-family units
County records classify this as Multi-Family (2-4 Unit). Listing-text estimate: 2 units. confirmed
Listing remarks MLS
Duplex in great location. Convenient to lake, marina and downtown.
Key facts
- 9,200 sq ft lot
- Built 1946
- Listed 44 days
Property features AI
Finance
- Financial info: Gross income reported as $23,400; Net operating income reported as $23,400; Tenants are responsible for electricity, gas, and water; Owner pays: none listed
Exterior
- Parking: No designated parking spaces listed
- Utilities: Public water; Public sewer; Water available
- Home design: Duplex (attached residential income property); One story
- Construction: Vinyl siding
- Exterior features: Corner lot (92 x 100); Public water available; Public sewer
Interior
- Bedrooms: Two 2-bedroom units (each unit has 2 bedrooms)
- Flooring: Wood flooring; Tile flooring
- Bathrooms: Each unit has 1 bathroom
- Heating & cooling: Central heating; Central air conditioning
- Interior features: Wood and tile flooring; Central heating and central air
- Laundry & utility: Individual laundry hookups with washer hookup and electric dryer hookup
Neighborhood map
What this means for you Summary
Snapshot
- This is a 2 × 2-bed/1.0-bath units multifamily listed at $265k.
Deal economics
- At list price, monthly cash flow is $1k ($15k/yr) — positive. Per door: $608/mo.
- The deal already cash-flows at list — no discount required.
- Meets the 1% rule at list price ($4k rent vs $265k).
- Recommended offer: $257k (3.0% below list) — sets the bar for market timing.
- Cap rate 11.8% vs local median 3.0% in Winchester — top-decile yield for the area; either an underpriced asset or a hidden risk that comps aren't pricing in. Stress-test before assuming the spread holds.
Location & tenants
- Location reads 65/100 on livability (#149 in TN) — a middle-class / working-renter tenant base. Strengths: cost of living A+, housing A+; Watch: employment C-, crime D, amenities D-.
- Franklin County (town): math 18% / reading 22% proficiency, ranked #111 of 139 in TN (top 80%) — low school quality limits family demand, transient renter base, plan for 1-2y turnover.
- Zoned schools: Clark Memorial School (math 14% / reading 27%, grade F, #637 of 952 statewide, top 68%, 489 students, 0% FRL); Franklin Co High School (math 5% / reading 22%, grade F, #255 of 332 statewide, top 77%, 1,180 students, 0% FRL) — zoned schools average 0% FRL vs 48% district-wide (48 pts lower); this property's tenant base skews higher-income than the district average.
- Market conditions: 324 active listings in the ZIP; 422 units permitted in Franklin County in 2024 (5 in 5+ unit buildings).
Forward outlook
- Local home prices are declining (-3.0%/yr); year-one equity from $2k of loan paydown is wiped out by about $8k of value loss. Plan a longer hold.
- Franklin County population projected at +6% by 2050 — modest demand growth; plan on rents tracking national, not racing it.
- At projected returns (-3.0% appreciation + 3.0% rent growth), your $74k cash investment doubles in ~7 years — after that, you're playing with house money.
Negotiation context
- It's been on market 45 days — a 3% lower offer ($257k) is reasonable based on typical stale-listing flexibility.
- 3 sale attempts since 8y ago with the ask held roughly flat each time — persistent listings suggest the price (not the market) is what's stuck; bring a comps-based counter.
- Current owner paid $164k; list at $265k implies a 62% gain — meaningful room to come down on a strong offer.
Risks & watch-outs
- Watch-outs: built in 1946 — expect roof / HVAC / electrical / plumbing capex.
- Climate carrying-cost: extreme-heat days projected 7→20/yr by 2055 (HVAC capex compounding) — expect insurance premiums to compound above CPI over the hold.
Questions for the listing agent
- It's been on market 45 days. Have you received any prior offers? Is the seller open to a 3% concession, seller financing, or rate buy-down credit?
- Can we see the unit-by-unit rent roll, current vacancy, and any below-market leases? What's the average tenancy length?
- What capital expenditures (roof, boiler, parking lot, exteriors) have been made in the last 5 years, and what's planned in the next 2?
- Built in 1946 — when were the roof, HVAC, electrical panel, plumbing, and water heater last replaced?
- Is there a deadline driving the sale (1031 exchange, divorce, estate, relocation)? That informs how much negotiation room exists.
- Schools are F-rated, which usually means shorter tenancies and higher turnover. Who's the typical renter profile here, and what's been the actual vacancy rate?
- Crime grade is D in this area — have there been break-ins, vandalism, or insurance claims at this property in the last 3 years? What carrier currently insures it and at what premium?
- What's the average days-on-market for RENTAL listings here right now (not sales)? A rising rental-DOM trend means longer vacancies and softer asking-rent achievability than the comps imply.
- What's the recent tenant-quality profile in this submarket — average credit score on applications, eviction rate, late-payment / NSF rate, and stable-employment percentage? A property-management company in the area should have these aggregated.
- How much new apartment / multifamily construction is in the pipeline within 1–3 miles? Heavy new supply (>2% of stock underway) typically softens rents 12–24 months out; light construction supports rent growth.
Investment metrics
- 1% rule
- 1.34% ✓
- Cap rate
- 11.80%
- Cash-on-cash
- 19.67%
- DSCR
- 1.88
- GRM
- 6.2
CMA / ARV
- ARV (on-the-fly)
- $285,640
- Comps found
- 1
Show comp detail 1 sale within ~0.75 mi
| Address | Dist | Beds/Ba | Sqft | Sold | Price | $/sf | Match |
|---|---|---|---|---|---|---|---|
| 233 Duncan Ln S | 0.71mi | 4/2.0 | 1,924 (-0%) | 17mo | $285,000 | $148 | 52 |
Match score weights: distance 35% · size 25% · config 20% · recency 20%. Top-matched comps best support the ARV.
Projected returns pro-forma
-3.0% appreciation · 3.0% rent growth · sell at horizon
- IRR
- 11.7%
- Equity multiple
- 1.46×
- Total profit
- $34,429
- Equity at exit
- $39,512
- IRR
- 20.7%
- Equity multiple
- 2.74×
- Total profit
- $129,339
- Equity at exit
- $22,912
Cash invested: $74,200 (down + closing). Projections, not guarantees.
Landlord ↔ Tenant lean methodology
- Overall (STATE)
- 87 Strongly Landlord-Friendly
- State Tennessee
- 87 Strongly Landlord-Friendly · R+13
- County
- — inherits STATE
- City
- — inherits STATE
ZIP-level market 37398
- Home prices YoY
- -21.1%
- Active inventory
- 324
- Price-to-rent
- 12.4×
Monthly cashflow live
- Estimated rent
- $3,548 medium interval (Pro) →
- Mortgage (P&I)
- −$1,390
- Tax from tax record
- −$86 /mo · $1,038/yr
- Insurance
- −$110
- HOA
- −$0
- Vacancy / Maint / Mgmt
- −$745
- Net cashflow
- $1,216
Break-even live
2-unit breakdown (identical units grouped — click to expand)
| Units | Beds | Baths | Est. rent |
|---|---|---|---|
| 2× units | 2 | 1 | $3,548 |
| #1 | 2 | 1 | $1,774 |
| #2 | 2 | 1 | $1,774 |
| Total (2 units) | $3,548 | ||
UW: 25.0% down · 7.5% · 30yr · 1.5% tax · 5.0% vac · 8.0% maint · 8.0% mgmt
Financing live
Cash to close
- Down payment
- $66,250
- Closing costs
- $7,950
- Reserves months
- —
- Total cash needed
- —
Loan-product check · same deal, 3 products live
Conventional
25% down · 7.5% · 30yr
- Down + closing
- —
- Monthly P&I
- —
- Monthly cashflow
- —
- DSCR
- —
- Eligible?
- —
Personal DTI + credit; lowest rate.
DSCR
20% down · 8.5% · 30yr
- Down + closing
- —
- Monthly P&I
- —
- Monthly cashflow
- —
- DSCR
- —
- Eligible?
- —
No personal income docs; deal must DSCR.
Hard money
10% down · 12.0% · 12mo
- Down + closing
- —
- Monthly P&I
- —
- Monthly cashflow
- —
- DSCR
- —
- Eligible?
- —
Short-term bridge; refi at stabilization.
Listing history 26 events
-
2026-06-19days on market $265,000 Active 45 DOM
-
2026-06-18days on market $265,000 Active 44 DOM
-
2026-06-17days on market $265,000 Active 43 DOM
-
2026-06-16days on market $265,000 Active 42 DOM
-
2026-06-15days on market $265,000 Active 41 DOM
-
2026-06-14days on market $265,000 Active 39 DOM
-
2026-06-13days on market $265,000 Active 38 DOM
-
2026-06-10days on market $265,000 Active 36 DOM
-
2026-06-09days on market $265,000 Active 35 DOM
-
2026-06-08days on market $265,000 Active 34 DOM
-
2026-06-07pricedays on market $265,000 Active 33 DOM
-
2026-06-05days on market $275,000 Active 30 DOM
-
2026-06-03days on market $275,000 Active 29 DOM
-
2026-06-02days on market $275,000 Active 28 DOM
-
2026-06-01days on market $275,000 Active 27 DOM
-
2026-05-31days on market $275,000 Active 26 DOM
-
2026-05-30days on market $275,000 Active 25 DOM
-
2026-05-05$275,000 Active
-
2022-01-19soldstatus $164,000 Closed 66-char remark
Show marketing remark (66 chars)
Duplex in great location. Convenient to lake, marina and downtown.
-
2021-12-06status Pending 66-char remark
Show marketing remark (66 chars)
Duplex in great location. Convenient to lake, marina and downtown.
-
2021-12-03$183,000 Active 66-char remark
Show marketing remark (66 chars)
Duplex in great location. Convenient to lake, marina and downtown.
-
2018-02-28soldstatus $63,000 Closed 46-char remark
Show marketing remark (46 chars)
Duplex in great location. No Sign on property.
-
2018-02-13status Pending 46-char remark
Show marketing remark (46 chars)
Duplex in great location. No Sign on property.
-
2018-02-09$69,000 Active 46-char remark
Show marketing remark (46 chars)
Duplex in great location. No Sign on property.
-
2005-11-01soldstatus $50,000
-
2000-05-31soldstatus $44,000
ⓘ Source: listings_history table (triggers on properties + properties_extension) + one-shot
backfill from property_details.listing_events for pre-trigger history.
Tax reassessment forecast TN · Resets to sale price
- Current annual tax
- $1,038 · $86/mo
- Projected year-2 tax
- $1,882 · $157/mo
- Expected delta
- +$844/yr (+$70/mo · 81.3%)
ⓘ Screening estimate from a state-policy table — verify with the county assessor before closing.
Climate risk First Street
- Flood 1/10 Low FEMA zone X (unshaded) · 0% chance over 30 yrs
- Wildfire 3/10 Moderate
- Heat 5/10 Major 7 d/yr ≥105°F today · 20 d/yr by 30 yrs out
- Wind 4/10 Moderate 12% chance of damaging wind over 30 yrs
- Air quality 2/10 Low 2 unhealthy d/yr today · 2 by 30 yrs out
Nearby sold comps map
Loading sold comps map…
Walkable amenities ~0.75 mi
Loading nearby amenities…
Taxation est. · year 1
- Rental income
- $42,576
- − Mortgage interest
- −$14,844
- − Property taxes
- −$1,038
- − Insurance
- −$1,325
- − Repairs & maintenance
- −$3,406
- − Management
- −$3,406
- − Depreciation
- −$7,709
- Taxable income
- $10,848
- Est. tax owed @ 24.0%
- −$2,603
- After-tax cash flow
- $11,992/yr
For passive investors: Depreciation is non-cash, so a rental often shows a tax loss while cash-flowing — sheltering income. Rental losses are passive: they offset passive income freely, and up to $25,000/yr can offset ordinary (W-2) income if you actively participate and your MAGI is under $100k (phasing out to $0 by $150k); unused losses carry forward. On sale, claimed depreciation is recaptured at up to 25%, and gains may owe capital-gains tax (a 1031 exchange can defer both). Figures are a year-1 estimate at your 24.0% rate — not tax advice; consult a CPA.
Schools (NCES district)
- District
- Franklin County
- NCES district ID
- 4701290
- Math proficiency
- 18% ▼ -9.00%
- Reading proficiency
- 22% ▼ -8.00%
- Median HH income
- $43,108
- Composite
- 17.24/100
- National rank
- #9094
- State rank
- #111 of 139 in TN
Livability — Winchester
- Score
- 65/100
- State rank
- #149
- US rank
- #13341
Category grades
Schools grade is shown separately in the Schools card above.
Census & demographics
- Census place
- Winchester, TN
- Population (ZIP)
- 15,712
Population outlook (Franklin County) Hauer SSP2
- Today (2025)
- 42,858 people
- By 2030
- 43,540 · +1.6%
- By 2040
- 44,623 · +4.1%
- By 2050
- 45,523 · +6.2%
- By 2075
- 48,954 · +14.2%
- By 2100
- 50,170 · +17.1%
Race, ethnicity, and origin ACS 2023
- Neighborhood character
- Predominantly White (81%)
- Race & ethnicity
- White 81% Hispanic / Latino 7% Black 7% Two or more races 6% Asian 1%
- Hispanic origin (detail)
- Mexican 4%
- Common ancestry
- Serbian 2% Lithuanian 2% Slovak 1%
- Foreign-born
- 4% · Canada
- Languages at home
- 93% English-only · Spanish 5% Other Indo-European 1% German/W. Germanic 1%
Political lean MEDSL · Franklin
- 2024 margin
- Solid R (+53.2) · D 23.0% · R 76.1%
- 2008→2024 swing
- -30.6pp toward R · 2008: -22.5pp · 2024: -53.2pp
- All cycles
- 2024: R+53.2 2020: R+47.7 2016: R+43.7 2012: R+28.9 2008: R+22.5
Not yet ingested
- Civics
- —
Market trends
- HPI YoY
- ▼ -89.03%
- Current HPI
- 333.839
- Rent YoY
- —
- Metro
- —
- State GDP YoY
- ▲ 2.78%
- F500 in state
- 22
Industry mix (Fortune 500 HQ in TN)
| Industry | F500 HQs | Revenue |
|---|---|---|
| Healthcare | 3 | $91B |
|
||
| Retail | 3 | $72B |
|
||
| Transportation / Logistics | 1 | $88B |
|
||
| Paper / Packaging | 1 | $19B |
|
||
| Insurance | 1 | $13B |
|
||
| Energy | 1 | $12B |
|
||
Price history
+525.0% since first listed9 events — show timeline
- 2026-05-05 Listed $275,000 REALTRACS as Distributed by MLS Grid
- 2022-01-19 Sold (MLS) $164,000 REALTRACS as Distributed by MLS Grid
- 2021-12-06 Pending — REALTRACS as Distributed by MLS Grid
- 2021-12-03 Listed $183,000 REALTRACS as Distributed by MLS Grid
- 2018-02-28 Sold (MLS) $63,000 REALTRACS as Distributed by MLS Grid
- 2018-02-13 Pending — REALTRACS as Distributed by MLS Grid
- 2018-02-09 Listed $69,000 REALTRACS as Distributed by MLS Grid
- 2005-11-01 Sold (Public Records) $50,000 Public Records
- 2000-05-31 Sold (Public Records) $44,000 Public Records
Property tax history
+4.7%/yrLatest (2025): $1,038 · +0.0% YoY. Source: county tax records.
Cash-flow waterfall
monthlySold comps — $/sqft
last 12 mo · ≤1 miLoading sold comps…