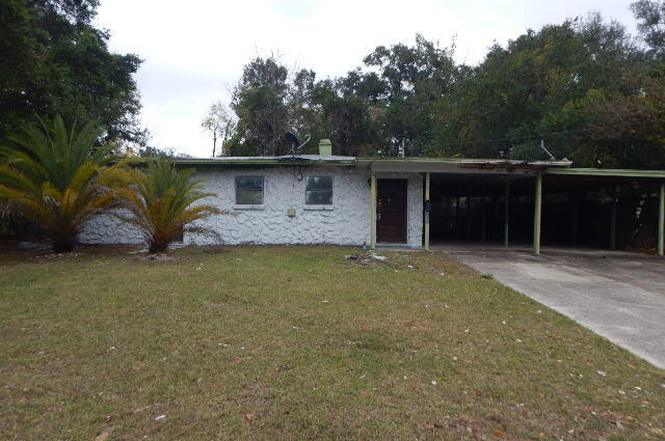
410 Brighton Ave · Bellair-Meadowbrook Terrace, FL
Flood risk 1/10 · Minimal
- FEMA flood zone
- X (unshaded)
- Chance of flooding over 30 yrs
- 0.0%
- Est. flood insurance / yr
- $507 – $1,088
Fire risk 2/10 · Minimal
- Est. fire insurance / yr
- $947 – $1,759
Heat risk 9/10 · Severe
- Hot days now (above 107°F)
- 7 days/yr
- Hot days in 30 yrs
- 20 days/yr
Wind risk 10/10 · Severe
- Chance of severe wind over 30 yrs
- 99.0%
Air-quality risk 3/10 · Minor
- Unhealthy air days now
- 3 days/yr
- Unhealthy air days in 30 yrs
- 3 days/yr
Risk factors via First Street. Map © Google.
Why this score? — see what drove the C+ grade
The composite is a weighted blend of 9 inputs, each scored 0–100. Each bar is that input's sub-score; the figure is the points it added to the 100-point composite (weight × sub-score).
- Cash flow +22.8/30.0
- ARV discount +15.0/15.0
- DSCR +7.3/10.0
- 1% rule +6.8/10.0
- Schools +5.1/10.0
- Livability +2.5/5.0
- Condition / age +2.5/5.0
- Rent growth +2.3/5.0
- Appreciation +0.0/10.0
$119,600
🖨 Deal sheet 📄 Offer letter ✓ Due diligence
Listing remarks MLS
This house needs work! This 3-bed, 1-bath large block house offers 1258 sq ft of solid fixer-upper potential. Featuring several additions, customize to your taste or make it a solid fix & flip. Located in a quiet neighborhood, enjoy serene living near amenities. Transform this gem into your dream home!
Key facts
- 0.23 acre lot
- 2 parking spots
- Built 1962
Property features AI
Finance
- HOA & community: Not a senior community
Exterior
- Parking: Carport (2 spaces); Off-street parking
- Utilities: Public sewer; Electricity available; Water available; Sewer available
- Home design: Single-family residence; One level; entry on level 1
- Construction: Block and frame construction; Shingle roof
- Exterior features: Back yard with chain link fencing; Asphalt road access
Interior
- Bedrooms: 3 bedrooms
- Bathrooms: 1 full bathroom
- Heating & cooling: Central heating (electric); Central air conditioning (electric)
- Interior features: No built-in appliances listed
Neighborhood map
What this means for you Summary
Snapshot
- This is a 2-bed/2.0-bath single-family listed at $120k.
Deal economics
- At list price, monthly cash flow is $207 ($2k/yr) — positive.
- The deal already cash-flows at list — no discount required.
- Meets the 1% rule at list price ($1k rent vs $120k).
- Recommended offer: $105k (12.0% below list) — sets the bar for market timing.
- Cap rate 8.4% vs local median 4.3% in Bellair-Meadowbrook Terrace — top-decile yield for the area; either an underpriced asset or a hidden risk that comps aren't pricing in. Stress-test before assuming the spread holds.
Location & tenants
- Location reads: area grade C — affects rentability + tenant quality, not the cash-flow math above.
- Clay (suburban): math 58% / reading 59% proficiency, ranked #14 of 73 in FL (top 19%) — acceptable for families but not a draw, mixed tenant base, ~2y average lease.
- Zoned schools: W E Cherry Elementary School (math 58% / reading 57%, grade C+, #764 of 2,144 statewide, top 36%, 641 students, 100% FRL); Orange Park Junior High School (math 38% / reading 45%, grade F, #348 of 571 statewide, top 62%, 744 students, 100% FRL); Orange Park High School (math 30% / reading 47%, grade F, #321 of 667 statewide, top 49%, 1,810 students, 100% FRL) — zoned schools average 100% FRL vs 35% district-wide (65 pts higher); higher-poverty schools than district average — tighter screening recommended.
- Zoned-school proficiency averages 46% at this address vs 58% district-wide (-13 pts) — the specific schools serving this property underperform the Clay average; the district grade overstates school quality for this exact location.
- Market conditions: Rents soft (-0.9%/yr); 249 active listings in the ZIP; 33 comparable units currently listed for rent nearby; rentals at typical pace (median 22d on market — plan ~3-4 weeks tenant-placement turnaround); solid renter incomes; 1,876 units permitted in Clay County in 2024 (14 in 5+ unit buildings).
Forward outlook
- Local home prices are declining (-3.0%/yr); year-one equity from $827 of loan paydown is wiped out by about $4k of value loss. Plan a longer hold.
- Clay County population projected at +19% by 2050 — long-run rental-demand tailwind backs the buy-and-hold thesis.
Negotiation context
- It's been on market 127 days — a 12% lower offer ($105k) is reasonable based on typical stale-listing flexibility.
- 4 sale attempts since 2y ago with the ask held roughly flat each time — persistent listings suggest the price (not the market) is what's stuck; bring a comps-based counter.
- Current owner paid $18k; list at $120k implies a 570% gain — meaningful room to come down on a strong offer.
Risks & watch-outs
- Climate carrying-cost: severe wind risk, 99% chance of damaging wind over 30y; extreme-heat days projected 7→20/yr by 2055 (HVAC capex compounding) — expect insurance premiums to compound above CPI over the hold.
Questions for the listing agent
- It's been on market 127 days. Have you received any prior offers? Is the seller open to a 12% concession, seller financing, or rate buy-down credit?
- Built in 1962 — when were the roof, HVAC, electrical panel, plumbing, and water heater last replaced?
- Why hasn't it sold? Are there any deal-killer items the seller is aware of (foundation, flood, title, zoning, code violations)?
- Is there a deadline driving the sale (1031 exchange, divorce, estate, relocation)? That informs how much negotiation room exists.
- What's the average days-on-market for RENTAL listings here right now (not sales)? A rising rental-DOM trend means longer vacancies and softer asking-rent achievability than the comps imply.
- What's the recent tenant-quality profile in this submarket — average credit score on applications, eviction rate, late-payment / NSF rate, and stable-employment percentage? A property-management company in the area should have these aggregated.
- How much new for-sale + rental construction is in the pipeline within 1–3 miles? Heavy new supply typically softens prices + rents 12–24 months out; constrained supply supports both.
Investment metrics
- 1% rule
- 1.18% ✓
- Cap rate
- 8.37%
- Cash-on-cash
- 7.43%
- DSCR
- 1.33
- GRM
- 7.0
CMA / ARV
- ARV (on-the-fly)
- $227,698
- Comps found
- 12
Show comp detail 12 sales within ~0.75 mi
| Address | Dist | Beds/Ba | Sqft | Sold | Price | $/sf | Match |
|---|---|---|---|---|---|---|---|
| 295 Blairmore Blvd E | 0.17mi | 3/1.5 (+1) | 1,256 (-0%) | 1mo | $205,000 | $163 | 84 |
| 411 Brighton Ave | 0.03mi | 3/1.0 (+1) | 1,196 (-5%) | 0mo | $132,000 | $110 | 81 |
| 366 Blairmore Blvd E | 0.27mi | 3/2.0 (+1) | 1,294 (+3%) | 0mo | $280,000 | $216 | 77 |
| 279 Bonnlyn Dr | 0.26mi | 3/2.0 (+1) | 1,338 (+6%) | 1mo | $205,000 | $153 | 71 |
| 205 Noel Rd | 0.51mi | 3/1.5 (+1) | 1,227 (-2%) | 3mo | $245,000 | $200 | 62 |
| 1968 Swallow Run W | 0.64mi | 3/2.0 (+1) | 1,219 (-3%) | 0mo | $259,900 | $213 | 60 |
| 583 Clermont Ave S | 0.71mi | 3/2.0 (+1) | 1,248 (-1%) | 2mo | $265,000 | $212 | 59 |
| 1959 Birch Run E | 0.49mi | 3/2.0 (+1) | 1,370 (+9%) | 2mo | $260,000 | $190 | 55 |
| 201 Saturn Ln N | 0.74mi | 3/2.0 (+1) | 1,287 (+2%) | 5mo | $223,000 | $173 | 53 |
| 1954 Hazelnut Run E | 0.59mi | 2/2.0 | 1,131 (-10%) | 4mo | $204,500 | $181 | 52 |
| 479 Alsey Dr | 0.60mi | 3/2.0 (+1) | 1,390 (+10%) | 1mo | $180,019 | $130 | 49 |
| 213 Hilltop Dr | 0.39mi | 3/1.0 (+1) | 1,084 (-14%) | 4mo | $145,000 | $134 | 46 |
Match score weights: distance 35% · size 25% · config 20% · recency 20%. Top-matched comps best support the ARV.
Projected returns pro-forma
-3.0% appreciation · 0.0% rent growth · sell at horizon
- IRR
- -8.6%
- Equity multiple
- 0.69×
- Total profit
- $-10,253
- Equity at exit
- $17,833
- IRR
- -4.0%
- Equity multiple
- 0.77×
- Total profit
- $-7,666
- Equity at exit
- $10,341
Cash invested: $33,488 (down + closing). Projections, not guarantees.
Landlord ↔ Tenant lean methodology
- Overall (STATE)
- 87 Strongly Landlord-Friendly
- State Florida
- 87 Strongly Landlord-Friendly · R+3
- County
- — inherits STATE
- City
- — inherits STATE
ZIP-level market 32073
- Rents YoY
- -0.9%
- Active inventory
- 249
- Price-to-rent
- 7.0×
Monthly cashflow live
- Estimated rent
- $1,416 high interval (Pro) →
- Mortgage (P&I)
- −$627
- Tax from tax record
- −$234 /mo · $2,813/yr
- Insurance
- −$50
- HOA
- −$0
- Vacancy / Maint / Mgmt
- −$297
- Net cashflow
- $207
Break-even live
UW: 25.0% down · 7.5% · 30yr · 1.5% tax · 5.0% vac · 8.0% maint · 8.0% mgmt
Financing live
Cash to close
- Down payment
- $29,900
- Closing costs
- $3,588
- Reserves months
- —
- Total cash needed
- —
Loan-product check · same deal, 3 products live
Conventional
25% down · 7.5% · 30yr
- Down + closing
- —
- Monthly P&I
- —
- Monthly cashflow
- —
- DSCR
- —
- Eligible?
- —
Personal DTI + credit; lowest rate.
DSCR
20% down · 8.5% · 30yr
- Down + closing
- —
- Monthly P&I
- —
- Monthly cashflow
- —
- DSCR
- —
- Eligible?
- —
No personal income docs; deal must DSCR.
Hard money
10% down · 12.0% · 12mo
- Down + closing
- —
- Monthly P&I
- —
- Monthly cashflow
- —
- DSCR
- —
- Eligible?
- —
Short-term bridge; refi at stabilization.
Rent comps 33 comps
| Address | Beds | Baths | Sqft | Rent | $/sqft | DOM | Units | Dist |
|---|---|---|---|---|---|---|---|---|
| 220 Woodside Dr Orange Park, FL | 3.0 | 1.0 | 1080 | $1,200 | $1.11 | 24d | 1 | 0.12mi |
| 295 Blairmore Blvd Orange Park, FL | 3.0 | 1.5 | 960 | $1,650 | $1.72 | 2d | 1 | 0.17mi |
| 342 Linden Ln Orange Park, FL | 2.0 | 1.0 | 891 | $1,200 | $1.35 | 24d | 1 | 0.19mi |
| 222 Blairmore Blvd Orange Park, FL | 2.0–3.0 | 1.0–2.0 | 1000 | $1,175 | $1.18 | 2d | 9 | 0.28mi |
| 198 Arora Blvd Orange Park, FL | 1.0–2.0 | 1.0–2.0 | 890 | $1,494 | $1.68 | 2d | 20 | 0.31mi |
| 482 Bentwood Ln Unit C Orange Park, FL | 2.0 | 1.5 | 920 | $995 | $1.08 | 12d | 1 | 0.53mi |
| 671 Custer Cir Orange Park, FL | 3.0 | 2.0 | 1621 | $1,949 | $1.20 | 15d | 1 | 0.57mi |
| 417 Gano Ave Orange Park, FL | 3.0 | 2.0 | 1360 | $1,900 | $1.40 | 24d | 1 | 0.59mi |
| 476 Lombard St Unit 2D Orange Park, FL | 2.0 | 1.5 | 960 | $1,195 | $1.24 | 24d | 1 | 0.59mi |
| 470 Crabapple Ct Unit D Orange Park, FL | 2.0 | 1.5 | 920 | $1,175 | $1.28 | 24d | 1 | 0.60mi |
| 470 Crabapple Ct Unit D Orange Park, FL | 2.0 | 1.5 | 920 | $1,175 | $1.28 | 15d | 1 | 0.60mi |
| 808 Meadowbrook Dr Unit C Orange Park, FL | 2.0 | 1.0 | 876 | $1,300 | $1.48 | 24d | 1 | 0.64mi |
| 1967 Bluebird Run W Orange Park, FL | 3.0 | 2.0 | 1461 | $1,860 | $1.27 | 4d | 1 | 0.65mi |
| 2150 Spencer Rd Orange Park, FL | 2.0 | 1.0 | 1140 | $1,304 | $1.14 | 2d | 4 | 0.68mi |
| 435 Sigsbee Rd Orange Park, FL | 3.0 | 2.0 | 1469 | $1,800 | $1.23 | 24d | 1 | 0.71mi |
| 460 Bentwood Ln Unit C Orange Park, FL | 2.0 | 1.5 | 922 | $1,050 | $1.14 | 24d | 1 | 0.73mi |
| 495 Sigsbee Rd Orange Park, FL | 3.0 | 2.0 | 1248 | $1,675 | $1.34 | 24d | 1 | 0.74mi |
| 453 Bentwood Ln Unit B Orange Park, FL | 2.0 | 1.5 | 921 | $1,000 | $1.09 | 24d | 1 | 0.76mi |
| 459 Lombard St Unit 1B Orange Park, FL | 2.0 | 1.5 | 920 | $1,250 | $1.36 | 24d | 1 | 0.77mi |
| 459 Lombard St Orange Park, FL | 2.0 | 2.0 | 920 | $1,250 | $1.36 | 24d | 1 | 0.77mi |
| 1800 Kingsley Ave Orange Park, FL | 1.0–3.0 | 1.0–2.0 | 987 | $1,450 | $1.47 | 24d | 1 | 0.86mi |
| 2020 Wells Rd Orange Park, FL | 1.0–3.0 | 1.0–2.0 | 1167 | $1,298 | $1.11 | 21d | 8 | 0.86mi |
| 1747 Papaya Dr N Orange Park, FL | 3.0 | 2.0 | 1273 | $1,895 | $1.49 | 8d | 1 | 1.18mi |
| 8550 Argyle Business Loop Jacksonville, FL | 3.0 | 2.5 | 1486 | $1,675 | $1.13 | 14d | 1 | 1.26mi |
| 8550 Argyle Business Loop Jacksonville, FL | 3.0 | 2.5 | 1486 | $1,735 | $1.17 | 16d | 3 | 1.28mi |
| 8550 Argyle Business Loop Jacksonville, FL | 2.0–3.0 | 2.5–3.0 | 1331 | $1,350 | $1.01 | 2d | 2 | 1.28mi |
| 1517 Slash Pine Ct Orange Park, FL | 3.0 | 2.0 | 1313 | $1,845 | $1.41 | 4d | 1 | 1.28mi |
| 227 Kettering Ct Orange Park, FL | 3.0 | 2.0 | 1265 | $1,600 | $1.26 | 8d | 1 | 1.32mi |
| 8500 Argyle Business Loop Jacksonville, FL | 1.0–3.0 | 1.0–2.0 | 921 | $1,238 | $1.34 | 24d | 1 | 1.35mi |
| 8529 Sturbridge Cir W Jacksonville, FL | 2.0 | 2.5 | 1264 | $1,550 | $1.23 | 24d | 1 | 1.38mi |
| 85 Debarry Ave Orange Park, FL | 2.0 | 2.5 | 1170 | $1,295 | $1.11 | 24d | 1 | 1.39mi |
| 8562 Sturbridge Cir W Jacksonville, FL | 2.0 | 2.5 | 1408 | $1,620 | $1.15 | 4d | 1 | 1.41mi |
| 8550 Sturbridge Cir W Jacksonville, FL | 2.0 | 1.5 | 1206 | $1,500 | $1.24 | 8d | 1 | 1.41mi |
Listing history 26 events
-
2026-06-18days on market $119,600 Active 127 DOM
-
2026-06-17days on market $119,600 Active 126 DOM
-
2026-06-16remarks 699-char remark
-
2026-06-16days on market $119,600 Active 125 DOM
-
2026-06-15days on market $119,600 Active 124 DOM
-
2026-06-13days on market $119,600 Active 122 DOM
-
2026-06-13days on market $119,600 Active 121 DOM
-
2026-06-09days on market $119,600 Active 118 DOM
-
2026-06-08days on market $119,600 Active 117 DOM
-
2026-06-07days on market $119,600 Active 116 DOM
-
2026-06-03days on market $119,600 Active 112 DOM
-
2026-06-02days on market $119,600 Active 111 DOM
-
2026-06-01days on market $119,600 Active 110 DOM
-
2026-05-31days on market $119,600 Active 109 DOM
-
2026-04-02status Active
-
2026-02-09status Active
-
2026-01-28status Pending
-
2026-01-28historical
-
2025-12-08$119,600 Active
-
2024-06-20status Pending 307-char remark
Show marketing remark (307 chars)
This house needs work! This 3-bed, 1-bath large block house offers 1258 sq ft of solid fixer-upper potential. Featuring several additions, customize to your taste or make it a solid fix & flip. Located in a quiet neighborhood, enjoy serene living near amenities. Transform this gem into your dream home!
-
2024-06-20historical 307-char remark
Show marketing remark (307 chars)
This house needs work! This 3-bed, 1-bath large block house offers 1258 sq ft of solid fixer-upper potential. Featuring several additions, customize to your taste or make it a solid fix & flip. Located in a quiet neighborhood, enjoy serene living near amenities. Transform this gem into your dream home!
-
2024-06-17price $129,000 307-char remark
Show marketing remark (307 chars)
This house needs work! This 3-bed, 1-bath large block house offers 1258 sq ft of solid fixer-upper potential. Featuring several additions, customize to your taste or make it a solid fix & flip. Located in a quiet neighborhood, enjoy serene living near amenities. Transform this gem into your dream home!
-
2024-06-13price $135,000 307-char remark
Show marketing remark (307 chars)
This house needs work! This 3-bed, 1-bath large block house offers 1258 sq ft of solid fixer-upper potential. Featuring several additions, customize to your taste or make it a solid fix & flip. Located in a quiet neighborhood, enjoy serene living near amenities. Transform this gem into your dream home!
-
2024-05-23price $139,000 307-char remark
Show marketing remark (307 chars)
This house needs work! This 3-bed, 1-bath large block house offers 1258 sq ft of solid fixer-upper potential. Featuring several additions, customize to your taste or make it a solid fix & flip. Located in a quiet neighborhood, enjoy serene living near amenities. Transform this gem into your dream home!
-
2024-05-07$149,000 Active 307-char remark
Show marketing remark (307 chars)
This house needs work! This 3-bed, 1-bath large block house offers 1258 sq ft of solid fixer-upper potential. Featuring several additions, customize to your taste or make it a solid fix & flip. Located in a quiet neighborhood, enjoy serene living near amenities. Transform this gem into your dream home!
-
1979-01-01soldstatus $17,856
ⓘ Source: listings_history table (triggers on properties + properties_extension) + one-shot
backfill from property_details.listing_events for pre-trigger history.
Tax reassessment forecast FL · Resets to sale price
- Current annual tax
- $2,813 · $234/mo
- Projected year-2 tax
- $2,813 · $234/mo
- Expected delta
- $0/yr ($0/mo · 0.0%)
ⓘ Screening estimate from a state-policy table — verify with the county assessor before closing.
Climate risk First Street
- Flood 1/10 Low FEMA zone X (unshaded) · 0% chance over 30 yrs
- Wildfire 2/10 Low
- Heat 9/10 Extreme 7 d/yr ≥107°F today · 20 d/yr by 30 yrs out
- Wind 10/10 Extreme 99% chance of damaging wind over 30 yrs
- Air quality 3/10 Moderate 3 unhealthy d/yr today · 3 by 30 yrs out
Nearby sold comps map
Loading sold comps map…
Walkable amenities ~0.75 mi
Loading nearby amenities…
Taxation est. · year 1
- Rental income
- $16,994
- − Mortgage interest
- −$6,699
- − Property taxes
- −$2,813
- − Insurance
- −$598
- − Repairs & maintenance
- −$1,360
- − Management
- −$1,360
- − Depreciation
- −$3,479
- Taxable income
- $685
- Est. tax owed @ 24.0%
- −$164
- After-tax cash flow
- $2,323/yr
For passive investors: Depreciation is non-cash, so a rental often shows a tax loss while cash-flowing — sheltering income. Rental losses are passive: they offset passive income freely, and up to $25,000/yr can offset ordinary (W-2) income if you actively participate and your MAGI is under $100k (phasing out to $0 by $150k); unused losses carry forward. On sale, claimed depreciation is recaptured at up to 25%, and gains may owe capital-gains tax (a 1031 exchange can defer both). Figures are a year-1 estimate at your 24.0% rate — not tax advice; consult a CPA.
Schools (NCES district)
- District
- Clay
- NCES district ID
- 1200300
- Math proficiency
- 58% ▼ -8.00%
- Reading proficiency
- 59% ▼ -3.00%
- Median HH income
- $59,379
- Composite
- 50.73/100
- National rank
- #1815
- State rank
- #14 of 73 in FL
Livability — Bellair-Meadowbrook Terrace
No livability data for this city. (Only ~50 U.S. cities are tracked.)
Census & demographics
- Census place
- Bellair-Meadowbrook Terrace, FL
- County
- Clay County · 208,450 people
- City population
- 42,825
- Metro
- Jacksonville, FL
- Population (ZIP)
- 43,561
- Household income
- $76,455
- Rent vs Own
- Severe rent burden
- 1544.0
Population outlook (Clay County) Hauer SSP2
- Today (2025)
- 230,495 people
- By 2030
- 242,427 · +5.2%
- By 2040
- 262,244 · +13.8%
- By 2050
- 275,148 · +19.4%
- By 2075
- 295,397 · +28.2%
- By 2100
- 287,592 · +24.8%
Race, ethnicity, and origin ACS 2023
- Neighborhood character
- Diverse neighborhood (Simpson 0.59)
- Race & ethnicity
- White 60% Black 18% Hispanic / Latino 12% Two or more races 10% Asian 5%
- Hispanic origin (detail)
- Mexican 1% Puerto Rican 5% Cuban 2%
- Common ancestry
- Slovak 4% Italian 2% Lithuanian 2%
- Foreign-born
- 7% · Canada, Vietnam, Jamaica
- Languages at home
- 88% English-only · Spanish 8% Tagalog/Filipino 1% French/Haitian/Cajun 1%
Political lean MEDSL · Clay
- 2024 margin
- Solid R (+39.3) · D 29.9% · R 69.2%
- 2008→2024 swing
- +3.6pp toward D · 2008: -42.8pp · 2024: -39.3pp
- All cycles
- 2024: R+39.3 2020: R+37.1 2016: R+44.3 2012: R+45.8 2008: R+42.8
Not yet ingested
- Civics
- —
Market trends
- HPI YoY
- ▼ -188.76%
- Current HPI
- 289.8735
- Rent YoY
- ▼ -0.87%
- Metro
- Jacksonville, FL
- State GDP YoY
- ▲ 3.28%
- F500 in state
- 36
Industry mix (Fortune 500 HQ in FL)
| Industry | F500 HQs | Revenue |
|---|---|---|
| Industrial Technology | 2 | $29B |
|
||
| Insurance | 2 | $17B |
|
||
| Retail | 1 | $60B |
|
||
| Technology Distribution | 1 | $58B |
|
||
| Homebuilding | 1 | $35B |
|
||
| Technology Manufacturing | 1 | $35B |
|
||
Price history
+569.8% since first listed12 events — show timeline
- 2026-04-02 Relisted — realMLS
- 2026-02-09 Relisted — realMLS
- 2026-01-28 Pending — realMLS
- 2026-01-28 Listing Removed — realMLS
- 2025-12-08 Listed $119,600 realMLS
- 2024-06-20 Pending — realMLS
- 2024-06-20 Listing Removed — realMLS
- 2024-06-17 Price Changed $129,000 realMLS
- 2024-06-13 Price Changed $135,000 realMLS
- 2024-05-23 Price Changed $139,000 realMLS
- 2024-05-07 Listed $149,000 realMLS
- 1979-01-01 Sold (Public Records) $17,856 Public Records
Property tax history
+17.6%/yrLatest (2025): $2,813 · +6.3% YoY. Source: county tax records.
Cash-flow waterfall
monthlySold comps — $/sqft
last 12 mo · ≤1 miLoading sold comps…