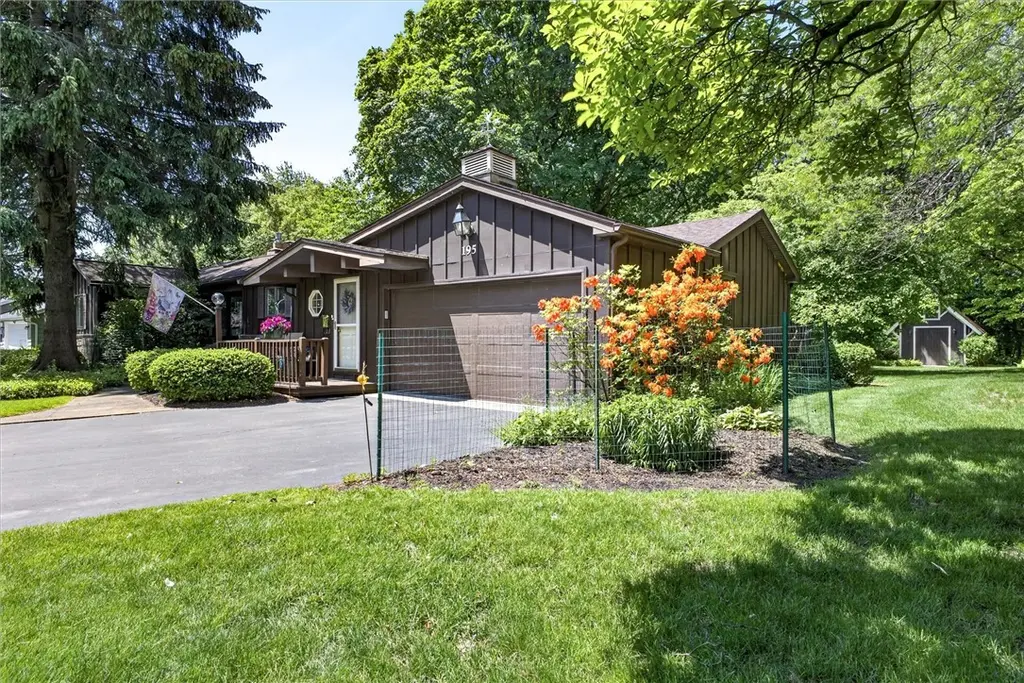
195 Cornwall Ln · Irondequoit, NY
Flood risk 1/10 · Minimal
- FEMA flood zone
- X (unshaded)
- Chance of flooding over 30 yrs
- 0.0%
- Est. flood insurance / yr
- $473 – $860
Fire risk 3/10 · Minor
- Est. fire insurance / yr
- $691 – $1,283
Heat risk 2/10 · Minimal
- Hot days now (above 95°F)
- 6 days/yr
- Hot days in 30 yrs
- 14 days/yr
Wind risk 1/10 · Minimal
- Chance of severe wind over 30 yrs
- —
Air-quality risk 2/10 · Minimal
- Unhealthy air days now
- 1 days/yr
- Unhealthy air days in 30 yrs
- 2 days/yr
Risk factors via First Street. Map © Google.
Why this score? — see what drove the D- grade
The composite is a weighted blend of 9 inputs, each scored 0–100. Each bar is that input's sub-score; the figure is the points it added to the 100-point composite (weight × sub-score).
- Cash flow +11.5/30.0
- Schools +6.2/10.0
- ARV discount +5.3/15.0
- Livability +4.0/5.0
- 1% rule +3.9/10.0
- DSCR +3.4/10.0
- Rent growth +2.5/5.0
- Condition / age +2.5/5.0
- Appreciation +0.0/10.0
$329,900
🖨 Deal sheet (PDF) 📄 Offer letter ✓ Due diligence
Listing remarks
Charming 3-bedroom cedar-sided contemporary ranch in cul-de-sac with the warmth and character of an Adirondack cottage! This inviting home features soaring vaulted ceilings, skylights that flood the interior with natural light, a cozy yet open atmosphere throughout! The spacious sunroom with high ceilings offers the perfect place to relax year-round while overlooking the beautifully landscaped backyard. Huge 2.5 car garage with soaring ceilings. Enjoy comfortable one-floor living combined with rustic charm, creating a peaceful retreat that feels like a getaway every day. A rare blend of comfort, style and nature-inspired living! Potential in-law set-up as well! Home needs some updating but
Key facts
- Landscaped backyard
- Spacious sunroom
- Cul-de-sac
Tags
Property features AI
Exterior
- Parking: Attached garage with 2 spaces; Garage with electricity and automatic door opener
- Utilities: Electricity connected (circuit breakers); Public water connected; Sewer connected
- Home design: Single-story home; Existing construction; Main-level living; Resale property; Faces city street
- Construction: Asphalt roof; Cedar construction details; Block foundation; Attic/crawl hatchway(s) insulated; Blown-in insulation
- Exterior features: Blacktop driveway; Deck; Patio; Porch; Enclosed porch; Sunroom/Florida room; Shed(s) and storage
Interior
- Kitchen: Gas cooktop; Microwave; Dishwasher; Disposal; Refrigerator; Freezer; Kitchen island; Pantry; Eat-in kitchen
- Bedrooms: 3 main-level bedrooms; Main level primary bedroom
- Flooring: Carpet; Varied flooring
- Bathrooms: 2 full bathrooms (both on main level)
- Heating & cooling: Gas forced-air heating; Central air conditioning; Gas water heater
- Interior features: Ceiling fans; Entrance foyer; Eat-in kitchen; Separate/formal living room; Kitchen island; Pantry; Sliding glass doors; Skylights; In-law floorplan; See remarks
- Laundry & utility: Washer and dryer included; Laundry located in basement
Neighborhood map
What this means for you Summary
Snapshot
- This is a 3-bed/2.0-bath single-family listed at $330k.
Deal economics
- At list price, monthly cash flow is $-108 ($-1k/yr) — negative.
- To cash-flow at today's rent, offer at most $311k (5.8% below list).
- To meet the 1% rule (rent ≥ 1% of price), the offer needs to be $293k (11.1% below list).
- Recommended offer: $293k (11.1% below list) — sets the bar for 1% rule.
- Cap rate 5.9% vs local median 4.5% in Irondequoit — top-decile yield for the area; either an underpriced asset or a hidden risk that comps aren't pricing in. Stress-test before assuming the spread holds.
Location & tenants
- Location reads 81/100 on livability (#92 in NY, #1,414 nationally) — a professional / high-income tenant draw. Strengths: housing A+, health & safety A+, crime B+; Watch: amenities F.
- West Irondequoit Central School District (suburban): math 73% / reading 70% proficiency, ranked #126 of 590 in NY (top 21%) — strong family-tenant draw, lease renewals of 3-5y typical; only 18% free/reduced lunch — higher-income household profile.
- Zoned schools: Irondequoit High School (math 96% / reading 64%, grade A, #509 of 1,100 statewide, top 46%, 1,163 students, 33% FRL).
- Market conditions: 104 active listings in the ZIP; 5 comparable units currently listed for rent nearby; rentals leasing fast (median 5d on market — plan ~1-2 weeks tenant-placement turnaround); solid renter incomes; 1,169 units permitted in Monroe County in 2024 (591 in 5+ unit buildings).
- This rent runs 39% of the median local income ($90k/yr) — at the standard rent-burdened threshold; future hikes will face affordability resistance.
Forward outlook
- Local home prices are declining (-3.0%/yr); year-one equity from $2k of loan paydown is wiped out by about $10k of value loss. Plan a longer hold.
- Monroe County population projected to shrink 6% by 2050 — rents likely to lag national; underwrite the cash flow, not the appreciation.
Negotiation context
- Only 7 days on market — expect competitive offers; lowballing is unlikely to land.
- Current owner paid $148k; list at $330k implies a 123% gain — meaningful room to come down on a strong offer.
Risks & watch-outs
- Watch-outs: built in 1951 — expect roof / HVAC / electrical / plumbing capex.
Questions for the listing agent
- What do current leases actually rent for vs. the listed asking? Can we see a recent rent roll and the last 12 months of T-12 income?
- Built in 1951 — when were the roof, HVAC, electrical panel, plumbing, and water heater last replaced?
- Is there a deadline driving the sale (1031 exchange, divorce, estate, relocation)? That informs how much negotiation room exists.
- Schools are B-rated — typically a magnet for longer-tenancy family renters. What's the average tenant stay here, and is there a school-zone premium baked into asking?
- The area grade is low — what's the realistic commute time and amenity access for the typical tenant pool here? Any planned neighborhood developments (good or bad) we should know about?
- What's the average days-on-market for RENTAL listings here right now (not sales)? A rising rental-DOM trend means longer vacancies and softer asking-rent achievability than the comps imply.
- What's the recent tenant-quality profile in this submarket — average credit score on applications, eviction rate, late-payment / NSF rate, and stable-employment percentage? A property-management company in the area should have these aggregated.
- How much new for-sale + rental construction is in the pipeline within 1–3 miles? Heavy new supply typically softens prices + rents 12–24 months out; constrained supply supports both.
Investment metrics
- 1% rule
- 0.89% ✗
- Cap rate
- 5.90%
- Cash-on-cash
- -1.40%
- DSCR
- 0.94
- GRM
- 9.4
CMA / ARV
- ARV (on-the-fly)
- $314,416
- Comps found
- 12
Show comp detail 12 sales within ~0.75 mi
| Address | Dist | Beds/Ba | Sqft | Sold | Price | $/sf | Match |
|---|---|---|---|---|---|---|---|
| 96 Thomas Ave | 0.41mi | 3/2.5 | 1,794 (-2%) | 2mo | $308,500 | $172 | 74 |
| 146 Cornwall Ln | 0.08mi | 3/2.0 | 1,667 (-9%) | 10mo | $213,000 | $128 | 73 |
| 288 Oakridge Dr | 0.30mi | 4/1.5 (+1) | 1,689 (-8%) | 2mo | $412,000 | $244 | 65 |
| 161 Nob Hl | 0.53mi | 3/1.5 | 1,740 (-5%) | 4mo | $359,000 | $206 | 62 |
| 541 Pine Grove Ave | 0.61mi | 3/2.0 | 1,794 (-2%) | 9mo | $381,000 | $212 | 61 |
| 318 Thomas Ave | 0.71mi | 3/1.5 | 1,824 (-0%) | 8mo | $300,000 | $164 | 58 |
| 234 Pine Grove Ave | 0.26mi | 4/2.0 (+1) | 2,032 (+11%) | 10mo | $325,000 | $160 | 56 |
| 26 Oakridge Dr | 0.32mi | 4/2.0 (+1) | 2,069 (+13%) | 8mo | $225,000 | $109 | 52 |
| 89 Pinecrest Dr | 0.45mi | 3/1.5 | 1,625 (-11%) | 9mo | $325,000 | $200 | 50 |
| 47 Glenmont Dr | 0.57mi | 3/1.5 | 1,680 (-8%) | 10mo | $279,900 | $167 | 50 |
| 660 List Ave | 0.42mi | 4/2.5 (+1) | 1,576 (-14%) | 2mo | $300,000 | $190 | 49 |
| 63 Shorewood Dr | 0.75mi | 3/1.0 | 1,556 (-15%) | 0mo | $210,000 | $135 | 36 |
Match score weights: distance 35% · size 25% · config 20% · recency 20%. Top-matched comps best support the ARV.
Projected returns pro-forma
-3.0% appreciation · 3.0% rent growth · sell at horizon
- IRR
- -18.6%
- Equity multiple
- 0.35×
- Total profit
- $-60,204
- Equity at exit
- $49,189
- IRR
- -10.9%
- Equity multiple
- 0.34×
- Total profit
- $-60,740
- Equity at exit
- $28,524
Cash invested: $92,372 (down + closing). Projections, not guarantees.
Landlord ↔ Tenant lean methodology
- Overall (STATE)
- 15 Strongly Tenant-Friendly
- State New York
- 15 Strongly Tenant-Friendly · D+10
- County
- — inherits STATE
- City
- — inherits STATE
ZIP-level market 14617
- Active inventory
- 104
- Price-to-rent
- 9.4×
Monthly cashflow live
- Estimated rent
- $2,932 high interval (Pro) →
- Mortgage (P&I)
- −$1,730
- Tax from tax record
- −$557 /mo · $6,686/yr
- Insurance
- −$137
- HOA
- −$0
- Vacancy / Maint / Mgmt
- −$616
- Net cashflow
- $-108
Break-even live
Sensitivity live
| Price | -10% $79 | -5% $-15 | +0% $-108 | +5% $-201 | +10% $-295 |
|---|---|---|---|---|---|
| Rent | -10% $-340 | -5% $-224 | +0% $-108 | +5% $8 | +10% $124 |
| Rate | -1.0pp $58 | -0.5pp $-24 | base $-108 | +0.5pp $-193 | +1.0pp $-280 |
UW: 25.0% down · 7.5% · 30yr · 1.5% tax · 5.0% vac · 8.0% maint · 8.0% mgmt
Financing live
Cash to close
- Down payment
- $82,475
- Closing costs
- $9,897
- Reserves months
- —
- Total cash needed
- —
Loan-product check · same deal, 3 products live
Conventional
25% down · 7.5% · 30yr
- Down + closing
- —
- Monthly P&I
- —
- Monthly cashflow
- —
- DSCR
- —
- Eligible?
- —
Personal DTI + credit; lowest rate.
DSCR
20% down · 8.5% · 30yr
- Down + closing
- —
- Monthly P&I
- —
- Monthly cashflow
- —
- DSCR
- —
- Eligible?
- —
No personal income docs; deal must DSCR.
Hard money
10% down · 12.0% · 12mo
- Down + closing
- —
- Monthly P&I
- —
- Monthly cashflow
- —
- DSCR
- —
- Eligible?
- —
Short-term bridge; refi at stabilization.
Rent comps 5 comps
| Address | Beds | Baths | Sqft | Rent | $/sqft | DOM | Units | Dist |
|---|---|---|---|---|---|---|---|---|
| 485 Oakridge Dr Rochester, NY | 3.0 | 1.5 | 1826 | $4,000 | $2.19 | 4d | 1 | 0.54mi |
| 58 Fairview Cres Rochester, NY | 4.0 | 1.5 | 2194 | $3,600 | $1.64 | 4d | 1 | 0.60mi |
| 148 Chestnut Hill Dr Rochester, NY | 3.0 | 2.0 | 1659 | $2,250 | $1.36 | 4d | 1 | 1.20mi |
| 37 Oakmount Dr Rochester, NY | 4.0 | 2.0 | 1368 | $2,500 | $1.83 | 16d | 1 | 1.22mi |
| 38 Elgrove Rd Rochester, NY | 4.0 | 1.5 | 1600 | $2,295 | $1.43 | 23d | 1 | 1.42mi |
Listing history 6 events
-
2026-06-13statusdays on market $329,900 Pending 7 DOM
-
2026-06-10days on market $329,900 Active 6 DOM
-
2026-06-09days on market $329,900 Active 5 DOM
-
2026-06-09days on market $329,900 Active 4 DOM
-
2026-06-07remarks 699-char remark
-
2026-06-07$329,900 Active 3 DOM
ⓘ Source: listings_history table (triggers on properties + properties_extension) + one-shot
backfill from property_details.listing_events for pre-trigger history.
Tax reassessment forecast NY · Partial reset (capped growth)
- Current annual tax
- $6,686 · $557/mo
- Projected year-2 tax
- $6,686 · $557/mo
- Expected delta
- $0/yr ($0/mo · 0.0%)
ⓘ Screening estimate from a state-policy table — verify with the county assessor before closing.
Climate risk First Street
- Flood 1/10 Low FEMA zone X (unshaded) · 0% chance over 30 yrs
- Wildfire 3/10 Moderate
- Heat 2/10 Low 6 d/yr ≥95°F today · 14 d/yr by 30 yrs out
- Wind 1/10 Low
- Air quality 2/10 Low 1 unhealthy d/yr today · 2 by 30 yrs out
Nearby sold comps map
Loading sold comps map…
Walkable amenities ~0.75 mi
Loading nearby amenities…
Taxation est. · year 1
- Rental income
- $35,190
- − Mortgage interest
- −$18,480
- − Property taxes
- −$6,686
- − Insurance
- −$1,650
- − Repairs & maintenance
- −$2,815
- − Management
- −$2,815
- − Depreciation
- −$9,597
- Taxable loss
- −$6,853
- Est. tax savings @ 24.0%
- +$1,645
- After-tax cash flow
- $349/yr
For passive investors: Depreciation is non-cash, so a rental often shows a tax loss while cash-flowing — sheltering income. Rental losses are passive: they offset passive income freely, and up to $25,000/yr can offset ordinary (W-2) income if you actively participate and your MAGI is under $100k (phasing out to $0 by $150k); unused losses carry forward. On sale, claimed depreciation is recaptured at up to 25%, and gains may owe capital-gains tax (a 1031 exchange can defer both). Figures are a year-1 estimate at your 24.0% rate — not tax advice; consult a CPA.
Schools (NCES district)
- District
- West Irondequoit Central School District
- NCES district ID
- 3615390
- Math proficiency
- 73% ▲ 3.00%
- Reading proficiency
- 70% ▲ 5.00%
- Median HH income
- $60,218
- Composite
- 61.61/100
- National rank
- #748
- State rank
- #126 of 590 in NY
Livability — Irondequoit
- Score
- 81/100
- State rank
- #92
- US rank
- #1414
Category grades
Schools grade is shown separately in the Schools card above.
Census & demographics
- Census place
- Irondequoit, NY
- County
- Monroe County · 674,131 people
- City population
- 74,252
- Metro
- Rochester, NY
- Population (ZIP)
- 21,788
- Household income
- $90,192
- Rent vs Own
- Severe rent burden
- 426.0
Population outlook (Monroe County) Hauer SSP2
- Today (2025)
- 759,460 people
- By 2030
- 757,154 · -0.3%
- By 2040
- 740,644 · -2.5%
- By 2050
- 714,443 · -5.9%
- By 2075
- 645,883 · -15.0%
- By 2100
- 547,084 · -28.0%
Race, ethnicity, and origin ACS 2023
- Neighborhood character
- Predominantly White (85%)
- Race & ethnicity
- White 85% Hispanic / Latino 8% Two or more races 6% Black 4%
- Hispanic origin (detail)
- Puerto Rican 4%
- Common ancestry
- Romanian 6% Iranian 3% Lithuanian 3%
- Foreign-born
- 4% · Canada
- Languages at home
- 93% English-only · Spanish 4% Other Indo-European 1% Russian/Polish/Slavic 1%
Political lean MEDSL · Monroe
- 2024 margin
- D (+19.1) · D 59.5% · R 40.5%
- 2008→2024 swing
- +1.4pp toward D · 2008: 17.7pp · 2024: 19.1pp
- All cycles
- 2024: D+19.1 2020: D+21.0 2016: D+14.1 2012: D+17.4 2008: D+17.7
Not yet ingested
- Civics
- —
Market trends
- HPI YoY
- ▼ -148.22%
- Current HPI
- 263.9973
- Rent YoY
- —
- Metro
- Rochester, NY
- State GDP YoY
- ▲ 2.60%
- F500 in state
- 92
Industry mix (Fortune 500 HQ in NY)
| Industry | F500 HQs | Revenue |
|---|---|---|
| Financial Services | 10 | $950B |
|
||
| Consumer Goods | 9 | $162B |
|
||
| Insurance | 4 | $225B |
|
||
| Telecommunications | 2 | $144B |
|
||
| Pharmaceuticals | 2 | $112B |
|
||
| Media / Entertainment | 2 | $69B |
|
||
Price history
+122.9% since first listed2 events — show timeline
- 2026-06-04 Listed $329,900 UNYREIS
- 1999-10-08 Sold (Public Records) $148,000 Public Records
Property tax history
+3.8%/yrLatest (2025): $6,686 · +45.3% YoY. Source: county tax records.
Cash-flow waterfall
monthlySold comps — $/sqft
last 12 mo · ≤1 miLoading sold comps…