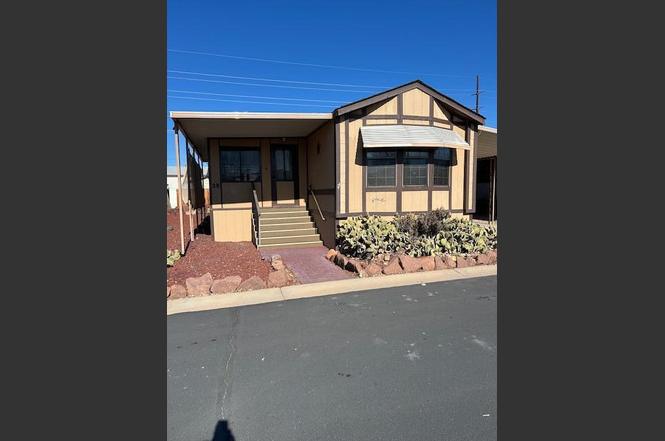
1360 N Dixie Downs Rd #28 · St. George, UT
Flood risk No data
- FEMA flood zone
- —
- Chance of flooding over 30 yrs
- —
- Est. flood insurance / yr
- —
Fire risk No data
- Est. fire insurance / yr
- —
Heat risk No data
- Hot days now (above threshold)
- —
- Hot days in 30 yrs
- —
Wind risk No data
- Chance of severe wind over 30 yrs
- —
Air-quality risk No data
- Unhealthy air days now
- —
- Unhealthy air days in 30 yrs
- —
Risk factors via First Street. Map © Google.
Why this score? — see what drove the C- grade
The composite is a weighted blend of 9 inputs, each scored 0–100. Each bar is that input's sub-score; the figure is the points it added to the 100-point composite (weight × sub-score).
- Cash flow +19.6/30.0
- 1% rule +8.5/10.0
- ARV discount +7.5/15.0
- DSCR +6.2/10.0
- Schools +3.7/10.0
- Rent growth +3.1/5.0
- Livability +2.5/5.0
- Condition / age +2.5/5.0
- Appreciation +0.0/10.0
$124,000
🖨 Deal sheet (PDF) 📄 Offer letter ✓ Due diligence
Listing remarks
Seller is Motivated! (Manufactured Home on Rented Lot in a 55+ Adult Community) Cozy and well-maintained two-bedroom, two-bath home nestled in a clean and quiet park. Enjoy an inviting open layout with bright, comfortable living spaces that instantly feel like home. This beautifully remodeled kitchen features stunning cabinetry, upgraded countertops, and gorgeous flooring throughout. Home includes an added sun/bonus room as a bonus. Ideally located near schools, shopping, and dining. HOA fee is $320 per month offering an affordable and low-maintenance lifestyle in a lovely community. Buyer to verify all information.
Key facts
- Inviting open layout
- Upgraded countertops
- Remodeled kitchen
Tags
Property features AI
Finance
- Other: Property is on a rented lot (Mobile Home/Rented Lot)
- HOA & community: Homeowners association with monthly fee of $320; HOA fee covers water, sewer, and cable TV
Exterior
- Parking: Carport with 2 spaces; No additional parking features listed
- Utilities: Water included in HOA; Sewer included in HOA; Cable TV included in HOA
- Home design: Mobile home (residential); Single-story
- Construction: Aluminum siding; Asphalt roof; Built as a single-story structure
- Exterior features: Level lot; Paved road access; Workshop (outbuilding); See remarks for additional exterior details
Interior
- Kitchen: Microwave; Range/Oven; Refrigerator; Dishwasher (disposal listed separately)
- Bedrooms: Total of 6 rooms (bedrooms included in room count)
- Heating & cooling: Heat pump heating; Central air conditioning; Has heating
- Interior features: Window coverings; Water softener; Disposal
- Laundry & utility: Washer; Dryer
Neighborhood map
What this means for you Summary
Snapshot
- This is a 2-bed/2.0-bath manufactured listed at $124k.
Deal economics
- At list price, monthly cash flow is $143 ($2k/yr) — positive.
- The deal already cash-flows at list — no discount required.
- Meets the 1% rule at list price ($2k rent vs $124k).
- Recommended offer: $113k (9.0% below list) — sets the bar for market timing.
Location & tenants
- Location reads: area grade C — affects rentability + tenant quality, not the cash-flow math above.
- Washington District (urban): math 42% / reading 45% proficiency, ranked #37 of 80 in UT (top 46%) — families likely to look elsewhere, expect single-tenant / working-renter base with shorter leases.
- Zoned schools: Paradise Canyon (math 31% / reading 24%, grade F, #451 of 585 statewide, top 77%, 478 students, 62% FRL); Snow Canyon High (math 32% / reading 48%, grade F, #62 of 171 statewide, top 36%, 1,266 students, 30% FRL).
- Market conditions: Rents rising (+2.4%/yr); 777 active listings in the ZIP; 16 comparable units currently listed for rent nearby; rentals at typical pace (median 22d on market — plan ~3-4 weeks tenant-placement turnaround); 3,140 units permitted in Washington County in 2024 (650 in 5+ unit buildings).
Forward outlook
- Local home prices are declining (-3.0%/yr); year-one equity from $857 of loan paydown is wiped out by about $4k of value loss. Plan a longer hold.
- Washington County population projected at +44% by 2050 — long-run rental-demand tailwind backs the buy-and-hold thesis.
Negotiation context
- It's been on market 93 days — a 9% lower offer ($113k) is reasonable based on typical stale-listing flexibility.
- 2 sale attempts; this cycle's ask has dropped $11k (8%) from the opening price — seller is motivated, your offer sets the floor, not the list.
Questions for the listing agent
- It's been on market 93 days. Have you received any prior offers? Is the seller open to a 9% concession, seller financing, or rate buy-down credit?
- What does the HOA fee cover, when was the last increase, and are there any pending special assessments or reserve-fund shortfalls?
- Why hasn't it sold? Are there any deal-killer items the seller is aware of (foundation, flood, title, zoning, code violations)?
- Is there a deadline driving the sale (1031 exchange, divorce, estate, relocation)? That informs how much negotiation room exists.
- What's the average days-on-market for RENTAL listings here right now (not sales)? A rising rental-DOM trend means longer vacancies and softer asking-rent achievability than the comps imply.
- What's the recent tenant-quality profile in this submarket — average credit score on applications, eviction rate, late-payment / NSF rate, and stable-employment percentage? A property-management company in the area should have these aggregated.
- How much new for-sale + rental construction is in the pipeline within 1–3 miles? Heavy new supply typically softens prices + rents 12–24 months out; constrained supply supports both.
Investment metrics
- 1% rule
- 1.35% ✓
- Cap rate
- 7.67%
- Cash-on-cash
- 4.93%
- DSCR
- 1.22
- GRM
- 6.2
CMA / ARV
No comps found within radius.
Projected returns pro-forma
-3.0% appreciation · 2.42% rent growth · sell at horizon
- IRR
- -9.3%
- Equity multiple
- 0.66×
- Total profit
- $-11,751
- Equity at exit
- $18,489
- IRR
- -0.7%
- Equity multiple
- 0.96×
- Total profit
- $-1,558
- Equity at exit
- $10,721
Cash invested: $34,720 (down + closing). Projections, not guarantees.
Landlord ↔ Tenant lean methodology
- Overall (STATE)
- 86 Strongly Landlord-Friendly
- State Utah
- 86 Strongly Landlord-Friendly · R+15
- County
- — inherits STATE
- City
- — inherits STATE
ZIP-level market 84770
- Rents YoY
- 2.4%
- Active inventory
- 777
- Price-to-rent
- 6.2×
Monthly cashflow live
- Estimated rent
- $1,670 high interval (Pro) →
- Mortgage (P&I)
- −$650
- Tax est. 1.5%
- −$155 /mo · $1,860/yr
- Insurance
- −$52
- HOA
- −$320
- Vacancy / Maint / Mgmt
- −$351
- Net cashflow
- $143
Break-even live
Sensitivity live
| Price | -10% $228 | -5% $186 | +0% $143 | +5% $100 | +10% $57 |
|---|---|---|---|---|---|
| Rent | -10% $11 | -5% $77 | +0% $143 | +5% $209 | +10% $275 |
| Rate | -1.0pp $205 | -0.5pp $174 | base $143 | +0.5pp $111 | +1.0pp $78 |
UW: 25.0% down · 7.5% · 30yr · 1.5% tax · 5.0% vac · 8.0% maint · 8.0% mgmt
Financing live
Cash to close
- Down payment
- $31,000
- Closing costs
- $3,720
- Reserves months
- —
- Total cash needed
- —
Loan-product check · same deal, 3 products live
Conventional
25% down · 7.5% · 30yr
- Down + closing
- —
- Monthly P&I
- —
- Monthly cashflow
- —
- DSCR
- —
- Eligible?
- —
Personal DTI + credit; lowest rate.
DSCR
20% down · 8.5% · 30yr
- Down + closing
- —
- Monthly P&I
- —
- Monthly cashflow
- —
- DSCR
- —
- Eligible?
- —
No personal income docs; deal must DSCR.
Hard money
10% down · 12.0% · 12mo
- Down + closing
- —
- Monthly P&I
- —
- Monthly cashflow
- —
- DSCR
- —
- Eligible?
- —
Short-term bridge; refi at stabilization.
Rent comps 16 comps
| Address | Beds | Baths | Sqft | Rent | $/sqft | DOM | Units | Dist |
|---|---|---|---|---|---|---|---|---|
| 1711 W 1300 N Saint George, UT | 2.0 | 1.0 | 1120 | $1,550 | $1.38 | 21d | 1 | 0.09mi |
| 1117 West Unit A St. George, UT | 2.0 | 2.0 | 1850 | $1,850 | $1.00 | 21d | 1 | 0.31mi |
| 1591 W 1170 N Unit 24 St. George, UT | 3.0 | 2.5 | 1314 | $1,588 | $1.21 | 21d | 1 | 0.33mi |
| 1664 N Dixie Downs Rd Unit 2 St. George, UT | 3.0 | 2.5 | 1480 | $1,700 | $1.15 | 21d | 1 | 0.35mi |
| 1741 W 950 N St. George, UT | 2.0 | 1.5 | 1028 | $1,500 | $1.46 | 14d | 1 | 0.51mi |
| 1660 W Sunset Blvd Saint George, UT | 2.0 | 2.0 | 909 | $1,399 | $1.54 | 21d | 3 | 0.56mi |
| 1308 W 1130 N #2 St George, UT | 3.0 | 2.0 | 1300 | $1,695 | $1.30 | 14d | 1 | 0.58mi |
| 1040 N 1300 W #89 St. George, UT | 3.0 | 2.0 | 1100 | $1,795 | $1.63 | 21d | 1 | 0.70mi |
| 1606 N Raven Ln Saint George, UT | 3.0 | 2.0 | 1670 | $1,973 | $1.18 | 21d | 1 | 0.72mi |
| 960 Heritage Dr #52 Santa Clara, UT | 3.0 | 2.5 | 1858 | $2,200 | $1.18 | 14d | 1 | 0.97mi |
| 1151 W 540 N Unit 4 St. George, UT | 3.0 | 2.0 | 1000 | $1,295 | $1.29 | 21d | 1 | 1.26mi |
| 340 N Country Ln #65 Saint George, UT | 2.0 | 3.0 | 1290 | $1,800 | $1.40 | 14d | 1 | 1.31mi |
| 260 N Dixie Dr Saint George, UT | 1.0–3.0 | 1.0–2.0 | 1123 | $1,688 | $1.50 | 21d | 18 | 1.32mi |
| 260 N Dixie Dr Saint George, UT | 1.0–3.0 | 1.0–2.0 | 1187 | $1,674 | $1.41 | 14d | 20 | 1.32mi |
| 776 Diagonal St #52 St George, UT | 2.0 | 2.0 | 1076 | $1,325 | $1.23 | 14d | 1 | 1.37mi |
| 225 N Country Ln Unit 1389634P St. George, UT | 3.0 | 2.0 | 1377 | $2,995 | $2.18 | 14d | 1 | 1.46mi |
HOA detail
- Monthly dues
- $320 · $3,840/yr
Listing history 8 events
-
2026-06-19days on market $124,000 Active 93 DOM
-
2026-06-18days on market $124,000 Active 92 DOM
-
2026-06-17statusdays on market $124,000 Active 91 DOM
-
2026-05-02price $124,000
-
2026-04-01price $129,900
-
2026-03-23status Active
-
2026-03-07status Pending
-
2026-02-09$134,900 Active
ⓘ Source: listings_history table (triggers on properties + properties_extension) + one-shot
backfill from property_details.listing_events for pre-trigger history.
Nearby sold comps map
Loading sold comps map…
Walkable amenities ~0.75 mi
Loading nearby amenities…
Taxation est. · year 1
- Rental income
- $20,045
- − Mortgage interest
- −$6,946
- − Property taxes
- −$1,860
- − Insurance
- −$620
- − Repairs & maintenance
- −$1,604
- − Management
- −$1,604
- − HOA
- −$3,840
- − Depreciation
- −$3,607
- Taxable loss
- −$35
- Est. tax savings @ 24.0%
- +$8
- After-tax cash flow
- $1,721/yr
For passive investors: Depreciation is non-cash, so a rental often shows a tax loss while cash-flowing — sheltering income. Rental losses are passive: they offset passive income freely, and up to $25,000/yr can offset ordinary (W-2) income if you actively participate and your MAGI is under $100k (phasing out to $0 by $150k); unused losses carry forward. On sale, claimed depreciation is recaptured at up to 25%, and gains may owe capital-gains tax (a 1031 exchange can defer both). Figures are a year-1 estimate at your 24.0% rate — not tax advice; consult a CPA.
Schools (NCES district)
- District
- Washington District
- NCES district ID
- 4901140
- Math proficiency
- 42% ▼ -3.00%
- Reading proficiency
- 45% ▼ -3.00%
- Median HH income
- $50,861
- Composite
- 37.47/100
- National rank
- #4408
- State rank
- #37 of 80 in UT
Livability — St. George
No livability data for this city. (Only ~50 U.S. cities are tracked.)
Census & demographics
- Census place
- St. George, UT
- County
- Washington County · 179,216 people
- City population
- 101,579
- Metro
- St. George, UT
- Population (ZIP)
- 48,397
- Household income
- $70,024
- Rent vs Own
- Severe rent burden
- 1605.0
Population outlook (Washington County) Hauer SSP2
- Today (2025)
- 193,324 people
- By 2030
- 211,699 · +9.5%
- By 2040
- 246,449 · +27.5%
- By 2050
- 278,447 · +44.0%
- By 2075
- 342,734 · +77.3%
- By 2100
- 382,815 · +98.0%
Race, ethnicity, and origin ACS 2023
- Neighborhood character
- Predominantly White (79%)
- Race & ethnicity
- White 79% Hispanic / Latino 15% Two or more races 6% Native American 1% Asian 1%
- Hispanic origin (detail)
- Mexican 10%
- Common ancestry
- Italian 8% Slovak 4% Scottish 2%
- Foreign-born
- 8% · Canada, Vietnam
- Languages at home
- 86% English-only · Spanish 11% Other Indo-European 1% Vietnamese 1%
Political lean MEDSL · Washington
- 2024 margin
- Solid R (+52.3) · D 23.0% · R 75.2% · Other 1.8%
- 2008→2024 swing
- +1.2pp toward D · 2008: -53.5pp · 2024: -52.3pp
- All cycles
- 2024: R+52.3 2020: R+51.7 2016: R+52.1 2012: R+67.0 2008: R+53.5
Not yet ingested
- Civics
- —
Market trends
- HPI YoY
- ▼ -356.86%
- Current HPI
- 234.9418
- Rent YoY
- ▲ 2.42%
- Metro
- St. George, UT
- State GDP YoY
- ▲ 3.54%
- F500 in state
- 2
Industry mix (Fortune 500 HQ in UT)
| Industry | F500 HQs | Revenue |
|---|---|---|
| Financial Services | 1 | $3B |
|
||
Price history
-8.1% since first listed5 events — show timeline
- 2026-05-02 Price Changed $124,000 WCBOR
- 2026-04-01 Price Changed $129,900 WCBOR
- 2026-03-23 Relisted — WCBOR
- 2026-03-07 Pending — WCBOR
- 2026-02-09 Listed $134,900 WCBOR
Cash-flow waterfall
monthlySold comps — $/sqft
last 12 mo · ≤1 miLoading sold comps…