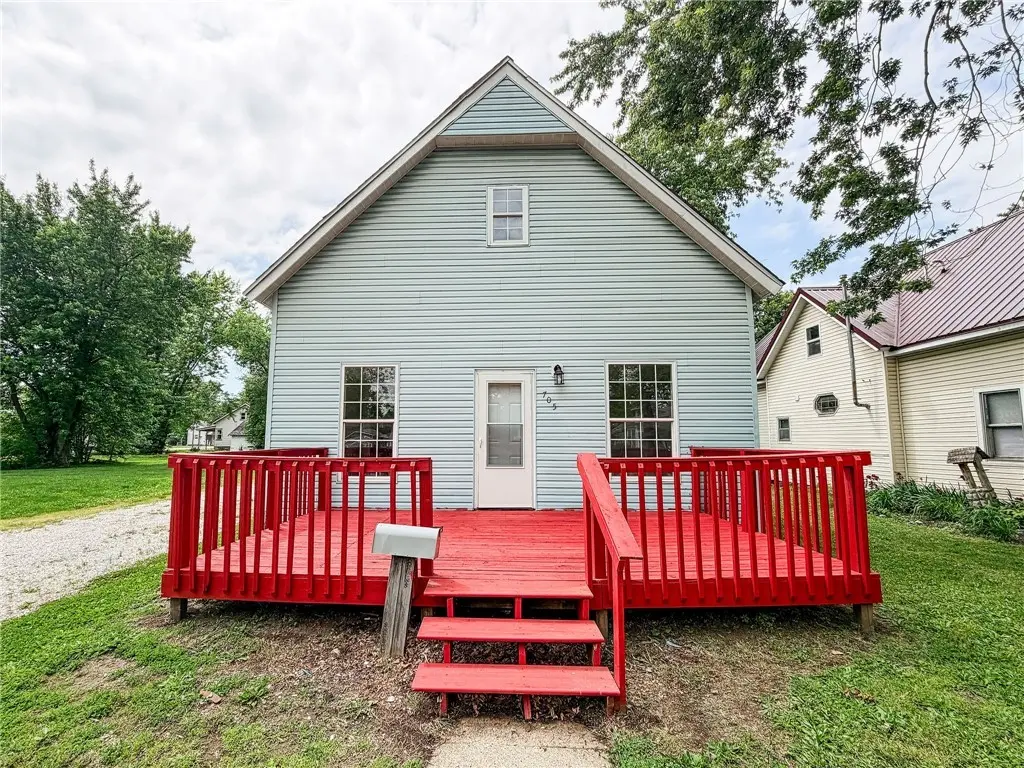
705 S Central Ave · Casey, IL
Flood risk No data
- FEMA flood zone
- —
- Chance of flooding over 30 yrs
- —
- Est. flood insurance / yr
- —
Fire risk No data
- Est. fire insurance / yr
- —
Heat risk No data
- Hot days now (above threshold)
- —
- Hot days in 30 yrs
- —
Wind risk No data
- Chance of severe wind over 30 yrs
- —
Air-quality risk No data
- Unhealthy air days now
- —
- Unhealthy air days in 30 yrs
- —
Risk factors via First Street. Map © Google.
Why this score? — see what drove the D+ grade
The composite is a weighted blend of 9 inputs, each scored 0–100. Each bar is that input's sub-score; the figure is the points it added to the 100-point composite (weight × sub-score).
- Cash flow +16.0/30.0
- ARV discount +12.4/15.0
- DSCR +4.9/10.0
- 1% rule +4.4/10.0
- Condition / age +3.8/5.0
- Livability +3.1/5.0
- Rent growth +2.5/5.0
- Schools +2.2/10.0
- Appreciation +0.0/10.0
$84,900
🖨 Deal sheet (PDF) 📄 Offer letter ✓ Due diligence
Listing remarks
Affordability, convenience, and low-maintenance all await you at 705 S Central Ave in Casey! This house is within walking distance of all the BIG things Casey has to offer. Outside, you will love the large front and back decks along with the nearly new asphalt shingle roof! Inside you will find all new flooring, new fixtures, brand new water heater, and a furnace and a/c unit that have both been replaced in the last few years. This home also features a large living space perfect for hosting that family dinner or child’s birthday party! Two generously-sized bedrooms along with a large bathroom that also houses the laundry round out the interior of this home. Cheaper than rent! Bring yo
Key facts
- All new flooring
- Large living space
- New fixtures
Tags
Property features AI
Finance
- Other: Zoning: Other
Exterior
- Security: Smoke detectors installed
- Utilities: Public water; Public sewer
- Home design: Single-family residence; One-story/home with one level; Residential property
- Construction: Vinyl siding and plaster exterior; Asphalt shingle roof
- Exterior features: Deck; Gravel road access
Interior
- Kitchen: No specific kitchen appliances listed
- Bedrooms: 6 total rooms (includes all living spaces)
- Bathrooms: 1 full bathroom
- Heating & cooling: Natural gas heating with forced air; Central air conditioning
- Interior features: Electric water heater; Crawl space basement
- Laundry & utility: Main-level laundry
Neighborhood map
What this means for you Summary
Snapshot
- This is a 2-bed/1.0-bath single-family listed at $85k. Condition is rated good.
Deal economics
- At list price, monthly cash flow is $41 ($496/yr) — positive.
- The deal already cash-flows at list — no discount required.
- To meet the 1% rule (rent ≥ 1% of price), the offer needs to be $80k (6.4% below list).
- Recommended offer: $80k (6.4% below list) — sets the bar for 1% rule.
Location & tenants
- Location reads 62/100 on livability (#849 in IL) — a middle-class / working-renter tenant base. Strengths: cost of living A+, housing A+, crime B+; Watch: employment C-, schools D, amenities F.
- Casey-Westfield CUSD 4C (town): math 19% / reading 32% proficiency, ranked #322 of 620 in IL (top 52%) — low school quality limits family demand, transient renter base, plan for 1-2y turnover.
- Market conditions: 35 active listings in the ZIP; 1 comparable units currently listed for rent nearby; 1 units permitted in Clark County in 2024 (0 in 5+ unit buildings).
Forward outlook
- Local home prices are declining (-3.0%/yr); year-one equity from $587 of loan paydown is wiped out by about $3k of value loss. Plan a longer hold.
- Clark County population projected at -20% by 2050 — secular population decline; favor cash flow + early exit over multi-decade hold.
Negotiation context
- It's been on market 32 days — a 3% lower offer ($82k) is reasonable based on typical stale-listing flexibility.
Risks & watch-outs
- Watch-outs: built in 1900 — expect roof / HVAC / electrical / plumbing capex.
Questions for the listing agent
- It's been on market 32 days. Have you received any prior offers? Is the seller open to a 6% concession, seller financing, or rate buy-down credit?
- Built in 1900 — when were the roof, HVAC, electrical panel, plumbing, and water heater last replaced?
- Is there a deadline driving the sale (1031 exchange, divorce, estate, relocation)? That informs how much negotiation room exists.
- Schools are D-rated, which usually means shorter tenancies and higher turnover. Who's the typical renter profile here, and what's been the actual vacancy rate?
- The area grade is low — what's the realistic commute time and amenity access for the typical tenant pool here? Any planned neighborhood developments (good or bad) we should know about?
- What's the average days-on-market for RENTAL listings here right now (not sales)? A rising rental-DOM trend means longer vacancies and softer asking-rent achievability than the comps imply.
- What's the recent tenant-quality profile in this submarket — average credit score on applications, eviction rate, late-payment / NSF rate, and stable-employment percentage? A property-management company in the area should have these aggregated.
- How much new for-sale + rental construction is in the pipeline within 1–3 miles? Heavy new supply typically softens prices + rents 12–24 months out; constrained supply supports both.
Investment metrics
- 1% rule
- 0.94% ✗
- Cap rate
- 6.88%
- Cash-on-cash
- 2.09%
- DSCR
- 1.09
- GRM
- 8.9
CMA / ARV
- ARV (on-the-fly)
- $95,316
- Comps found
- 7
Show comp detail 7 sales within ~0.75 mi
| Address | Dist | Beds/Ba | Sqft | Sold | Price | $/sf | Match |
|---|---|---|---|---|---|---|---|
| 100 E Madison Ave | 0.24mi | 2/1.0 | 1,088 (+7%) | 6mo | $212,000 | $195 | 71 |
| 112 NW 4th St | 0.57mi | 2/1.5 | 1,088 (+7%) | 1mo | $130,000 | $119 | 59 |
| 809 SW 3rd St | 0.22mi | 3/1.0 (+1) | 1,136 (+12%) | 15mo | $78,700 | $69 | 53 |
| 408 E Adams Ave | 0.47mi | 2/1.0 | 1,138 (+12%) | 8mo | $60,000 | $53 | 51 |
| 300 W Alabama Ave | 0.50mi | 3/1.0 (+1) | 928 (-8%) | 11mo | $42,000 | $45 | 48 |
| 301 NW 1st St | 0.63mi | 2/1.0 | 908 (-10%) | 15mo | $85,000 | $94 | 40 |
| 203 NW 4th St | 0.63mi | 3/2.0 (+1) | 1,164 (+15%) | 12mo | $159,000 | $137 | 27 |
Match score weights: distance 35% · size 25% · config 20% · recency 20%. Top-matched comps best support the ARV.
Projected returns pro-forma
-3.0% appreciation · 3.0% rent growth · sell at horizon
- IRR
- -13.0%
- Equity multiple
- 0.53×
- Total profit
- $-11,113
- Equity at exit
- $12,659
- IRR
- -4.0%
- Equity multiple
- 0.74×
- Total profit
- $-6,239
- Equity at exit
- $7,341
Cash invested: $23,772 (down + closing). Projections, not guarantees.
Landlord ↔ Tenant lean methodology
- Overall (STATE)
- 43 Moderately Tenant-Leaning
- State Illinois
- 43 Moderately Tenant-Leaning · D+7
- County
- — inherits STATE
- City
- — inherits STATE
ZIP-level market 62420
- Home prices YoY
- -8.9%
- Active inventory
- 35
- Price-to-rent
- 8.9×
Monthly cashflow live
- Estimated rent
- $795 medium interval (Pro) →
- Mortgage (P&I)
- −$445
- Tax est. 1.5%
- −$106 /mo · $1,274/yr
- Insurance
- −$35
- HOA
- −$0
- Vacancy / Maint / Mgmt
- −$167
- Net cashflow
- $41
Break-even live
Sensitivity live
| Price | -10% $100 | -5% $71 | +0% $41 | +5% $12 | +10% $-17 |
|---|---|---|---|---|---|
| Rent | -10% $-21 | -5% $10 | +0% $41 | +5% $73 | +10% $104 |
| Rate | -1.0pp $84 | -0.5pp $63 | base $41 | +0.5pp $19 | +1.0pp $-3 |
UW: 25.0% down · 7.5% · 30yr · 1.5% tax · 5.0% vac · 8.0% maint · 8.0% mgmt
Financing live
Cash to close
- Down payment
- $21,225
- Closing costs
- $2,547
- Reserves months
- —
- Total cash needed
- —
Loan-product check · same deal, 3 products live
Conventional
25% down · 7.5% · 30yr
- Down + closing
- —
- Monthly P&I
- —
- Monthly cashflow
- —
- DSCR
- —
- Eligible?
- —
Personal DTI + credit; lowest rate.
DSCR
20% down · 8.5% · 30yr
- Down + closing
- —
- Monthly P&I
- —
- Monthly cashflow
- —
- DSCR
- —
- Eligible?
- —
No personal income docs; deal must DSCR.
Hard money
10% down · 12.0% · 12mo
- Down + closing
- —
- Monthly P&I
- —
- Monthly cashflow
- —
- DSCR
- —
- Eligible?
- —
Short-term bridge; refi at stabilization.
Rent comps 1 comps
| Address | Beds | Baths | Sqft | Rent | $/sqft | DOM | Units | Dist |
|---|---|---|---|---|---|---|---|---|
| 14 N Central Ave Unit 212 Casey, IL | 3.0 | 1.0 | 900 | $795 | $0.88 | 44d | 1 | 0.48mi |
Listing history 16 events
-
2026-06-19days on market $84,900 Active 32 DOM
-
2026-06-18days on market $84,900 Active 31 DOM
-
2026-06-17days on market $84,900 Active 30 DOM
-
2026-06-16days on market $84,900 Active 29 DOM
-
2026-06-15days on market $84,900 Active 28 DOM
-
2026-06-14days on market $84,900 Active 26 DOM
-
2026-06-12days on market $84,900 Active 25 DOM
-
2026-06-09days on market $84,900 Active 22 DOM
-
2026-06-08days on market $84,900 Active 21 DOM
-
2026-06-07days on market $84,900 Active 20 DOM
-
2026-06-02days on market $84,900 Active 15 DOM
-
2026-06-01days on market $84,900 Active 14 DOM
-
2026-05-31days on market $84,900 Active 13 DOM
-
2026-05-30days on market $84,900 Active 12 DOM
-
2026-05-18$84,900 Active
-
2012-06-01historical
ⓘ Source: listings_history table (triggers on properties + properties_extension) + one-shot
backfill from property_details.listing_events for pre-trigger history.
Nearby sold comps map
Loading sold comps map…
Walkable amenities ~0.75 mi
Loading nearby amenities…
Taxation est. · year 1
- Rental income
- $9,540
- − Mortgage interest
- −$4,756
- − Property taxes
- −$1,274
- − Insurance
- −$424
- − Repairs & maintenance
- −$763
- − Management
- −$763
- − Depreciation
- −$2,470
- Taxable loss
- −$910
- Est. tax savings @ 24.0%
- +$218
- After-tax cash flow
- $714/yr
For passive investors: Depreciation is non-cash, so a rental often shows a tax loss while cash-flowing — sheltering income. Rental losses are passive: they offset passive income freely, and up to $25,000/yr can offset ordinary (W-2) income if you actively participate and your MAGI is under $100k (phasing out to $0 by $150k); unused losses carry forward. On sale, claimed depreciation is recaptured at up to 25%, and gains may owe capital-gains tax (a 1031 exchange can defer both). Figures are a year-1 estimate at your 24.0% rate — not tax advice; consult a CPA.
Condition & rehab AI · 12 photos
This single-family home in Casey, IL is in good condition with recent updates, including new flooring, HVAC, and water heater. The large front and back decks and nearly new roof add to its appeal. Minor exterior painting and gutter cleaning would further enhance its value.
Value-add opportunities
- Both Paint exterior — Enhances curb appeal and value
- Both Replace gutters — Improves drainage and prevents water damage
Renovation cost estimate screening
Value-add ROI direction
- Both Paint exterior — Enhances curb appeal and value ↑
- Both Replace gutters — Improves drainage and prevents water damage ↑
ⓘ Cost ranges are severity-bucket heuristics (US national rule-of-thumb). Get contractor quotes + a written scope before underwriting a rehab budget.
Schools (NCES district)
- District
- Casey-Westfield CUSD 4C
- NCES district ID
- 1700002
- Math proficiency
- 19% ▼ -13.00%
- Reading proficiency
- 32% ▼ -12.00%
- Median HH income
- $45,497
- Composite
- 21.99/100
- National rank
- #8208
- State rank
- #322 of 620 in IL
Livability — Casey
- Score
- 62/100
- State rank
- #849
- US rank
- #16670
Category grades
Schools grade is shown separately in the Schools card above.
Census & demographics
- Census place
- Casey, IL
- Population (ZIP)
- 4,361
Population outlook (Clark County) Hauer SSP2
- Today (2025)
- 14,978 people
- By 2030
- 14,380 · -4.0%
- By 2040
- 13,135 · -12.3%
- By 2050
- 11,920 · -20.4%
- By 2075
- 9,254 · -38.2%
- By 2100
- 6,737 · -55.0%
Race, ethnicity, and origin ACS 2023
- Neighborhood character
- Predominantly White (95%)
- Race & ethnicity
- White 95% Hispanic / Latino 3% Two or more races 2% Black 1%
- Common ancestry
- Iranian 2% Italian 1% Serbian 1%
- Foreign-born
- 1% · Canada
- Languages at home
- 98% English-only · Spanish 2%
Political lean MEDSL · Clark
- 2024 margin
- Solid R (+51.2) · D 23.5% · R 74.7% · Other 1.8%
- 2008→2024 swing
- -43.2pp toward R · 2008: -8.1pp · 2024: -51.2pp
- All cycles
- 2024: R+51.2 2020: R+50.7 2016: R+47.9 2012: R+32.5 2008: R+8.1
Not yet ingested
- Civics
- —
Market trends
- HPI YoY
- ▼ -17.02%
- Current HPI
- 174.2999
- Rent YoY
- —
- Metro
- —
- State GDP YoY
- ▲ 1.59%
- F500 in state
- 60
Industry mix (Fortune 500 HQ in IL)
| Industry | F500 HQs | Revenue |
|---|---|---|
| Insurance | 4 | $201B |
|
||
| Consumer Goods | 4 | $87B |
|
||
| Industrial Machinery | 3 | $64B |
|
||
| Healthcare | 2 | $55B |
|
||
| Retail / Pharmacy | 1 | $148B |
|
||
| Agriculture / Food | 1 | $86B |
|
||
Price history
2 events — show timeline
- 2026-05-18 Listed $84,900 CIBR
- 2012-06-01 Listing Removed — MRED as Distributed by MLS Grid
Cash-flow waterfall
monthlySold comps — $/sqft
last 12 mo · ≤1 miLoading sold comps…