6535 Broadway Unit 2E · New York, NY
Flood risk 7/10 · Major
- FEMA flood zone
- X (unshaded)
- Chance of flooding over 30 yrs
- 0.78%
- Est. flood insurance / yr
- $507 – $1,088
Fire risk 3/10 · Minor
- Est. fire insurance / yr
- $691 – $1,283
Heat risk 6/10 · Moderate
- Hot days now (above 99°F)
- 7 days/yr
- Hot days in 30 yrs
- 14 days/yr
Wind risk 6/10 · Moderate
- Chance of severe wind over 30 yrs
- 27.0%
Air-quality risk 3/10 · Minor
- Unhealthy air days now
- 3 days/yr
- Unhealthy air days in 30 yrs
- 4 days/yr
Risk factors via First Street. Map © Google.
Why this score? — see what drove the B- grade
The composite is a weighted blend of 9 inputs, each scored 0–100. Each bar is that input's sub-score; the figure is the points it added to the 100-point composite (weight × sub-score).
- Cash flow +29.6/30.0
- DSCR +10.0/10.0
- 1% rule +8.3/10.0
- ARV discount +7.5/15.0
- Schools +5.0/10.0
- Livability +3.8/5.0
- Rent growth +2.5/5.0
- Condition / age +2.5/5.0
- Appreciation +0.0/10.0
$170,000
🖨 Deal sheet (PDF) 📄 Offer letter ✓ Due diligence
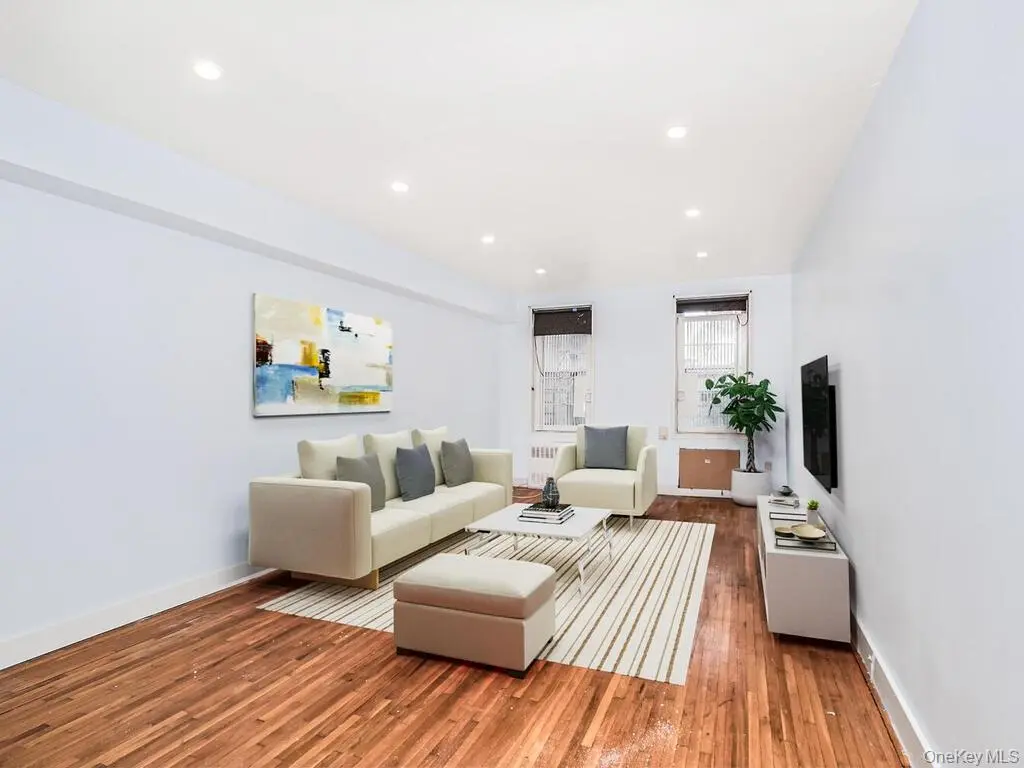
Listing remarks
Enjoy this beautiful 1-bedroom coop in a prime location that perfectly balances city convenience with nature's serenity. From the comfort of your bedroom, you can take in views of Van Cortlandt Park. With public transportation and parkways right at your doorstep, commuting to downtown or escaping to nature for a weekend getaway is effortless. This stunning unit is ready for occupancy, offering the ideal blend of style and functionality. Don't miss this rare opportunity to own your dream home—schedule a viewing today!
Key facts
- Parkways
- Built 1969
- Listed 89 days
Tags
Property features AI
Exterior
- Parking: No carport; Parking: waitlist
- Utilities: Con-Edison electric service; Public sewer; Cable available; Electricity connected; Sewer connected; Trash collection (public); Water connected
- Home design: Stock cooperative; Entry level: 1
- Construction: Brick construction
- Exterior features: Brick exterior; Not waterfront
Interior
- Kitchen: Convection oven; Refrigerator
- Bedrooms: 3 rooms total (includes bedrooms and living spaces)
- Bathrooms: 1 full bathroom
- Heating & cooling: Wall/window air conditioning units; Heating: see remarks / other
- Interior features: Other interior features; Second floor location
- Laundry & utility: Laundry room
Neighborhood map
What this means for you Summary
Snapshot
- This is a 1-bed/1.0-bath condo listed at $170k.
Deal economics
- At list price, monthly cash flow is $545 ($7k/yr) — positive.
- The deal already cash-flows at list — no discount required.
- Meets the 1% rule at list price ($2k rent vs $170k).
- Recommended offer: $160k (6.0% below list) — sets the bar for market timing.
- Cap rate 10.6% vs local median 2.6% in New York — top-decile yield for the area; either an underpriced asset or a hidden risk that comps aren't pricing in. Stress-test before assuming the spread holds.
Location & tenants
- Location reads 75/100 on livability (#268 in NY, #4,188 nationally) — a middle-class / working-renter tenant base. Strengths: amenities A+, commute A+, health & safety A; Watch: crime F, cost of living F.
- Market conditions: 201 active listings in the ZIP; 10 comparable units currently listed for rent nearby; rentals at typical pace (median 20d on market — plan ~3-4 weeks tenant-placement turnaround); solid renter incomes; 6,929 units permitted in Bronx County in 2024 (6,829 in 5+ unit buildings).
Forward outlook
- Local home prices are declining (-3.0%/yr); year-one equity from $1k of loan paydown is wiped out by about $5k of value loss. Plan a longer hold.
- Bronx County population projected at +21% by 2050 — long-run rental-demand tailwind backs the buy-and-hold thesis.
- At projected returns (-3.0% appreciation + 3.0% rent growth), your $48k cash investment doubles in ~9 years — after that, you're playing with house money.
Negotiation context
- It's been on market 90 days — a 6% lower offer ($160k) is reasonable based on typical stale-listing flexibility.
- 5 sale attempts since 3y ago with the ask held roughly flat each time — persistent listings suggest the price (not the market) is what's stuck; bring a comps-based counter.
Risks & watch-outs
- Watch-outs: flood insurance adds $66/mo.
- Climate carrying-cost: major flood risk; major wind risk, 27% chance of damaging wind over 30y; extreme-heat days projected 7→14/yr by 2055 (HVAC capex compounding) — expect insurance premiums to compound above CPI over the hold.
Questions for the listing agent
- It's been on market 90 days. Have you received any prior offers? Is the seller open to a 6% concession, seller financing, or rate buy-down credit?
- Built in 1969 — when were the roof, HVAC, electrical panel, plumbing, and water heater last replaced?
- What's the actual annual flood-insurance premium (NFIP or private), and is the property in a SFHA with mandatory coverage?
- Any open or pending special assessments — roof, HVAC, plumbing, elevator, façade? What's the per-unit balance and payoff schedule, and is the seller paying it off at close or rolling it to the buyer?
- Why hasn't it sold? Are there any deal-killer items the seller is aware of (foundation, flood, title, zoning, code violations)?
- Is there a deadline driving the sale (1031 exchange, divorce, estate, relocation)? That informs how much negotiation room exists.
- Schools are B-rated — typically a magnet for longer-tenancy family renters. What's the average tenant stay here, and is there a school-zone premium baked into asking?
- Crime grade is F in this area — have there been break-ins, vandalism, or insurance claims at this property in the last 3 years? What carrier currently insures it and at what premium?
- What's the average days-on-market for RENTAL listings here right now (not sales)? A rising rental-DOM trend means longer vacancies and softer asking-rent achievability than the comps imply.
- What's the recent tenant-quality profile in this submarket — average credit score on applications, eviction rate, late-payment / NSF rate, and stable-employment percentage? A property-management company in the area should have these aggregated.
- How much new apartment / multifamily construction is in the pipeline within 1–3 miles? Heavy new supply (>2% of stock underway) typically softens rents 12–24 months out; light construction supports rent growth.
Investment metrics
- 1% rule
- 1.33% ✓
- Cap rate
- 10.61%
- Cash-on-cash
- 15.41%
- DSCR
- 1.69
- GRM
- 6.3
CMA / ARV
No comps found within radius.
Projected returns pro-forma
-3.0% appreciation · 3.0% rent growth · sell at horizon
- IRR
- 3.9%
- Equity multiple
- 1.15×
- Total profit
- $7,239
- Equity at exit
- $25,348
- IRR
- 13.5%
- Equity multiple
- 2.08×
- Total profit
- $51,304
- Equity at exit
- $14,698
Cash invested: $47,600 (down + closing). Projections, not guarantees.
Landlord ↔ Tenant lean methodology
- Overall (CITY)
- 0 Strongly Tenant-Friendly
- State New York
- 15 Strongly Tenant-Friendly · D+10
- County
- — inherits STATE
- City New York
- 0 Strongly Tenant-Friendly · D+34
ZIP-level market 10471
- Active inventory
- 201
- Price-to-rent
- 6.3×
Monthly cashflow live
- Estimated rent
- $2,261 high interval (Pro) →
- Mortgage (P&I)
- −$891
- Tax est. 1.5%
- −$212 /mo · $2,550/yr
- Insurance
- −$71
- Flood insurance flood zone
- −$66 /mo · $798/yr
- HOA
- −$0
- Vacancy / Maint / Mgmt
- −$475
- Net cashflow
- $545
Break-even live
Sensitivity live
| Price | -10% $662 | -5% $604 | +0% $545 | +5% $486 | +10% $428 |
|---|---|---|---|---|---|
| Rent | -10% $366 | -5% $456 | +0% $545 | +5% $634 | +10% $724 |
| Rate | -1.0pp $631 | -0.5pp $588 | base $545 | +0.5pp $501 | +1.0pp $456 |
UW: 25.0% down · 7.5% · 30yr · 1.5% tax · 5.0% vac · 8.0% maint · 8.0% mgmt
Financing live
Cash to close
- Down payment
- $42,500
- Closing costs
- $5,100
- Reserves months
- —
- Total cash needed
- —
Loan-product check · same deal, 3 products live
Conventional
25% down · 7.5% · 30yr
- Down + closing
- —
- Monthly P&I
- —
- Monthly cashflow
- —
- DSCR
- —
- Eligible?
- —
Personal DTI + credit; lowest rate.
DSCR
20% down · 8.5% · 30yr
- Down + closing
- —
- Monthly P&I
- —
- Monthly cashflow
- —
- DSCR
- —
- Eligible?
- —
No personal income docs; deal must DSCR.
Hard money
10% down · 12.0% · 12mo
- Down + closing
- —
- Monthly P&I
- —
- Monthly cashflow
- —
- DSCR
- —
- Eligible?
- —
Short-term bridge; refi at stabilization.
Rent comps 10 comps
| Address | Beds | Baths | Sqft | Rent | $/sqft | DOM | Units | Dist |
|---|---|---|---|---|---|---|---|---|
| 249 McLean Ave Unit 1B Yonkers, NY | 1.0 | 1.0 | 700 | $2,500 | $3.57 | 19d | 1 | 0.49mi |
| 36 Bruce Ave Yonkers, NY | 1.0 | 1.0 | 625 | $1,785 | $2.86 | 45d | 1 | 0.66mi |
| 57 Putnam Ave Yonkers, NY | 2.0 | 1.0 | 900 | $3,000 | $3.33 | 23d | 1 | 0.76mi |
| 57 Putnam Ave Yonkers, NY | 2.0 | 1.0 | 900 | $3,000 | $3.33 | 13d | 1 | 0.76mi |
| 130 Harrison Ave Yonkers, NY | 1.0 | 1.0 | 650 | $1,900 | $2.92 | 45d | 1 | 0.95mi |
| 675 McLean Ave Unit 006H Yonkers, NY | 1.0 | 1.0 | 577 | $2,071 | $3.59 | 6d | 1 | 1.07mi |
| 117 Morris St Yonkers, NY | 1.0 | 1.0 | 700 | $2,000 | $2.86 | 6d | 1 | 1.09mi |
| 280 Hawthorne Ave Yonkers, NY | 1.0 | 1.0 | 700 | $2,100 | $3.00 | 8d | 2 | 1.12mi |
| 14 Highland Ave Unit 2A Yonkers, NY | 1.0 | 1.0 | 1000 | $1,500 | $1.50 | 20d | 1 | 1.20mi |
| 212 Buena Vista Ave Unit 3F Yonkers, NY | 1.0 | 1.0 | 800 | $2,100 | $2.62 | 20d | 1 | 1.48mi |
HOA detail condo
- Monthly dues
- $0 · $0/yr
- Assessments
- None detected in remarks — confirm with the listing agent.
Listing history 23 events
-
2026-06-21days on market $170,000 Active 90 DOM
-
2026-06-18days on market $170,000 Active 87 DOM
-
2026-06-17days on market $170,000 Active 86 DOM
-
2026-06-15days on market $170,000 Active 84 DOM
-
2026-06-13days on market $170,000 Active 82 DOM
-
2026-06-10days on market $170,000 Active 78 DOM
-
2026-06-08days on market $170,000 Active 77 DOM
-
2026-06-08days on market $170,000 Active 76 DOM
-
2026-06-04days on market $170,000 Active 73 DOM
-
2026-06-03days on market $170,000 Active 72 DOM
-
2026-06-01days on market $170,000 Active 70 DOM
-
2026-05-31days on market $170,000 Active 69 DOM
-
2026-03-23$170,000 Active
-
2026-03-23historical
-
2025-11-17$170,000 Active
-
2025-07-26historical
-
2025-03-13status Active
-
2025-03-08historical
-
2025-02-27price $169,999
-
2024-10-09status Active
-
2024-09-22historical
-
2024-08-05price $179,000
-
2023-09-22$180,000 Active
ⓘ Source: listings_history table (triggers on properties + properties_extension) + one-shot
backfill from property_details.listing_events for pre-trigger history.
Climate risk First Street
- Flood 7/10 Severe FEMA zone X (unshaded) · 78% chance over 30 yrs
- Wildfire 3/10 Moderate
- Heat 6/10 Major 7 d/yr ≥99°F today · 14 d/yr by 30 yrs out
- Wind 6/10 Major 27% chance of damaging wind over 30 yrs
- Air quality 3/10 Moderate 3 unhealthy d/yr today · 4 by 30 yrs out
Nearby sold comps map
Loading sold comps map…
Walkable amenities ~0.75 mi
Loading nearby amenities…
Taxation est. · year 1
- Rental income
- $27,133
- − Mortgage interest
- −$9,523
- − Property taxes
- −$2,550
- − Insurance
- −$1,648
- − Repairs & maintenance
- −$2,171
- − Management
- −$2,171
- − Depreciation
- −$4,945
- Taxable income
- $4,126
- Est. tax owed @ 24.0%
- −$990
- After-tax cash flow
- $5,550/yr
For passive investors: Depreciation is non-cash, so a rental often shows a tax loss while cash-flowing — sheltering income. Rental losses are passive: they offset passive income freely, and up to $25,000/yr can offset ordinary (W-2) income if you actively participate and your MAGI is under $100k (phasing out to $0 by $150k); unused losses carry forward. On sale, claimed depreciation is recaptured at up to 25%, and gains may owe capital-gains tax (a 1031 exchange can defer both). Figures are a year-1 estimate at your 24.0% rate — not tax advice; consult a CPA.
Schools (NCES district)
No district data.
Livability — New York
- Score
- 75/100
- State rank
- #268
- US rank
- #4188
Category grades
Schools grade is shown separately in the Schools card above.
Census & demographics
- Census place
- New York, NY
- County
- Bronx County · 1,197,324 people
- City population
- 7,731,280
- Metro
- New York-Newark-Jersey City, NY-NJ-PA
- Population (ZIP)
- 23,798
- Household income
- $103,046
- Rent vs Own
- Severe rent burden
- 553.0
Population outlook (Bronx County) Hauer SSP2
- Today (2025)
- 1,607,353 people
- By 2030
- 1,681,852 · +4.6%
- By 2040
- 1,824,421 · +13.5%
- By 2050
- 1,945,470 · +21.0%
- By 2075
- 2,187,887 · +36.1%
- By 2100
- 2,244,136 · +39.6%
Race, ethnicity, and origin ACS 2023
- Neighborhood character
- Diverse neighborhood (Simpson 0.62)
- Race & ethnicity
- White 53% Hispanic / Latino 31% Two or more races 16% Black 7% Asian 4%
- Hispanic origin (detail)
- Mexican 1% Puerto Rican 8% Dominican 11%
- Common ancestry
- Scotch-Irish 4% Romanian 3% Italian 2%
- Foreign-born
- 20% · Canada, Jamaica, China
- Languages at home
- 65% English-only · Spanish 21% Russian/Polish/Slavic 4% Other Indo-European 3%
Political lean MEDSL · Bronx
- 2024 margin
- Solid D (+45.4) · D 72.7% · R 27.3%
- 2008→2024 swing
- -32.3pp toward R · 2008: 77.8pp · 2024: 45.4pp
- All cycles
- 2024: D+45.4 2020: D+67.6 2016: D+79.1 2012: D+82.9 2008: D+77.8
Not yet ingested
- Civics
- —
Market trends
- HPI YoY
- ▼ -114.80%
- Current HPI
- 197.2006
- Rent YoY
- —
- Metro
- New York-Newark-Jersey City, NY-NJ-PA
- State GDP YoY
- ▲ 2.60%
- F500 in state
- 92
Industry mix (Fortune 500 HQ in NY)
| Industry | F500 HQs | Revenue |
|---|---|---|
| Financial Services | 10 | $950B |
|
||
| Consumer Goods | 9 | $162B |
|
||
| Insurance | 4 | $225B |
|
||
| Telecommunications | 2 | $144B |
|
||
| Pharmaceuticals | 2 | $112B |
|
||
| Media / Entertainment | 2 | $69B |
|
||
Price history
-5.6% since first listed11 events — show timeline
- 2026-03-23 Listing Removed — OneKey® MLS as Distributed by MLS Grid
- 2026-03-23 Listed $170,000 OneKey® MLS as Distributed by MLS Grid
- 2025-11-17 Listed $170,000 OneKey® MLS as Distributed by MLS Grid
- 2025-07-26 Listing Removed — OneKey® MLS as Distributed by MLS Grid
- 2025-03-13 Relisted — OneKey® MLS as Distributed by MLS Grid
- 2025-03-08 Listing Removed — OneKey® MLS as Distributed by MLS Grid
- 2025-02-27 Price Changed $169,999 OneKey® MLS as Distributed by MLS Grid
- 2024-10-09 Relisted — OneKey® MLS as Distributed by MLS Grid
- 2024-09-22 Listing Removed — OneKey® MLS as Distributed by MLS Grid
- 2024-08-05 Price Changed $179,000 OneKey® MLS as Distributed by MLS Grid
- 2023-09-22 Listed $180,000 OneKey® MLS as Distributed by MLS Grid
Cash-flow waterfall
monthlySold comps — $/sqft
last 12 mo · ≤1 miLoading sold comps…