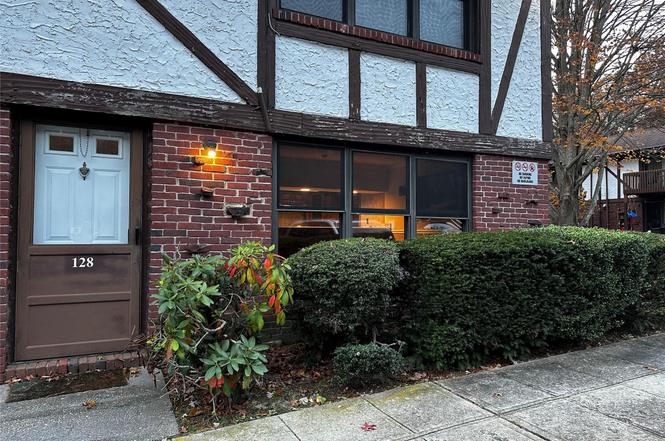
128 Bailey Ct #128 · Middle Island, NY
Flood risk 1/10 · Minimal
- FEMA flood zone
- X (unshaded)
- Chance of flooding over 30 yrs
- 0.0%
- Est. flood insurance / yr
- $507 – $1,088
Fire risk 3/10 · Minor
- Est. fire insurance / yr
- $691 – $1,283
Heat risk 5/10 · Moderate
- Hot days now (above 93°F)
- 7 days/yr
- Hot days in 30 yrs
- 19 days/yr
Wind risk 8/10 · Major
- Chance of severe wind over 30 yrs
- 80.0%
Air-quality risk 4/10 · Minor
- Unhealthy air days now
- 3 days/yr
- Unhealthy air days in 30 yrs
- 5 days/yr
Risk factors via First Street. Map © Google.
Why this score? — see what drove the D- grade
The composite is a weighted blend of 9 inputs, each scored 0–100. Each bar is that input's sub-score; the figure is the points it added to the 100-point composite (weight × sub-score).
- ARV discount +7.5/15.0
- 1% rule +6.9/10.0
- Cash flow +6.6/30.0
- Schools +5.2/10.0
- Livability +3.2/5.0
- Rent growth +2.5/5.0
- Condition / age +2.5/5.0
- DSCR +0.8/10.0
- Appreciation +0.0/10.0
$204,900
🖨 Deal sheet (PDF) 📄 Offer letter ✓ Due diligence
Listing remarks
Discover this stunning, fully redesigned end-unit co-op that combines modern luxury with thoughtful craftsmanship. Updated just four years ago, this one-of-a-kind home has been completely reimagined — an entertainer’s dream! The open-concept kitchen features rich cherry wood cabinetry, granite countertops, stainless steel appliances, bar sink and wine refrigerator, ideal for hosting or casual dining at the breakfast counter. Elegant cherry wood floors flow through the living room and bedroom, while the kitchen, entryway, and bath showcase beautiful custom tile work. Every detail has been meticulously upgraded — entirely re-sheet rocked, soundproofed, replumbed, and enhanc
Key facts
- Wine refrigerator
- Open-concept kitchen
- Bar sink
Tags
Neighborhood map
What this means for you Summary
Snapshot
- This is a 1-bed/1.0-bath condo listed at $205k.
Deal economics
- At list price, monthly cash flow is $-340 ($-4k/yr) — negative.
- The deal already cash-flows at list — no discount required.
- Meets the 1% rule at list price ($2k rent vs $205k).
- Recommended offer: $202k (1.5% below list) — sets the bar for market timing.
- Cap rate 4.3% vs local median 3.3% in Middle Island — meaningfully above typical; check what's discounted (condition, days-on-market, listing class) to confirm the premium yield is real.
Location & tenants
- Location reads 65/100 on livability (#703 in NY) — a middle-class / working-renter tenant base. Strengths: employment A+, housing A+; Watch: crime C-, amenities F, commute F.
- Longwood Central School District (rural): math 61% / reading 55% proficiency, ranked #235 of 590 in NY (top 40%) — acceptable for families but not a draw, mixed tenant base, ~2y average lease.
- Zoned schools: Ridge Elementary School (math 42% / reading 57%, grade D, #1,085 of 2,108 statewide, top 56%, 719 students, 44% FRL); Longwood Junior High School (math 67% / reading 67%, grade A-, #101 of 729 statewide, top 15%, 1,388 students, 48% FRL); Longwood High School (math 90% / reading 77%, grade A, #409 of 1,100 statewide, top 39%, 2,977 students, 44% FRL).
- Market conditions: 123 active listings in the ZIP; 7 comparable units currently listed for rent nearby; rentals lingering (median 46d on market — plan ~5-8 weeks vacancy on turnover, expect pricing pressure); 100% of comp listings sitting > 30 days — soft ceiling on asking rent; 1,366 units permitted in Suffolk County in 2024 (216 in 5+ unit buildings).
Forward outlook
- Local home prices are declining (-3.0%/yr); year-one equity from $1k of loan paydown is wiped out by about $6k of value loss. Plan a longer hold.
- Suffolk County population projected to shrink 5% by 2050 — rents likely to lag national; underwrite the cash flow, not the appreciation.
Negotiation context
- It's been on market 22 days — a 2% lower offer ($202k) is reasonable based on typical stale-listing flexibility.
Risks & watch-outs
- Watch-outs: HOA is 35% of rent.
- Climate carrying-cost: severe wind risk, 80% chance of damaging wind over 30y; extreme-heat days projected 7→19/yr by 2055 (HVAC capex compounding) — expect insurance premiums to compound above CPI over the hold.
Questions for the listing agent
- What do current leases actually rent for vs. the listed asking? Can we see a recent rent roll and the last 12 months of T-12 income?
- Built in 1970 — when were the roof, HVAC, electrical panel, plumbing, and water heater last replaced?
- What does the HOA fee cover, when was the last increase, and are there any pending special assessments or reserve-fund shortfalls?
- Any open or pending special assessments — roof, HVAC, plumbing, elevator, façade? What's the per-unit balance and payoff schedule, and is the seller paying it off at close or rolling it to the buyer?
- Is there a deadline driving the sale (1031 exchange, divorce, estate, relocation)? That informs how much negotiation room exists.
- Schools are B-rated — typically a magnet for longer-tenancy family renters. What's the average tenant stay here, and is there a school-zone premium baked into asking?
- The area grade is low — what's the realistic commute time and amenity access for the typical tenant pool here? Any planned neighborhood developments (good or bad) we should know about?
- What's the average days-on-market for RENTAL listings here right now (not sales)? A rising rental-DOM trend means longer vacancies and softer asking-rent achievability than the comps imply.
- What's the recent tenant-quality profile in this submarket — average credit score on applications, eviction rate, late-payment / NSF rate, and stable-employment percentage? A property-management company in the area should have these aggregated.
- How much new apartment / multifamily construction is in the pipeline within 1–3 miles? Heavy new supply (>2% of stock underway) typically softens rents 12–24 months out; light construction supports rent growth.
Investment metrics
- 1% rule
- 1.19% ✓
- Cap rate
- 4.30%
- Cash-on-cash
- -7.12%
- DSCR
- 0.68
- GRM
- 7.0
CMA / ARV
No comps found within radius.
Projected returns pro-forma
-3.0% appreciation · 3.0% rent growth · sell at horizon
- IRR
- -28.2%
- Equity multiple
- 0.05×
- Total profit
- $-54,313
- Equity at exit
- $30,551
- IRR
- -25.9%
- Equity multiple
- -0.27×
- Total profit
- $-72,917
- Equity at exit
- $17,716
Cash invested: $57,372 (down + closing). Projections, not guarantees.
Landlord ↔ Tenant lean methodology
- Overall (STATE)
- 15 Strongly Tenant-Friendly
- State New York
- 15 Strongly Tenant-Friendly · D+10
- County
- — inherits STATE
- City
- — inherits STATE
ZIP-level market 11953
- Home prices YoY
- -20.2%
- Active inventory
- 123
- Price-to-rent
- 7.0×
Monthly cashflow live
- Estimated rent
- $2,444 high interval (Pro) →
- Mortgage (P&I)
- −$1,075
- Tax est. 1.5%
- −$256 /mo · $3,074/yr
- Insurance
- −$85
- HOA est. from 4 same-building comps
- −$855
- Vacancy / Maint / Mgmt
- −$513
- Net cashflow
- $-340
Break-even live
Sensitivity live
| Price | -10% $-199 | -5% $-269 | +0% $-340 | +5% $-411 | +10% $-482 |
|---|---|---|---|---|---|
| Rent | -10% $-533 | -5% $-437 | +0% $-340 | +5% $-244 | +10% $-147 |
| Rate | -1.0pp $-237 | -0.5pp $-288 | base $-340 | +0.5pp $-393 | +1.0pp $-447 |
UW: 25.0% down · 7.5% · 30yr · 1.5% tax · 5.0% vac · 8.0% maint · 8.0% mgmt
Financing live
Cash to close
- Down payment
- $51,225
- Closing costs
- $6,147
- Reserves months
- —
- Total cash needed
- —
Loan-product check · same deal, 3 products live
Conventional
25% down · 7.5% · 30yr
- Down + closing
- —
- Monthly P&I
- —
- Monthly cashflow
- —
- DSCR
- —
- Eligible?
- —
Personal DTI + credit; lowest rate.
DSCR
20% down · 8.5% · 30yr
- Down + closing
- —
- Monthly P&I
- —
- Monthly cashflow
- —
- DSCR
- —
- Eligible?
- —
No personal income docs; deal must DSCR.
Hard money
10% down · 12.0% · 12mo
- Down + closing
- —
- Monthly P&I
- —
- Monthly cashflow
- —
- DSCR
- —
- Eligible?
- —
Short-term bridge; refi at stabilization.
Rent comps 7 comps
| Address | Beds | Baths | Sqft | Rent | $/sqft | DOM | Units | Dist |
|---|---|---|---|---|---|---|---|---|
| 135 Lake Pointe Ct Unit 135 Middle Island, NY | 1.0 | 1.0 | 695 | $2,405 | $3.46 | 46d | 1 | 0.78mi |
| 465 Lake Pointe Dr Unit 465 Middle Island, NY | 1.0 | 1.0 | 695 | $2,405 | $3.46 | 46d | 1 | 0.78mi |
| 463 Lake Pointe Dr Unit 463 Middle Island, NY | 1.0 | 1.0 | 695 | $2,555 | $3.68 | 46d | 1 | 0.79mi |
| 130 Lake Pointe Ct Unit 130 Brookhaven, NY | 2.0 | 1.0 | 740 | $2,435 | $3.29 | 46d | 1 | 0.79mi |
| 356 Lake Pointe Dr Unit 356 Middle Island, NY | 2.0 | 1.0 | 740 | $2,435 | $3.29 | 46d | 1 | 0.81mi |
| 444 Lake Pointe Dr Unit 444 Middle Island, NY | 2.0 | 1.0 | 740 | $2,435 | $3.29 | 46d | 1 | 0.86mi |
| 462 Lake Pointe Dr Unit 462 Middle Island, NY | 2.0 | 1.0 | 740 | $2,435 | $3.29 | 46d | 1 | 0.87mi |
HOA detail condo
- Monthly dues
- $0 · $0/yr
- Assessments
- None detected in remarks — confirm with the listing agent.
Listing history 2 events
-
2025-12-29status Pending
-
2025-11-11$204,900 Active
ⓘ Source: listings_history table (triggers on properties + properties_extension) + one-shot
backfill from property_details.listing_events for pre-trigger history.
Climate risk First Street
- Flood 1/10 Low FEMA zone X (unshaded) · 0% chance over 30 yrs
- Wildfire 3/10 Moderate
- Heat 5/10 Major 7 d/yr ≥93°F today · 19 d/yr by 30 yrs out
- Wind 8/10 Severe 80% chance of damaging wind over 30 yrs
- Air quality 4/10 Moderate 3 unhealthy d/yr today · 5 by 30 yrs out
Nearby sold comps map
Loading sold comps map…
Walkable amenities ~0.75 mi
Loading nearby amenities…
Taxation est. · year 1
- Rental income
- $29,328
- − Mortgage interest
- −$11,478
- − Property taxes
- −$3,074
- − Insurance
- −$1,024
- − Repairs & maintenance
- −$2,346
- − Management
- −$2,346
- − HOA
- −$10,260
- − Depreciation
- −$5,961
- Taxable loss
- −$7,161
- Est. tax savings @ 24.0%
- +$1,719
- After-tax cash flow
- $-2,365/yr
For passive investors: Depreciation is non-cash, so a rental often shows a tax loss while cash-flowing — sheltering income. Rental losses are passive: they offset passive income freely, and up to $25,000/yr can offset ordinary (W-2) income if you actively participate and your MAGI is under $100k (phasing out to $0 by $150k); unused losses carry forward. On sale, claimed depreciation is recaptured at up to 25%, and gains may owe capital-gains tax (a 1031 exchange can defer both). Figures are a year-1 estimate at your 24.0% rate — not tax advice; consult a CPA.
Schools (NCES district)
- District
- Longwood Central School District
- NCES district ID
- 3619230
- Math proficiency
- 61% ▬ 0.00%
- Reading proficiency
- 55% ▼ -1.00%
- Median HH income
- $72,748
- Composite
- 51.63/100
- National rank
- #1703
- State rank
- #235 of 590 in NY
Livability — Middle Island
- Score
- 65/100
- State rank
- #703
- US rank
- #13264
Category grades
Schools grade is shown separately in the Schools card above.
Census & demographics
- Census place
- Middle Island, NY
- City population
- 13,383
- Population (ZIP)
- 13,383
Population outlook (Suffolk County) Hauer SSP2
- Today (2025)
- 1,505,262 people
- By 2030
- 1,498,318 · -0.5%
- By 2040
- 1,471,101 · -2.3%
- By 2050
- 1,424,848 · -5.3%
- By 2075
- 1,337,157 · -11.2%
- By 2100
- 1,217,720 · -19.1%
Race, ethnicity, and origin ACS 2023
- Neighborhood character
- Majority White (65%)
- Race & ethnicity
- White 65% Hispanic / Latino 16% Black 15% Two or more races 7%
- Hispanic origin (detail)
- Mexican 2% Puerto Rican 6% Dominican 3%
- Common ancestry
- Romanian 4% Hispanic 2% Scotch-Irish 1%
- Foreign-born
- 12% · Canada, Jamaica, China
- Languages at home
- 87% English-only · Spanish 7% Russian/Polish/Slavic 2% French/Haitian/Cajun 2%
Political lean MEDSL · Suffolk
- 2024 margin
- Lean R (+10.0) · D 45.0% · R 55.0%
- 2008→2024 swing
- -16.0pp toward R · 2008: 6.0pp · 2024: -10.0pp
- All cycles
- 2024: R+10.0 2020: R+0.0 2016: R+8.2 2012: D+2.9 2008: D+6.0
Not yet ingested
- Civics
- —
Market trends
- HPI YoY
- ▼ -90.61%
- Current HPI
- 358.0686
- Rent YoY
- —
- Metro
- —
- State GDP YoY
- ▲ 2.60%
- F500 in state
- 92
Industry mix (Fortune 500 HQ in NY)
| Industry | F500 HQs | Revenue |
|---|---|---|
| Financial Services | 10 | $950B |
|
||
| Consumer Goods | 9 | $162B |
|
||
| Insurance | 4 | $225B |
|
||
| Telecommunications | 2 | $144B |
|
||
| Pharmaceuticals | 2 | $112B |
|
||
| Media / Entertainment | 2 | $69B |
|
||
Price history
2 events — show timeline
- 2025-12-29 Pending — OneKey® MLS as Distributed by MLS Grid
- 2025-11-11 Listed $204,900 OneKey® MLS as Distributed by MLS Grid
Cash-flow waterfall
monthlySold comps — $/sqft
last 12 mo · ≤1 miLoading sold comps…