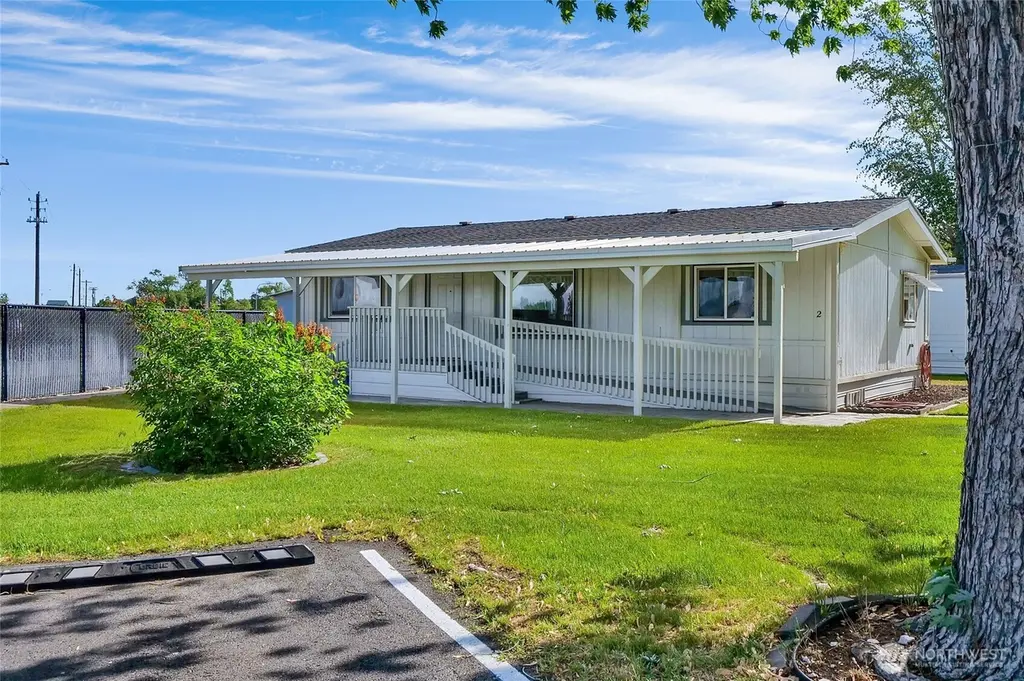
3131 W Wapato Dr #2 · Moses Lake, WA
Flood risk 1/10 · Minimal
- FEMA flood zone
- X (unshaded)
- Chance of flooding over 30 yrs
- 0.0%
- Est. flood insurance / yr
- $507 – $1,088
Fire risk 1/10 · Minimal
- Est. fire insurance / yr
- $604 – $1,122
Heat risk 4/10 · Minor
- Hot days now (above 97°F)
- 7 days/yr
- Hot days in 30 yrs
- 15 days/yr
Wind risk 1/10 · Minimal
- Chance of severe wind over 30 yrs
- —
Air-quality risk 7/10 · Major
- Unhealthy air days now
- 12 days/yr
- Unhealthy air days in 30 yrs
- 14 days/yr
Risk factors via First Street. Map © Google.
Why this score? — see what drove the B+ grade
The composite is a weighted blend of 9 inputs, each scored 0–100. Each bar is that input's sub-score; the figure is the points it added to the 100-point composite (weight × sub-score).
- Cash flow +30.0/30.0
- ARV discount +15.0/15.0
- 1% rule +10.0/10.0
- DSCR +10.0/10.0
- Schools +3.9/10.0
- Livability +3.8/5.0
- Condition / age +2.5/5.0
- Rent growth +2.1/5.0
- Appreciation +0.0/10.0
$71,000
🖨 Deal sheet (PDF) 📄 Offer letter ✓ Due diligence
Listing remarks
Park-inspected and all required repairs have been made so you can just buy and enjoy your home! New exterior paint on trim, posts, rails, ramp, and shed. Why rent when you can buy? 1985 Greenhill double-wide home with extra 2-car parking on the corner, 1,120 square feet, 3 bedrooms, 2 bath, a fantastic shed with a workbench and power in it (plugged into an outlet - not tied in, a great setup!) perfect for working on your hobbies, in a very clean location in the park. Creative storage behind kitchen counter corner accessed from the living room. And with the extra parking nearby, and no neighbor to the left or behind, there's plenty of room for company to visit. Set an appointment with a help
Key facts
- Extra parking
- New exterior paint
- Fantastic shed
Tags
Property features AI
Finance
- Other: Senior exemption: no; Pets: see remarks
- Financial info: Listing terms: Cash, Conventional; Land lease amount applies
- HOA & community: Park name: Peninsula Estates; Park approved for sale; Land lease applies
Exterior
- Parking: Uncovered parking; 2 open parking spaces
- Security: Security gate
- Utilities: Electric energy source; Community water; City sewer; Electric water heater
- Home design: Manufactured double-wide home; One level; Good condition; Has a view; Aluminum skirting; Built after 6/15/1976
- Construction: Wood construction; Composition roof
- Exterior features: Wood exterior; Wood products; Awnings; Patio/porch/deck; Corner lot; Paved
Interior
- Kitchen: Dishwasher; Refrigerator; Stove/Range
- Bedrooms: 3 bedrooms
- Flooring: Vinyl; Carpet
- Bathrooms: 2 three-quarter bathrooms; 2 showers
- Heating & cooling: Forced air heating; Central air conditioning
- Interior features: Water heater; Skylights; Vaulted ceilings; Ceiling fan(s); Walk-in closet; Landscaped
- Laundry & utility: Utility room
Neighborhood map
What this means for you Summary
Snapshot
- This is a 3-bed/2.0-bath manufactured listed at $71k.
Deal economics
- At list price, monthly cash flow is $857 ($10k/yr) — positive.
- The deal already cash-flows at list — no discount required.
- Meets the 1% rule at list price ($2k rent vs $71k).
- Recommended offer: $69k (3.0% below list) — sets the bar for market timing.
- Cap rate 20.8% vs local median 3.3% in Moses Lake — top-decile yield for the area; either an underpriced asset or a hidden risk that comps aren't pricing in. Stress-test before assuming the spread holds.
Location & tenants
- Location reads 75/100 on livability (#170 in WA, #4,228 nationally) — a middle-class / working-renter tenant base. Strengths: housing A+, health & safety A+, amenities A-; Watch: employment C-, schools D+, crime F.
- Moses Lake School District (town): math 38% / reading 48% proficiency, ranked #198 of 291 in WA (top 68%) — families likely to look elsewhere, expect single-tenant / working-renter base with shorter leases.
- Market conditions: Rents soft (-1.7%/yr); 585 active listings in the ZIP; 18 comparable units currently listed for rent nearby; rentals lingering (median 45d on market — plan ~5-8 weeks vacancy on turnover, expect pricing pressure); 100% of comp listings sitting > 30 days — soft ceiling on asking rent; 559 units permitted in Grant County in 2024 (35 in 5+ unit buildings).
Forward outlook
- Local home prices are declining (-3.0%/yr); year-one equity from $491 of loan paydown is wiped out by about $2k of value loss. Plan a longer hold.
- Grant County population projected at +16% by 2050 — long-run rental-demand tailwind backs the buy-and-hold thesis.
- At projected returns (-3.0% appreciation + 0.0% rent growth), your $20k cash investment doubles in ~3 years — after that, you're playing with house money.
Negotiation context
- It's been on market 35 days — a 3% lower offer ($69k) is reasonable based on typical stale-listing flexibility.
Questions for the listing agent
- It's been on market 35 days. Have you received any prior offers? Is the seller open to a 3% concession, seller financing, or rate buy-down credit?
- Is there a deadline driving the sale (1031 exchange, divorce, estate, relocation)? That informs how much negotiation room exists.
- Schools are D-rated, which usually means shorter tenancies and higher turnover. Who's the typical renter profile here, and what's been the actual vacancy rate?
- Crime grade is F in this area — have there been break-ins, vandalism, or insurance claims at this property in the last 3 years? What carrier currently insures it and at what premium?
- What's the average days-on-market for RENTAL listings here right now (not sales)? A rising rental-DOM trend means longer vacancies and softer asking-rent achievability than the comps imply.
- What's the recent tenant-quality profile in this submarket — average credit score on applications, eviction rate, late-payment / NSF rate, and stable-employment percentage? A property-management company in the area should have these aggregated.
- How much new for-sale + rental construction is in the pipeline within 1–3 miles? Heavy new supply typically softens prices + rents 12–24 months out; constrained supply supports both.
Investment metrics
- 1% rule
- 2.27% ✓
- Cap rate
- 20.78%
- Cash-on-cash
- 51.73%
- DSCR
- 3.30
- GRM
- 3.7
CMA / ARV
- ARV (median comp)
- $104,484
- List price
- $71,000
- Delta
- -32.05%
- Verdict
- UNDERPRICED
- Comps
- 12 within 1.0 mi
Show comp detail 5 sales within ~0.75 mi
| Address | Dist | Beds/Ba | Sqft | Sold | Price | $/sf | Match |
|---|---|---|---|---|---|---|---|
| 3010 W Peninsula Dr #103 | 0.19mi | 3/2.0 | 1,188 (+6%) | 2mo | $90,000 | $76 | 79 |
| 3131 W Wapato Dr #17 | 0.00mi | 3/2.0 | 1,056 (-6%) | 16mo | $114,000 | $108 | 77 |
| 3211 W Wapato Dr #57 | 0.13mi | 2/2.0 (-1) | 1,080 (-4%) | 9mo | $80,000 | $74 | 76 |
| 3131 W Wapato Dr #33 | 0.00mi | 3/2.0 | 1,188 (+6%) | 23mo | $105,000 | $88 | 71 |
| 3211 W Wapato Dr #66 | 0.14mi | 3/2.0 | 1,056 (-6%) | 22mo | $112,000 | $106 | 66 |
Match score weights: distance 35% · size 25% · config 20% · recency 20%. Top-matched comps best support the ARV.
Projected returns pro-forma
-3.0% appreciation · 0.0% rent growth · sell at horizon
- IRR
- 46.4%
- Equity multiple
- 2.93×
- Total profit
- $38,328
- Equity at exit
- $10,586
- IRR
- 50.9%
- Equity multiple
- 5.29×
- Total profit
- $85,305
- Equity at exit
- $6,139
Cash invested: $19,880 (down + closing). Projections, not guarantees.
Landlord ↔ Tenant lean methodology
- Overall (STATE)
- 28 Tenant-Leaning
- State Washington
- 28 Tenant-Leaning · D+8
- County
- — inherits STATE
- City
- — inherits STATE
ZIP-level market 98837
- Rents YoY
- -1.7%
- Active inventory
- 585
- Price-to-rent
- 3.7×
Monthly cashflow live
- Estimated rent
- $1,613 high interval (Pro) →
- Mortgage (P&I)
- −$372
- Tax from tax record
- −$15 /mo · $186/yr
- Insurance
- −$30
- HOA
- −$0
- Vacancy / Maint / Mgmt
- −$339
- Net cashflow
- $857
Break-even live
Sensitivity live
| Price | -10% $897 | -5% $877 | +0% $857 | +5% $837 | +10% $817 |
|---|---|---|---|---|---|
| Rent | -10% $730 | -5% $793 | +0% $857 | +5% $921 | +10% $984 |
| Rate | -1.0pp $893 | -0.5pp $875 | base $857 | +0.5pp $839 | +1.0pp $820 |
UW: 25.0% down · 7.5% · 30yr · 1.5% tax · 5.0% vac · 8.0% maint · 8.0% mgmt
Financing live
Cash to close
- Down payment
- $17,750
- Closing costs
- $2,130
- Reserves months
- —
- Total cash needed
- —
Loan-product check · same deal, 3 products live
Conventional
25% down · 7.5% · 30yr
- Down + closing
- —
- Monthly P&I
- —
- Monthly cashflow
- —
- DSCR
- —
- Eligible?
- —
Personal DTI + credit; lowest rate.
DSCR
20% down · 8.5% · 30yr
- Down + closing
- —
- Monthly P&I
- —
- Monthly cashflow
- —
- DSCR
- —
- Eligible?
- —
No personal income docs; deal must DSCR.
Hard money
10% down · 12.0% · 12mo
- Down + closing
- —
- Monthly P&I
- —
- Monthly cashflow
- —
- DSCR
- —
- Eligible?
- —
Short-term bridge; refi at stabilization.
Rent comps 18 comps
| Address | Beds | Baths | Sqft | Rent | $/sqft | DOM | Units | Dist |
|---|---|---|---|---|---|---|---|---|
| 511 S Interlake Rd Moses Lake, WA | 2.0–4.0 | 2.0 | 1095 | $1,170 | $1.07 | 44d | 8 | 0.24mi |
| 2829 W Marina Dr Unit 1 Moses Lake, WA | 3.0 | 2.5 | 1300 | $1,650 | $1.27 | 44d | 1 | 0.40mi |
| 2829 W Marina Dr Unit 6 Moses Lake, WA | 2.0 | 2.5 | 1200 | $1,550 | $1.29 | 44d | 1 | 0.40mi |
| 2821 W Marina Dr Unit 1 Moses Lake, WA | 2.0 | 2.5 | 1200 | $1,550 | $1.29 | 44d | 1 | 0.42mi |
| 2821 W Marina Dr Unit 5 Moses Lake, WA | 3.0 | 2.5 | 1300 | $1,650 | $1.27 | 44d | 1 | 0.42mi |
| 2722 W Peninsula Dr Moses Lake, WA | 2.0 | 1.0 | 858 | $1,350 | $1.57 | 44d | 1 | 0.42mi |
| 2900 W Marina Dr Moses Lake, WA | 2.0 | 2.0 | 1036 | $1,688 | $1.63 | 44d | 1 | 0.43mi |
| 2805 W Marina Dr Unit A3 Moses Lake, WA | 2.0 | 2.5 | 1350 | $1,450 | $1.07 | 44d | 1 | 0.44mi |
| 2812 W Marina Dr Unit D Moses Lake, WA | 2.0 | 2.0 | 1078 | $1,695 | $1.57 | 44d | 1 | 0.48mi |
| 2637 W Marina Dr Moses Lake, WA | 2.0 | 2.5 | 1340 | $1,600 | $1.19 | 44d | 1 | 0.52mi |
| 2625 W Marina Dr Unit 4 Moses Lake, WA | 2.0 | 2.5 | 1300 | $1,500 | $1.15 | 44d | 1 | 0.53mi |
| 2625 W Marina Dr Unit 5 Moses Lake, WA | 3.0 | 2.5 | 1300 | $1,795 | $1.38 | 44d | 1 | 0.53mi |
| 2625 W Marina Dr Unit 3 Moses Lake, WA | 2.0 | 2.5 | 1350 | $1,700 | $1.26 | 44d | 1 | 0.53mi |
| 470 Laguna Dr Moses Lake, WA | 3.0 | 2.5 | 1480 | $1,949 | $1.32 | 44d | 1 | 0.93mi |
| 1830 W Crouse St #1 Moses Lake, WA | 2.0 | 1.0 | 946 | $1,295 | $1.37 | 44d | 1 | 1.11mi |
| 1701 W Crouse St Moses Lake, WA | 1.0–3.0 | 1.0–2.0 | 1017 | $1,650 | $1.62 | 44d | 6 | 1.23mi |
| 1709 W Fern Dr Apt C Moses Lake, WA | 2.0 | 1.5 | 1390 | $1,300 | $0.94 | 44d | 1 | 1.27mi |
| Pheasant St Moses Lake, WA | 2.0 | 1.0 | 850 | $1,450 | $1.71 | 44d | 1 | 1.33mi |
Listing history 18 events
-
2026-06-19days on market $71,000 Active 35 DOM
-
2026-06-18days on market $71,000 Active 34 DOM
-
2026-06-17days on market $71,000 Active 33 DOM
-
2026-06-16days on market $71,000 Active 32 DOM
-
2026-06-15days on market $71,000 Active 31 DOM
-
2026-06-14days on market $71,000 Active 29 DOM
-
2026-06-13days on market $71,000 Active 28 DOM
-
2026-06-10days on market $71,000 Active 26 DOM
-
2026-06-09days on market $71,000 Active 25 DOM
-
2026-06-08days on market $71,000 Active 24 DOM
-
2026-06-07days on market $71,000 Active 23 DOM
-
2026-06-05days on market $71,000 Active 20 DOM
-
2026-06-03days on market $71,000 Active 19 DOM
-
2026-06-02days on market $71,000 Active 18 DOM
-
2026-06-01days on market $71,000 Active 17 DOM
-
2026-05-31days on market $71,000 Active 16 DOM
-
2026-05-30days on market $71,000 Active 15 DOM
-
2026-05-15$71,000 Active
ⓘ Source: listings_history table (triggers on properties + properties_extension) + one-shot
backfill from property_details.listing_events for pre-trigger history.
Tax reassessment forecast WA · Resets to sale price
- Current annual tax
- $186 · $15/mo
- Projected year-2 tax
- $696 · $58/mo
- Expected delta
- +$510/yr (+$43/mo · 274.9%)
ⓘ Screening estimate from a state-policy table — verify with the county assessor before closing.
Climate risk First Street
- Flood 1/10 Low FEMA zone X (unshaded) · 0% chance over 30 yrs
- Wildfire 1/10 Low
- Heat 4/10 Moderate 7 d/yr ≥97°F today · 15 d/yr by 30 yrs out
- Wind 1/10 Low
- Air quality 7/10 Severe 12 unhealthy d/yr today · 14 by 30 yrs out
Nearby sold comps map
Loading sold comps map…
Walkable amenities ~0.75 mi
Loading nearby amenities…
Taxation est. · year 1
- Rental income
- $19,357
- − Mortgage interest
- −$3,977
- − Property taxes
- −$186
- − Insurance
- −$355
- − Repairs & maintenance
- −$1,549
- − Management
- −$1,549
- − Depreciation
- −$2,065
- Taxable income
- $9,677
- Est. tax owed @ 24.0%
- −$2,322
- After-tax cash flow
- $7,961/yr
For passive investors: Depreciation is non-cash, so a rental often shows a tax loss while cash-flowing — sheltering income. Rental losses are passive: they offset passive income freely, and up to $25,000/yr can offset ordinary (W-2) income if you actively participate and your MAGI is under $100k (phasing out to $0 by $150k); unused losses carry forward. On sale, claimed depreciation is recaptured at up to 25%, and gains may owe capital-gains tax (a 1031 exchange can defer both). Figures are a year-1 estimate at your 24.0% rate — not tax advice; consult a CPA.
Schools (NCES district)
- District
- Moses Lake School District
- NCES district ID
- 5305220
- Math proficiency
- 38% ▬ 0.00%
- Reading proficiency
- 48% ▼ -1.00%
- Median HH income
- $49,033
- Composite
- 39.17/100
- National rank
- #8232
- State rank
- #198 of 291 in WA
Livability — Moses Lake
- Score
- 75/100
- State rank
- #170
- US rank
- #4228
Category grades
Schools grade is shown separately in the Schools card above.
Census & demographics
- Census place
- Moses Lake, WA
- County
- Grant County · 61,643 people
- City population
- 49,455
- Metro
- Moses Lake, WA
- Population (ZIP)
- 49,455
- Household income
- $74,586
- Rent vs Own
- Severe rent burden
- 1064.0
Population outlook (Grant County) Hauer SSP2
- Today (2025)
- 99,356 people
- By 2030
- 102,107 · +2.8%
- By 2040
- 108,318 · +9.0%
- By 2050
- 114,712 · +15.5%
- By 2075
- 131,376 · +32.2%
- By 2100
- 146,163 · +47.1%
Race, ethnicity, and origin ACS 2023
- Neighborhood character
- Diverse neighborhood (Simpson 0.55)
- Race & ethnicity
- White 58% Hispanic / Latino 33% Two or more races 15% Black 2% Asian 1%
- Hispanic origin (detail)
- Mexican 30%
- Common ancestry
- Portuguese 3% Subsaharan African 2% Lithuanian 2%
- Foreign-born
- 10% · Canada
- Languages at home
- 76% English-only · Spanish 21% Russian/Polish/Slavic 2%
Political lean MEDSL · Grant
- 2024 margin
- Solid R (+37.5) · D 30.0% · R 67.4% · Other 2.6%
- 2008→2024 swing
- -9.9pp toward R · 2008: -27.5pp · 2024: -37.5pp
- All cycles
- 2024: R+37.5 2020: R+34.4 2016: R+37.9 2012: R+32.6 2008: R+27.5
Not yet ingested
- Civics
- —
Market trends
- HPI YoY
- ▼ -384.29%
- Current HPI
- 208.4574
- Rent YoY
- ▼ -1.72%
- Metro
- Moses Lake, WA
- State GDP YoY
- ▲ 4.65%
- F500 in state
- 22
Industry mix (Fortune 500 HQ in WA)
| Industry | F500 HQs | Revenue |
|---|---|---|
| Retail | 2 | $269B |
|
||
| Technology / Retail | 1 | $638B |
|
||
| Technology | 1 | $245B |
|
||
| Telecommunications | 1 | $38B |
|
||
| Food / Beverage | 1 | $36B |
|
||
| Automotive / Trucks | 1 | $34B |
|
||
Price history
1 event — show timeline
- 2026-05-15 Listed $71,000 NWMLS as Distributed by MLS Grid
Property tax history
-2.3%/yrLatest (2026): $186 · +0.0% YoY. Source: county tax records.
Cash-flow waterfall
monthlySold comps — $/sqft
last 12 mo · ≤1 miLoading sold comps…