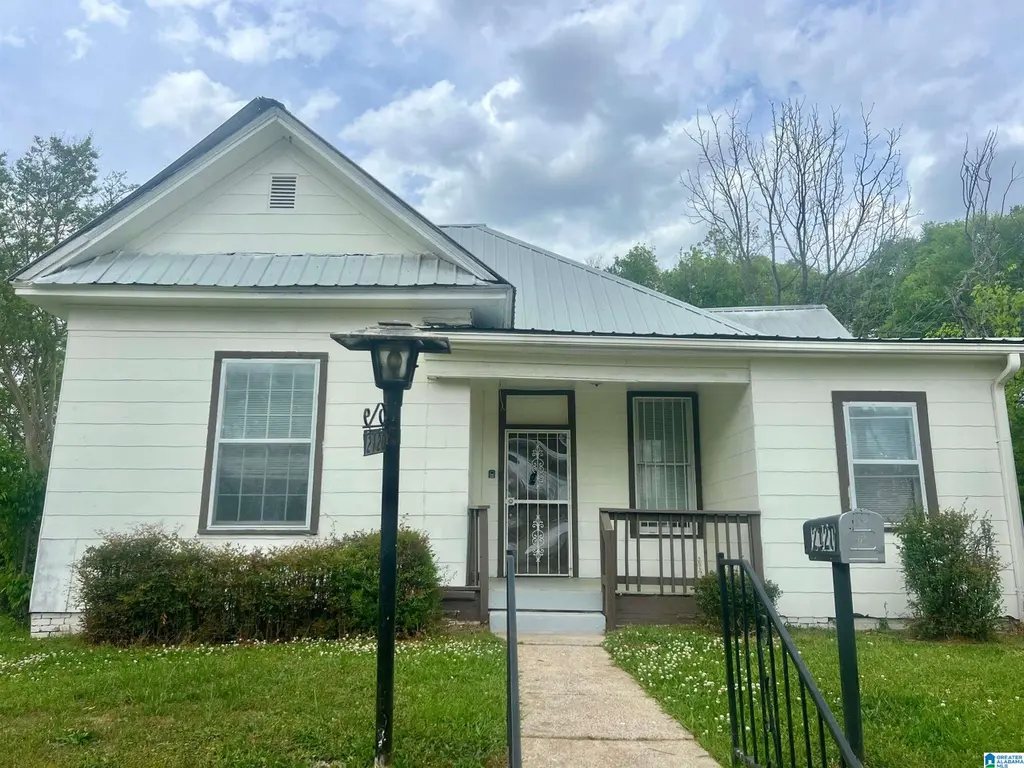
2120 47th Pl · Birmingham, AL
Flood risk 1/10 · Minimal
- FEMA flood zone
- X (unshaded)
- Chance of flooding over 30 yrs
- 0.0%
- Est. flood insurance / yr
- $473 – $860
Fire risk 1/10 · Minimal
- Est. fire insurance / yr
- $916 – $1,700
Heat risk 6/10 · Moderate
- Hot days now (above 106°F)
- 7 days/yr
- Hot days in 30 yrs
- 18 days/yr
Wind risk 6/10 · Moderate
- Chance of severe wind over 30 yrs
- 27.0%
Air-quality risk 4/10 · Minor
- Unhealthy air days now
- 5 days/yr
- Unhealthy air days in 30 yrs
- 5 days/yr
Risk factors via First Street. Map © Google.
Why this score? — see what drove the C grade
The composite is a weighted blend of 9 inputs, each scored 0–100. Each bar is that input's sub-score; the figure is the points it added to the 100-point composite (weight × sub-score).
- Cash flow +28.7/30.0
- DSCR +10.0/10.0
- 1% rule +7.7/10.0
- Rent growth +4.3/5.0
- Livability +3.4/5.0
- Condition / age +2.5/5.0
- Schools +0.9/10.0
- ARV discount +0.0/15.0
- Appreciation +0.0/10.0
$87,500
🖨 Deal sheet 📄 Offer letter ✓ Due diligence
Listing remarks MLS
Tenant occupied. No showings until under contract. Offered as part of a 6-home single-family rental portfolio, this is a strong opportunity to add scale with renovated, income-producing assets.
Key facts
- 7,405 sq ft lot
- Garage
- Built 1925
Neighborhood map
What this means for you Summary
Snapshot
- This is a 2-bed/1.0-bath single-family listed at $88k.
Deal economics
- At list price, monthly cash flow is $290 ($3k/yr) — positive.
- The deal already cash-flows at list — no discount required.
- Meets the 1% rule at list price ($1k rent vs $88k).
- Recommended offer: $85k (3.0% below list) — sets the bar for market timing.
- Cap rate 10.3% vs local median 6.2% in Birmingham — top-decile yield for the area; either an underpriced asset or a hidden risk that comps aren't pricing in. Stress-test before assuming the spread holds.
Location & tenants
- Location reads 67/100 on livability (#78 in AL) — a middle-class / working-renter tenant base. Strengths: commute A+, cost of living A+, housing A+; Watch: amenities C-, schools F, crime F.
- Birmingham City (urban): math 4% / reading 20% proficiency, ranked #116 of 129 in AL (top 90%) — low school quality limits family demand, transient renter base, plan for 1-2y turnover; 82% free/reduced lunch — lower-income household profile, screen leases tightly.
- Market conditions: Rents rising fast (+7.2%/yr); 122 active listings in the ZIP; 40 comparable units currently listed for rent nearby; rentals at typical pace (median 24d on market — plan ~3-4 weeks tenant-placement turnaround); 45% of comp listings sitting > 30 days — soft ceiling on asking rent; lower-income renter base — watch delinquency; 2,114 units permitted in Jefferson County in 2024 (556 in 5+ unit buildings).
- This rent runs 35% of the median local income ($39k/yr) — at the standard rent-burdened threshold; future hikes will face affordability resistance.
Forward outlook
- Local home prices are declining (-3.0%/yr); year-one equity from $605 of loan paydown is wiped out by about $3k of value loss. Plan a longer hold.
- Jefferson County population projected to shrink 4% by 2050 — rents likely to lag national; underwrite the cash flow, not the appreciation.
- At projected returns (-3.0% appreciation + 7.2% rent growth), your $24k cash investment doubles in ~7 years — after that, you're playing with house money.
Negotiation context
- It's been on market 51 days — a 3% lower offer ($85k) is reasonable based on typical stale-listing flexibility.
- 4 sale attempts; this cycle's ask is 7692% above the opening price — seller raised mid-cycle; expect resistance to lowballs.
Risks & watch-outs
- Watch-outs: built in 1925 — expect roof / HVAC / electrical / plumbing capex.
- Climate carrying-cost: major wind risk, 27% chance of damaging wind over 30y; extreme-heat days projected 7→18/yr by 2055 (HVAC capex compounding) — expect insurance premiums to compound above CPI over the hold.
Questions for the listing agent
- It's been on market 51 days. Have you received any prior offers? Is the seller open to a 3% concession, seller financing, or rate buy-down credit?
- Built in 1925 — when were the roof, HVAC, electrical panel, plumbing, and water heater last replaced?
- Is there a deadline driving the sale (1031 exchange, divorce, estate, relocation)? That informs how much negotiation room exists.
- Schools are F-rated, which usually means shorter tenancies and higher turnover. Who's the typical renter profile here, and what's been the actual vacancy rate?
- Crime grade is F in this area — have there been break-ins, vandalism, or insurance claims at this property in the last 3 years? What carrier currently insures it and at what premium?
- What's the average days-on-market for RENTAL listings here right now (not sales)? A rising rental-DOM trend means longer vacancies and softer asking-rent achievability than the comps imply.
- What's the recent tenant-quality profile in this submarket — average credit score on applications, eviction rate, late-payment / NSF rate, and stable-employment percentage? A property-management company in the area should have these aggregated.
- How much new for-sale + rental construction is in the pipeline within 1–3 miles? Heavy new supply typically softens prices + rents 12–24 months out; constrained supply supports both.
Investment metrics
- 1% rule
- 1.27% ✓
- Cap rate
- 10.27%
- Cash-on-cash
- 14.21%
- DSCR
- 1.63
- GRM
- 6.5
CMA / ARV
- ARV (median comp)
- $67,613
- List price
- $87,500
- Delta
- 29.41%
- Verdict
- OVERPRICED
- Comps
- 20 within 1.0 mi
Show comp detail 12 sales within ~0.75 mi
| Address | Dist | Beds/Ba | Sqft | Sold | Price | $/sf | Match |
|---|---|---|---|---|---|---|---|
| 4637 Avenue R | 0.53mi | 2/1.0 | 1,378 (-4%) | 3mo | $28,500 | $21 | 66 |
| 4728 Terrace | 0.20mi | 3/2.0 (+1) | 1,276 (-11%) | 4mo | $29,900 | $23 | 59 |
| 2436 29th St W | 0.65mi | 3/1.0 (+1) | 1,398 (-3%) | 2mo | $98,100 | $70 | 59 |
| 1825 49th St | 0.50mi | 3/1.0 (+1) | 1,532 (+6%) | 4mo | $51,000 | $33 | 57 |
| 1607 43rd St | 0.65mi | 3/2.0 (+1) | 1,435 (-0%) | 5mo | $85,000 | $59 | 56 |
| 4829 Avenue | 0.34mi | 3/1.0 (+1) | 1,247 (-13%) | 5mo | $50,000 | $40 | 53 |
| 1836 Bessemer Rd | 0.46mi | 3/1.0 (+1) | 1,258 (-13%) | 4mo | $55,000 | $44 | 49 |
| 3300 Avenue Q | 0.61mi | 2/1.0 | 1,227 (-15%) | 0mo | $35,000 | $29 | 46 |
| 213 SW 22nd St | 0.53mi | 3/1.0 (+1) | 1,260 (-12%) | 8mo | $110,000 | $87 | 43 |
| 1601 48th St | 0.74mi | 3/1.0 (+1) | 1,313 (-9%) | 7mo | $84,900 | $65 | 40 |
| 201 21st St SW | 0.51mi | 3/2.0 (+1) | 1,258 (-13%) | 8mo | $30,000 | $24 | 40 |
| 1113 51st St | 0.70mi | 3/2.0 (+1) | 1,231 (-14%) | 3mo | $204,900 | $166 | 32 |
Match score weights: distance 35% · size 25% · config 20% · recency 20%. Top-matched comps best support the ARV.
Projected returns pro-forma
-3.0% appreciation · 7.24% rent growth · sell at horizon
- IRR
- 9.2%
- Equity multiple
- 1.38×
- Total profit
- $9,262
- Equity at exit
- $13,047
- IRR
- 21.6%
- Equity multiple
- 3.21×
- Total profit
- $54,098
- Equity at exit
- $7,565
Cash invested: $24,500 (down + closing). Projections, not guarantees.
Landlord ↔ Tenant lean methodology
- Overall (STATE)
- 90 Strongly Landlord-Friendly
- State Alabama
- 90 Strongly Landlord-Friendly · R+15
- County
- — inherits STATE
- City
- — inherits STATE
ZIP-level market 35208
- Home prices YoY
- -18.1%
- Rents YoY
- 7.2%
- Active inventory
- 122
- Price-to-rent
- 6.5×
Monthly cashflow live
- Estimated rent
- $1,115 high interval (Pro) →
- Mortgage (P&I)
- −$459
- Tax from tax record
- −$95 /mo · $1,144/yr
- Insurance
- −$36
- HOA
- −$0
- Vacancy / Maint / Mgmt
- −$234
- Net cashflow
- $290
Break-even live
UW: 25.0% down · 7.5% · 30yr · 1.5% tax · 5.0% vac · 8.0% maint · 8.0% mgmt
Financing live
Cash to close
- Down payment
- $21,875
- Closing costs
- $2,625
- Reserves months
- —
- Total cash needed
- —
Loan-product check · same deal, 3 products live
Conventional
25% down · 7.5% · 30yr
- Down + closing
- —
- Monthly P&I
- —
- Monthly cashflow
- —
- DSCR
- —
- Eligible?
- —
Personal DTI + credit; lowest rate.
DSCR
20% down · 8.5% · 30yr
- Down + closing
- —
- Monthly P&I
- —
- Monthly cashflow
- —
- DSCR
- —
- Eligible?
- —
No personal income docs; deal must DSCR.
Hard money
10% down · 12.0% · 12mo
- Down + closing
- —
- Monthly P&I
- —
- Monthly cashflow
- —
- DSCR
- —
- Eligible?
- —
Short-term bridge; refi at stabilization.
Rent comps 40 comps
| Address | Beds | Baths | Sqft | Rent | $/sqft | DOM | Units | Dist |
|---|---|---|---|---|---|---|---|---|
| 2133 47th Street Ensley Unit ENSLEY Birmingham, AL | 3.0 | 1.5 | 1308 | $1,300 | $0.99 | 43d | 1 | 0.05mi |
| 2017 48th Street Ensley Birmingham, AL | 3.0 | 2.0 | 1383 | $1,250 | $0.90 | 43d | 1 | 0.10mi |
| 4813 Court S Birmingham, AL | 3.0 | 2.0 | 1118 | $1,125 | $1.01 | 43d | 1 | 0.25mi |
| 4612 Terrace S Birmingham, AL | 3.0 | 1.0 | 1612 | $1,050 | $0.65 | 43d | 1 | 0.25mi |
| 4637 Court S Birmingham, AL | 3.0 | 1.0 | 1225 | $975 | $0.80 | 1d | 1 | 0.26mi |
| 4732 Court S Birmingham, AL | 3.0 | 1.0 | 1372 | $1,100 | $0.80 | 43d | 1 | 0.26mi |
| 4736 Court S Birmingham, AL | 3.0 | 1.5 | 1300 | $1,200 | $0.92 | 3d | 1 | 0.27mi |
| 4801 Avenue S Birmingham, AL | 3.0 | 1.0 | 1310 | $1,000 | $0.76 | 43d | 1 | 0.31mi |
| 4825 Avenue S Birmingham, AL | 3.0 | 1.0 | 1310 | $1,050 | $0.80 | 15d | 1 | 0.33mi |
| 1933 Saint Charles Ct SW Birmingham, AL | 3.0 | 1.0 | 1106 | $1,050 | $0.95 | 23d | 1 | 0.39mi |
| 3221 Avenue S Birmingham, AL | 3.0 | 2.0 | 1190 | $1,250 | $1.05 | 23d | 1 | 0.41mi |
| 3009 Prince Ave Birmingham, AL | 3.0 | 2.0 | 1176 | $1,095 | $0.93 | 23d | 1 | 0.43mi |
| 4817 Court R Birmingham, AL | 3.0 | 2.0 | 1530 | $1,300 | $0.85 | 15d | 1 | 0.46mi |
| 4724 Court R Birmingham, AL | 2.0 | 1.0 | 1016 | $895 | $0.88 | 14d | 1 | 0.48mi |
| 3017 Ensley Ave Birmingham, AL | 3.0 | 1.0 | 1540 | $1,400 | $0.91 | 1d | 1 | 0.49mi |
| 208 22nd St SW Birmingham, AL | 2.0 | 1.0 | 926 | $1,050 | $1.13 | 3d | 1 | 0.50mi |
| 2028 Lee Ter SW Birmingham, AL | 2.0 | 1.0 | 884 | $695 | $0.79 | 43d | 1 | 0.53mi |
| 2329 30th Street Ensley Birmingham, AL | 2.0 | 1.0 | 917 | $990 | $1.08 | 23d | 1 | 0.53mi |
| 4105 Avenue Q Unit Q Birmingham, AL | 3.0 | 3.0 | 1760 | $1,250 | $0.71 | 3d | 1 | 0.53mi |
| 4929 Avenue R Unit R Birmingham, AL | 2.0 | 1.0 | 962 | $950 | $0.99 | 43d | 1 | 0.58mi |
| 2026 Lee Ct SW Birmingham, AL | 3.0 | 1.0 | 1204 | $1,100 | $0.91 | 43d | 1 | 0.59mi |
| 4619 Terrace Q Birmingham, AL | 3.0 | 2.0 | 1198 | $900 | $0.75 | 43d | 1 | 0.60mi |
| 2421 29th Street Ensley Unit C Birmingham, AL | 2.0 | 1.0 | 950 | $703 | $0.74 | 23d | 1 | 0.61mi |
| 2216 Lee Ave SW Birmingham, AL | 3.0 | 1.0 | 902 | $900 | $1.00 | 23d | 1 | 0.62mi |
| 1617 42nd Street Ensley Unit ENSLEY Birmingham, AL | 3.0 | 1.0 | 1413 | $1,030 | $0.73 | 15d | 1 | 0.63mi |
| 2519 Saint Charles Ave SW Birmingham, AL | 2.0 | 1.0 | 990 | $975 | $0.98 | 44d | 1 | 0.64mi |
| 1607 43rd Street Ensley Unit ENSLEY Birmingham, AL | 3.0 | 2.0 | 1435 | $1,150 | $0.80 | 23d | 1 | 0.66mi |
| 1604 44th Street Ensley Unit ENSLEY Birmingham, AL | 3.0 | 1.0 | 1100 | $1,200 | $1.09 | 23d | 1 | 0.68mi |
| 1816 Saint Charles Ave SW Birmingham, AL | 3.0 | 1.0 | 1395 | $1,295 | $0.93 | 23d | 1 | 0.70mi |
| 1540 42nd Street Ensley Unit ENSLEY Birmingham, AL | 2.0 | 1.0 | 899 | $1,037 | $1.15 | 43d | 1 | 0.70mi |
| 1781 51st Street Ensley Unit ENSLEY Birmingham, AL | 3.0 | 1.5 | 1069 | $950 | $0.89 | 43d | 1 | 0.73mi |
| 1520 41st Street Ensley Birmingham, AL | 3.0 | 2.0 | 1068 | $1,195 | $1.12 | 43d | 1 | 0.75mi |
| 2037 26th Street Ensley Birmingham, AL | 3.0 | 1.0 | 1074 | $995 | $0.93 | 43d | 1 | 0.75mi |
| 1528 34th Street Ensley Birmingham, AL | 3.0 | 2.0 | 972 | $1,073 | $1.10 | 43d | 1 | 0.75mi |
| 1606 49th Street Ensley Unit ENSLEY Birmingham, AL | 3.0 | 2.0 | 1136 | $1,100 | $0.97 | 43d | 1 | 0.76mi |
| 504 Francis Pl SW Birmingham, AL | 3.0 | 2.0 | 1816 | $1,223 | $0.67 | 23d | 1 | 0.77mi |
| 407 S Park Rd SW Birmingham, AL | 3.0 | 1.0 | 1050 | $900 | $0.86 | 43d | 1 | 0.79mi |
| 1509 44th Street Ensley Unit ENSLEY Birmingham, AL | 3.0 | 1.5 | 1260 | $1,123 | $0.89 | 11d | 1 | 0.80mi |
| 1556 Burgin Ave Birmingham, AL | 3.0 | 1.0 | 1168 | $1,100 | $0.94 | 21d | 1 | 0.81mi |
| 1515 45th Street Ensley Unit ENSLEY Birmingham, AL | 3.0 | 1.0 | 1440 | $875 | $0.61 | 3d | 1 | 0.81mi |
Listing history 15 events
-
2026-04-23historical $1,123
-
2026-04-08status Active 193-char remark
Show marketing remark (193 chars)
Tenant occupied. No showings until under contract. Offered as part of a 6-home single-family rental portfolio, this is a strong opportunity to add scale with renovated, income-producing assets.
-
2026-03-28$1,123
-
2026-03-16historical 193-char remark
Show marketing remark (193 chars)
Tenant occupied. No showings until under contract. Offered as part of a 6-home single-family rental portfolio, this is a strong opportunity to add scale with renovated, income-producing assets.
-
2026-03-13$87,500 Active 193-char remark
Show marketing remark (193 chars)
Tenant occupied. No showings until under contract. Offered as part of a 6-home single-family rental portfolio, this is a strong opportunity to add scale with renovated, income-producing assets.
-
2025-05-27soldstatus $80,000
-
2025-05-26soldstatus $80,000 Sold 747-char remark
Show marketing remark (747 chars)
Calling all Investors! Welcome to 2120 47th Place W, Birmingham, AL 35208—a beautifully maintained 3-bed, 1-bath home blending classic charm with modern convenience. This home features 1,439 sq. ft. of inviting living space, including hardwood floors, a cozy fireplace, and large windows that fill the rooms with natural light. The spacious kitchen offers ample cabinetry, while the formal dining room is perfect for gatherings. Additional highlights include forced air heating, central cooling, and an attached garage. Located in a quiet neighborhood with convenient access to shopping, dining, and major highways, this home is a must-see! Don’t miss this opportunity, income producing property, Section 8 Tenant - Rent $1050 a month.
-
2025-05-16historical Contingent 747-char remark
Show marketing remark (747 chars)
Calling all Investors! Welcome to 2120 47th Place W, Birmingham, AL 35208—a beautifully maintained 3-bed, 1-bath home blending classic charm with modern convenience. This home features 1,439 sq. ft. of inviting living space, including hardwood floors, a cozy fireplace, and large windows that fill the rooms with natural light. The spacious kitchen offers ample cabinetry, while the formal dining room is perfect for gatherings. Additional highlights include forced air heating, central cooling, and an attached garage. Located in a quiet neighborhood with convenient access to shopping, dining, and major highways, this home is a must-see! Don’t miss this opportunity, income producing property, Section 8 Tenant - Rent $1050 a month.
-
2025-04-17price $95,000 747-char remark
Show marketing remark (747 chars)
Calling all Investors! Welcome to 2120 47th Place W, Birmingham, AL 35208—a beautifully maintained 3-bed, 1-bath home blending classic charm with modern convenience. This home features 1,439 sq. ft. of inviting living space, including hardwood floors, a cozy fireplace, and large windows that fill the rooms with natural light. The spacious kitchen offers ample cabinetry, while the formal dining room is perfect for gatherings. Additional highlights include forced air heating, central cooling, and an attached garage. Located in a quiet neighborhood with convenient access to shopping, dining, and major highways, this home is a must-see! Don’t miss this opportunity, income producing property, Section 8 Tenant - Rent $1050 a month.
-
2025-03-03price $110,000 747-char remark
Show marketing remark (747 chars)
Calling all Investors! Welcome to 2120 47th Place W, Birmingham, AL 35208—a beautifully maintained 3-bed, 1-bath home blending classic charm with modern convenience. This home features 1,439 sq. ft. of inviting living space, including hardwood floors, a cozy fireplace, and large windows that fill the rooms with natural light. The spacious kitchen offers ample cabinetry, while the formal dining room is perfect for gatherings. Additional highlights include forced air heating, central cooling, and an attached garage. Located in a quiet neighborhood with convenient access to shopping, dining, and major highways, this home is a must-see! Don’t miss this opportunity, income producing property, Section 8 Tenant - Rent $1050 a month.
-
2025-02-01$115,000 Active 747-char remark
Show marketing remark (747 chars)
Calling all Investors! Welcome to 2120 47th Place W, Birmingham, AL 35208—a beautifully maintained 3-bed, 1-bath home blending classic charm with modern convenience. This home features 1,439 sq. ft. of inviting living space, including hardwood floors, a cozy fireplace, and large windows that fill the rooms with natural light. The spacious kitchen offers ample cabinetry, while the formal dining room is perfect for gatherings. Additional highlights include forced air heating, central cooling, and an attached garage. Located in a quiet neighborhood with convenient access to shopping, dining, and major highways, this home is a must-see! Don’t miss this opportunity, income producing property, Section 8 Tenant - Rent $1050 a month.
-
2024-07-15soldstatus $79,000
-
2022-08-02soldstatus $105,000
-
2022-04-12soldstatus $61,500
-
2017-09-29soldstatus $10,500
ⓘ Source: listings_history table (triggers on properties + properties_extension) + one-shot
backfill from property_details.listing_events for pre-trigger history.
Tax reassessment forecast AL · Resets to sale price
- Current annual tax
- $1,144 · $95/mo
- Projected year-2 tax
- $1,144 · $95/mo
- Expected delta
- $0/yr ($0/mo · 0.0%)
ⓘ Screening estimate from a state-policy table — verify with the county assessor before closing.
Climate risk First Street
- Flood 1/10 Low FEMA zone X (unshaded) · 0% chance over 30 yrs
- Wildfire 1/10 Low
- Heat 6/10 Major 7 d/yr ≥106°F today · 18 d/yr by 30 yrs out
- Wind 6/10 Major 27% chance of damaging wind over 30 yrs
- Air quality 4/10 Moderate 5 unhealthy d/yr today · 5 by 30 yrs out
Nearby sold comps map
Loading sold comps map…
Walkable amenities ~0.75 mi
Loading nearby amenities…
Taxation est. · year 1
- Rental income
- $13,378
- − Mortgage interest
- −$4,901
- − Property taxes
- −$1,144
- − Insurance
- −$438
- − Repairs & maintenance
- −$1,070
- − Management
- −$1,070
- − Depreciation
- −$2,545
- Taxable income
- $2,209
- Est. tax owed @ 24.0%
- −$530
- After-tax cash flow
- $2,951/yr
For passive investors: Depreciation is non-cash, so a rental often shows a tax loss while cash-flowing — sheltering income. Rental losses are passive: they offset passive income freely, and up to $25,000/yr can offset ordinary (W-2) income if you actively participate and your MAGI is under $100k (phasing out to $0 by $150k); unused losses carry forward. On sale, claimed depreciation is recaptured at up to 25%, and gains may owe capital-gains tax (a 1031 exchange can defer both). Figures are a year-1 estimate at your 24.0% rate — not tax advice; consult a CPA.
Schools (NCES district)
- District
- Birmingham City
- NCES district ID
- 0100390
- Math proficiency
- 4% ▼ -17.00%
- Reading proficiency
- 20% ▼ -4.00%
- Median HH income
- $31,988
- Composite
- 9.49/100
- National rank
- #9850
- State rank
- #116 of 129 in AL
Livability — Birmingham
- Score
- 67/100
- State rank
- #78
- US rank
- #10412
Category grades
Schools grade is shown separately in the Schools card above.
Census & demographics
- Census place
- Birmingham, AL
- County
- Jefferson County · 527,445 people
- City population
- 210,422
- Metro
- Birmingham-Hoover, AL
- Population (ZIP)
- 13,412
- Household income
- $38,561
- Rent vs Own
- Severe rent burden
- 573.0
Population outlook (Jefferson County) Hauer SSP2
- Today (2025)
- 669,185 people
- By 2030
- 669,694 · +0.1%
- By 2040
- 661,388 · -1.2%
- By 2050
- 643,086 · -3.9%
- By 2075
- 577,267 · -13.7%
- By 2100
- 474,758 · -29.1%
Race, ethnicity, and origin ACS 2023
- Neighborhood character
- Predominantly Black (94%)
- Race & ethnicity
- Black 94% White 4% Hispanic / Latino 2% Two or more races 1%
- Foreign-born
- 3% · Canada
- Languages at home
- 96% English-only · Spanish 2%
Political lean MEDSL · Jefferson
- 2024 margin
- D (+10.4) · D 54.6% · R 44.2% · Other 1.2%
- 2008→2024 swing
- +5.4pp toward D · 2008: 5.1pp · 2024: 10.4pp
- All cycles
- 2024: D+10.4 2020: D+13.2 2016: D+7.2 2012: D+6.0 2008: D+5.1
Not yet ingested
- Civics
- —
Market trends
- HPI YoY
- ▼ -33.99%
- Current HPI
- 153.414
- Rent YoY
- ▲ 7.24%
- Metro
- Birmingham-Hoover, AL
- State GDP YoY
- ▲ 2.94%
- F500 in state
- 4
Industry mix (Fortune 500 HQ in AL)
| Industry | F500 HQs | Revenue |
|---|---|---|
| Financial Services | 1 | $8B |
|
||
| Healthcare | 1 | $5B |
|
||
Price history
-89.3% since first listed15 events — show timeline
- 2026-04-23 Rental Removed $1,123 RENTLY
- 2026-04-08 Relisted — Greater Alabama MLS
- 2026-03-28 Listed for Rent $1,123 RENTLY
- 2026-03-16 Delisted — Greater Alabama MLS
- 2026-03-13 Listed $87,500 Greater Alabama MLS
- 2025-05-27 Sold (Public Records) $80,000 Public Records
- 2025-05-26 Sold (MLS) $80,000 Greater Alabama MLS
- 2025-05-16 Contingent — Greater Alabama MLS
- 2025-04-17 Price Changed $95,000 Greater Alabama MLS
- 2025-03-03 Price Changed $110,000 Greater Alabama MLS
- 2025-02-01 Listed $115,000 Greater Alabama MLS
- 2024-07-15 Sold (Public Records) $79,000 Public Records
- 2022-08-02 Sold (Public Records) $105,000 Public Records
- 2022-04-12 Sold (Public Records) $61,500 Public Records
- 2017-09-29 Sold (Public Records) $10,500 Public Records
Property tax history
+3.8%/yrLatest (2025): $1,144 · +0.0% YoY. Source: county tax records.
Cash-flow waterfall
monthlySold comps — $/sqft
last 12 mo · ≤1 miLoading sold comps…