 🏷️ Likely Rental
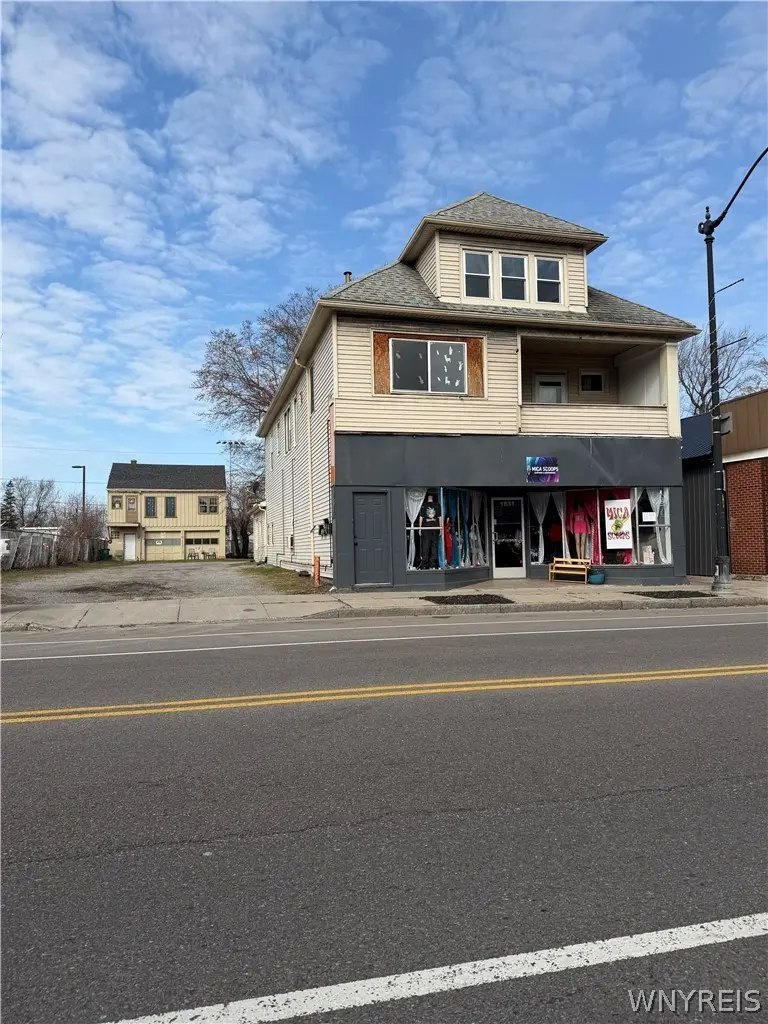
1831 S Park Ave · Buffalo, NY
Flood risk No data
- FEMA flood zone
- —
- Chance of flooding over 30 yrs
- —
- Est. flood insurance / yr
- —
Fire risk No data
- Est. fire insurance / yr
- —
Heat risk No data
- Hot days now (above threshold)
- —
- Hot days in 30 yrs
- —
Wind risk No data
- Chance of severe wind over 30 yrs
- —
Air-quality risk No data
- Unhealthy air days now
- —
- Unhealthy air days in 30 yrs
- —
Risk factors via First Street. Map © Google.
Why this score? — see what drove the B+ grade
The composite is a weighted blend of 9 inputs, each scored 0–100. Each bar is that input's sub-score; the figure is the points it added to the 100-point composite (weight × sub-score).
- Cash flow +30.0/30.0
- ARV discount +15.0/15.0
- 1% rule +10.0/10.0
- DSCR +10.0/10.0
- Rent growth +4.4/5.0
- Livability +3.9/5.0
- Schools +3.3/10.0
- Condition / age +2.0/5.0
- Appreciation +0.0/10.0
$250,000
🖨 Deal sheet 📄 Offer letter ✓ Due diligence
Multi-family units
County records classify this as Multi-Family (2-4 Unit). Listing-text estimate: 4 units. confirmed
Listing remarks MLS
Endless opportunity with this 4-unit property in the heart of South Buffalo! This value-add asset is primed for stabilization and offers strong upside potential for the right investor. The vacant three residential units consist of two spacious 2-bedroom units with market rents projected at $1,200/month each. One studio unit with a walk-out porch, which has an estimated rent of $950/month. A storefront with an existing tenant currently on a month-to-month lease who is open to signing a longer-term agreement. This brings the total stabilized rent to $4350 per month and $52,200 per year. Recent updates include newer windows, updated electrical service, a new furnace for the commercial space, and hardwood floors throughout much of the property. This is a great Brrrr opportunity for an investor looking for cash flow on the appreciating rents in South Buffalo. The carriage house next door is also available for a package deal.
Key facts
- 6,650 sq ft lot
- Built 1900
- Listed 77 days
Neighborhood map
What this means for you Summary
Snapshot
- This is a 2×2bd/1.0ba + 1×1bd/1.0ba + 1×4bd/1.0ba units multifamily listed at $250k. Condition is rated fair.
Deal economics
- At list price, monthly cash flow is $2k ($29k/yr) — positive. Per door: $612/mo.
- The deal already cash-flows at list — no discount required.
- Meets the 1% rule at list price ($5k rent vs $250k).
- Recommended offer: $235k (6.0% below list) — sets the bar for market timing.
- Cap rate 18.0% vs local median 8.0% in Buffalo — top-decile yield for the area; either an underpriced asset or a hidden risk that comps aren't pricing in. Stress-test before assuming the spread holds.
Location & tenants
- Location reads 77/100 on livability (#195 in NY, #3,011 nationally) — a middle-class / working-renter tenant base. Strengths: commute A+, housing A+, health & safety A+; Watch: crime F, employment D-.
- Buffalo City School District (urban): math 41% / reading 40% proficiency, ranked #535 of 590 in NY (top 91%) — families likely to look elsewhere, expect single-tenant / working-renter base with shorter leases; 75% free/reduced lunch — lower-income household profile, screen leases tightly.
- Market conditions: Rents rising fast (+7.6%/yr); 136 active listings in the ZIP; 1,244 units permitted in Erie County in 2024 (563 in 5+ unit buildings).
- At $5,285/mo this rent would consume 89% of the median local household income ($71k/yr) (locally 602% of renters already pay >50% of income on rent) — very limited rent-growth headroom before tenants either downsize or default.
Forward outlook
- Local home prices are declining (-3.0%/yr); year-one equity from $2k of loan paydown is wiped out by about $8k of value loss. Plan a longer hold.
- At projected returns (-3.0% appreciation + 7.6% rent growth), your $70k cash investment doubles in ~3 years — after that, you're playing with house money.
Negotiation context
- It's been on market 77 days — a 6% lower offer ($235k) is reasonable based on typical stale-listing flexibility.
Risks & watch-outs
- Watch-outs: built in 1900 — expect roof / HVAC / electrical / plumbing capex.
Questions for the listing agent
- It's been on market 77 days. Have you received any prior offers? Is the seller open to a 6% concession, seller financing, or rate buy-down credit?
- Can we see the unit-by-unit rent roll, current vacancy, and any below-market leases? What's the average tenancy length?
- What capital expenditures (roof, boiler, parking lot, exteriors) have been made in the last 5 years, and what's planned in the next 2?
- Have any recent inspections been done? Can we get a copy of the seller's disclosures and any deferred-maintenance estimates?
- Built in 1900 — when were the roof, HVAC, electrical panel, plumbing, and water heater last replaced?
- Why hasn't it sold? Are there any deal-killer items the seller is aware of (foundation, flood, title, zoning, code violations)?
- Is there a deadline driving the sale (1031 exchange, divorce, estate, relocation)? That informs how much negotiation room exists.
- Crime grade is F in this area — have there been break-ins, vandalism, or insurance claims at this property in the last 3 years? What carrier currently insures it and at what premium?
- What's the average days-on-market for RENTAL listings here right now (not sales)? A rising rental-DOM trend means longer vacancies and softer asking-rent achievability than the comps imply.
- What's the recent tenant-quality profile in this submarket — average credit score on applications, eviction rate, late-payment / NSF rate, and stable-employment percentage? A property-management company in the area should have these aggregated.
- How much new apartment / multifamily construction is in the pipeline within 1–3 miles? Heavy new supply (>2% of stock underway) typically softens rents 12–24 months out; light construction supports rent growth.
Investment metrics
- 1% rule
- 2.11% ✓
- Cap rate
- 18.04%
- Cash-on-cash
- 41.96%
- DSCR
- 2.87
- GRM
- 3.9
CMA / ARV
- ARV (median comp)
- $426,340
- List price
- $250,000
- Delta
- -41.36%
- Verdict
- UNDERPRICED
- Comps
- 9 within 1.0 mi
Projected returns pro-forma
-3.0% appreciation · 7.62% rent growth · sell at horizon
- IRR
- 43.8%
- Equity multiple
- 3.02×
- Total profit
- $141,160
- Equity at exit
- $37,276
- IRR
- 51.9%
- Equity multiple
- 7.29×
- Total profit
- $440,050
- Equity at exit
- $21,615
Cash invested: $70,000 (down + closing). Projections, not guarantees.
Landlord ↔ Tenant lean methodology
- Overall (STATE)
- 15 Strongly Tenant-Friendly
- State New York
- 15 Strongly Tenant-Friendly · D+10
- County
- — inherits STATE
- City
- — inherits STATE
ZIP-level market 14220
- Home prices YoY
- -26.7%
- Rents YoY
- 7.6%
- Active inventory
- 136
- Price-to-rent
- 15.9×
Monthly cashflow live
- Estimated rent
- $5,285 high interval (Pro) →
- Mortgage (P&I)
- −$1,311
- Tax est. 1.5%
- −$312 /mo · $3,750/yr
- Insurance
- −$104
- HOA
- −$0
- Vacancy / Maint / Mgmt
- −$1,110
- Net cashflow
- $2,447
Break-even live
4-unit breakdown (identical units grouped — click to expand)
| Units | Beds | Baths | Est. rent |
|---|---|---|---|
| 2× units | 2 | 1 | $2,616 |
| #1 | 2 | 1 | $1,308 |
| #2 | 2 | 1 | $1,308 |
| 1× unit | 1 | 1 | $1,173 |
| 1× unit | 4 | 1 | $1,497 |
| Total (4 units) | $5,285 | ||
UW: 25.0% down · 7.5% · 30yr · 1.5% tax · 5.0% vac · 8.0% maint · 8.0% mgmt
Financing live
Cash to close
- Down payment
- $62,500
- Closing costs
- $7,500
- Reserves months
- —
- Total cash needed
- —
Loan-product check · same deal, 3 products live
Conventional
25% down · 7.5% · 30yr
- Down + closing
- —
- Monthly P&I
- —
- Monthly cashflow
- —
- DSCR
- —
- Eligible?
- —
Personal DTI + credit; lowest rate.
DSCR
20% down · 8.5% · 30yr
- Down + closing
- —
- Monthly P&I
- —
- Monthly cashflow
- —
- DSCR
- —
- Eligible?
- —
No personal income docs; deal must DSCR.
Hard money
10% down · 12.0% · 12mo
- Down + closing
- —
- Monthly P&I
- —
- Monthly cashflow
- —
- DSCR
- —
- Eligible?
- —
Short-term bridge; refi at stabilization.
Listing history 15 events
-
2026-06-18days on market $250,000 Active 77 DOM
-
2026-06-17days on market $250,000 Active 76 DOM
-
2026-06-16days on market $250,000 Active 75 DOM
-
2026-06-15days on market $250,000 Active 74 DOM
-
2026-06-13days on market $250,000 Active 72 DOM
-
2026-06-13days on market $250,000 Active 71 DOM
-
2026-06-10days on market $250,000 Active 69 DOM
-
2026-06-09days on market $250,000 Active 68 DOM
-
2026-06-08days on market $250,000 Active 67 DOM
-
2026-06-07days on market $250,000 Active 66 DOM
-
2026-06-03days on market $250,000 Active 62 DOM
-
2026-06-02days on market $250,000 Active 61 DOM
-
2026-06-01days on market $250,000 Active 60 DOM
-
2026-05-31days on market $250,000 Active 59 DOM
-
2026-04-02$250,000 Active 933-char remark
Show marketing remark (933 chars)
Endless opportunity with this 4-unit property in the heart of South Buffalo! This value-add asset is primed for stabilization and offers strong upside potential for the right investor. The vacant three residential units consist of two spacious 2-bedroom units with market rents projected at $1,200/month each. One studio unit with a walk-out porch, which has an estimated rent of $950/month. A storefront with an existing tenant currently on a month-to-month lease who is open to signing a longer-term agreement. This brings the total stabilized rent to $4350 per month and $52,200 per year. Recent updates include newer windows, updated electrical service, a new furnace for the commercial space, and hardwood floors throughout much of the property. This is a great Brrrr opportunity for an investor looking for cash flow on the appreciating rents in South Buffalo. The carriage house next door is also available for a package deal.
ⓘ Source: listings_history table (triggers on properties + properties_extension) + one-shot
backfill from property_details.listing_events for pre-trigger history.
Nearby sold comps map
Loading sold comps map…
Walkable amenities ~0.75 mi
Loading nearby amenities…
Taxation est. · year 1
- Rental income
- $63,420
- − Mortgage interest
- −$14,004
- − Property taxes
- −$3,750
- − Insurance
- −$1,250
- − Repairs & maintenance
- −$5,074
- − Management
- −$5,074
- − Depreciation
- −$7,273
- Taxable income
- $26,996
- Est. tax owed @ 24.0%
- −$6,479
- After-tax cash flow
- $22,890/yr
For passive investors: Depreciation is non-cash, so a rental often shows a tax loss while cash-flowing — sheltering income. Rental losses are passive: they offset passive income freely, and up to $25,000/yr can offset ordinary (W-2) income if you actively participate and your MAGI is under $100k (phasing out to $0 by $150k); unused losses carry forward. On sale, claimed depreciation is recaptured at up to 25%, and gains may owe capital-gains tax (a 1031 exchange can defer both). Figures are a year-1 estimate at your 24.0% rate — not tax advice; consult a CPA.
Condition & rehab AI · 1 photo
This 4-unit property in South Buffalo requires significant repairs and updates to improve its condition and value. Immediate focus should be on exterior and interior repairs to enhance its curb appeal and rental potential.
Repairs flagged
- Major exterior siding — Significant wear and tear
- Major roof — No visible damage, but age is implied
- Major flooring — No visible flooring, but age is implied
- Major interior walls/paint — No visible interior, but age is implied
- Major kitchen — No visible kitchen, but age is implied
- Major bathrooms — No visible bathrooms, but age is implied
- Major HVAC/mechanicals — No visible HVAC/mechanicals, but age is implied
- Major landscaping — No visible landscaping, but age is implied
Value-add opportunities
- Both exterior siding and roof repair — Improves curb appeal and structural integrity
- Both interior paint and flooring — Enhances living space and rental appeal
- Both HVAC and electrical updates — Ensures comfort and energy efficiency
- Both landscaping and curb appeal — Enhances property's visual appeal
Renovation cost estimate screening
| Repair item | Severity | Est. cost |
|---|---|---|
| exterior siding · Significant wear and tear | Major | $15,000–50,000 |
| roof · No visible damage, but age is implied | Major | $15,000–50,000 |
| flooring · No visible flooring, but age is implied | Major | $15,000–50,000 |
| interior walls/paint · No visible interior, but age is implied | Major | $15,000–50,000 |
| kitchen · No visible kitchen, but age is implied | Major | $15,000–50,000 |
| bathrooms · No visible bathrooms, but age is implied | Major | $15,000–50,000 |
| HVAC/mechanicals · No visible HVAC/mechanicals, but age is implied | Major | $15,000–50,000 |
| landscaping · No visible landscaping, but age is implied | Major | $15,000–50,000 |
| Total estimated repair cost · 8 items | $120,000–400,000 |
Value-add ROI direction
- Both exterior siding and roof repair — Improves curb appeal and structural integrity ↑
- Both interior paint and flooring — Enhances living space and rental appeal ↑
- Both HVAC and electrical updates — Ensures comfort and energy efficiency ↑
- Both landscaping and curb appeal — Enhances property's visual appeal ↑
ⓘ Cost ranges are severity-bucket heuristics (US national rule-of-thumb). Get contractor quotes + a written scope before underwriting a rehab budget.
Schools (NCES district)
- District
- Buffalo City School District
- NCES district ID
- 3605850
- Math proficiency
- 41% ▲ 11.00%
- Reading proficiency
- 40% ▲ 7.00%
- Median HH income
- $31,665
- Composite
- 33.17/100
- National rank
- #5544
- State rank
- #535 of 590 in NY
Livability — Buffalo
- Score
- 77/100
- State rank
- #195
- US rank
- #3011
Category grades
Schools grade is shown separately in the Schools card above.
Census & demographics
- Census place
- Buffalo, NY
- County
- Erie County · 714,559 people
- City population
- 440,021
- Metro
- Buffalo-Cheektowaga, NY
- Population (ZIP)
- 24,428
- Household income
- $70,963
- Rent vs Own
- Severe rent burden
- 602.0
Population outlook (Erie County) Hauer SSP2
- Today (2025)
- 933,037 people
- By 2030
- 935,181 · +0.2%
- By 2040
- 928,531 · -0.5%
- By 2050
- 905,725 · -2.9%
- By 2075
- 834,037 · -10.6%
- By 2100
- 708,033 · -24.1%
Race, ethnicity, and origin ACS 2023
- Neighborhood character
- Predominantly White (76%)
- Race & ethnicity
- White 76% Hispanic / Latino 13% Two or more races 6% Black 5% Asian 2%
- Hispanic origin (detail)
- Puerto Rican 10% Cuban 1%
- Common ancestry
- Romanian 16% Lithuanian 1% Subsaharan African 1%
- Foreign-born
- 4% · Canada, Jamaica, China
- Languages at home
- 90% English-only · Spanish 4% Chinese 1%
Political lean MEDSL · Erie
- 2024 margin
- Lean D (+9.7) · D 54.8% · R 45.2%
- 2008→2024 swing
- -7.9pp toward R · 2008: 17.5pp · 2024: 9.7pp
- All cycles
- 2024: D+9.7 2020: D+14.7 2016: D+4.8 2012: D+15.6 2008: D+17.5
Not yet ingested
- Civics
- —
Market trends
- HPI YoY
- ▼ -146.29%
- Current HPI
- 402.5053
- Rent YoY
- ▲ 7.62%
- Metro
- Buffalo-Cheektowaga, NY
- State GDP YoY
- ▲ 2.60%
- F500 in state
- 92
Industry mix (Fortune 500 HQ in NY)
| Industry | F500 HQs | Revenue |
|---|---|---|
| Financial Services | 10 | $950B |
|
||
| Consumer Goods | 9 | $162B |
|
||
| Insurance | 4 | $225B |
|
||
| Telecommunications | 2 | $144B |
|
||
| Pharmaceuticals | 2 | $112B |
|
||
| Media / Entertainment | 2 | $69B |
|
||
Price history
1 event — show timeline
- 2026-04-02 Listed $250,000 WNYREIS
Cash-flow waterfall
monthlySold comps — $/sqft
last 12 mo · ≤1 miLoading sold comps…