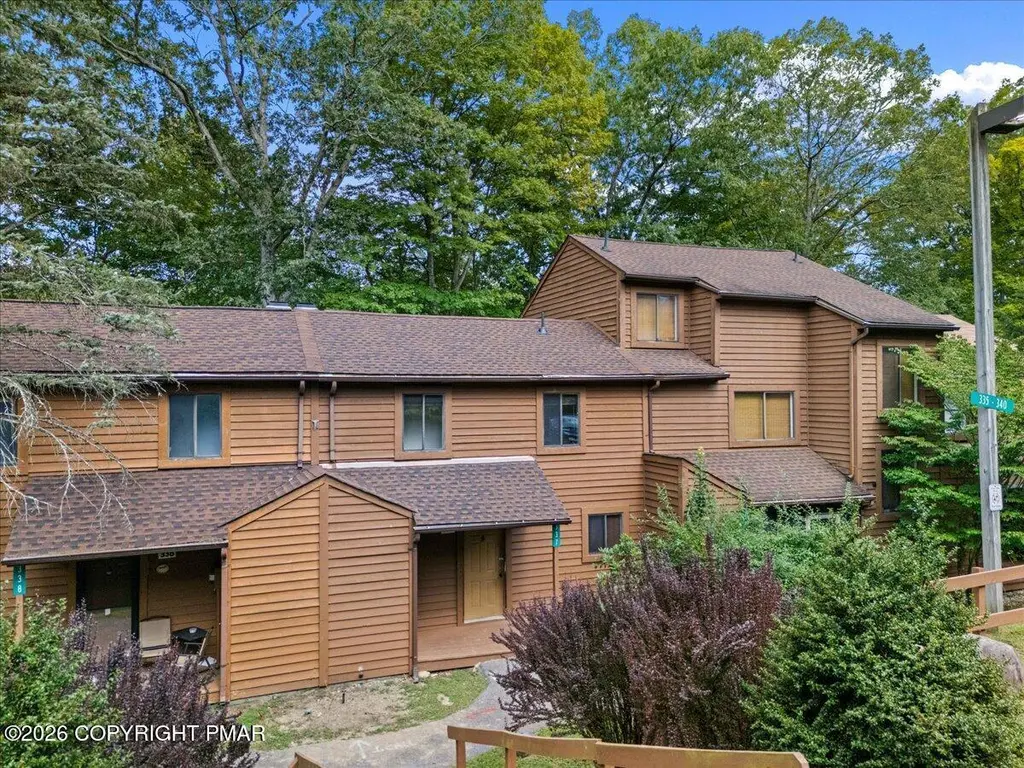
337 Crewe Ct · Lehman, PA
Flood risk 1/10 · Minimal
- FEMA flood zone
- X (unshaded)
- Chance of flooding over 30 yrs
- 0.0%
- Est. flood insurance / yr
- $473 – $860
Fire risk 4/10 · Minor
- Est. fire insurance / yr
- $511 – $949
Heat risk 4/10 · Minor
- Hot days now (above 95°F)
- 7 days/yr
- Hot days in 30 yrs
- 15 days/yr
Wind risk 4/10 · Minor
- Chance of severe wind over 30 yrs
- 11.0%
Air-quality risk 2/10 · Minimal
- Unhealthy air days now
- 1 days/yr
- Unhealthy air days in 30 yrs
- 2 days/yr
Risk factors via First Street. Map © Google.
Why this score? — see what drove the C- grade
The composite is a weighted blend of 9 inputs, each scored 0–100. Each bar is that input's sub-score; the figure is the points it added to the 100-point composite (weight × sub-score).
- Cash flow +19.6/30.0
- Appreciation +6.8/10.0
- 1% rule +6.6/10.0
- DSCR +6.2/10.0
- Schools +3.0/10.0
- Rent growth +2.5/5.0
- Livability +2.5/5.0
- Condition / age +2.5/5.0
- ARV discount +0.4/15.0
$169,900
🖨 Deal sheet (PDF) 📄 Offer letter ✓ Due diligence
Listing remarks MLS
The Falls At Saw Creek Newly updated 2 bedroom, 2 bath Townhouse. The unit has a cozy wood burning Fireplace, new Laminate flooring, new appliances, new kitchen, roof only2 years old, newer windows and deck. Ready for a new owner to enjoy. Ammenities include basketball, outdoor pool, tennis, garbage, snow removal, shoveling and road manintenance.
Key facts
- New kitchen
- Roof only2 years old
- New appliances
Tags
Neighborhood map
What this means for you Summary
Snapshot
- This is a 2-bed/1.5-bath condo listed at $170k.
Deal economics
- At list price, monthly cash flow is $195 ($2k/yr) — positive.
- The deal already cash-flows at list — no discount required.
- Meets the 1% rule at list price ($2k rent vs $170k).
- Recommended offer: $155k (9.0% below list) — sets the bar for market timing.
Location & tenants
- Location reads: area grade C — affects rentability + tenant quality, not the cash-flow math above.
- East Stroudsburg Area SD (rural): math 25% / reading 43% proficiency, ranked #413 of 539 in PA (top 77%) — families likely to look elsewhere, expect single-tenant / working-renter base with shorter leases.
- Market conditions: 293 active listings in the ZIP; 213 units permitted in Pike County in 2024 (0 in 5+ unit buildings).
Forward outlook
- In year one you build about $7k of equity ($1k loan paydown + $6k appreciation (3.5% local appreciation)).
- Pike County population projected at -25% by 2050 — secular population decline; favor cash flow + early exit over multi-decade hold.
- At projected returns (3.5% appreciation + 3.0% rent growth), your $48k cash investment doubles in ~5 years — after that, you're playing with house money.
- By year 5, paydown + projected appreciation supports a ~$31k cash-out refi (75% LTV) — recoverable capital for the next deal without selling this one.
Negotiation context
- It's been on market 117 days — a 9% lower offer ($155k) is reasonable based on typical stale-listing flexibility.
- 4 sale attempts since 26y ago; this cycle's ask has dropped $29k (15%) from the opening price — seller is motivated, your offer sets the floor, not the list.
- Current owner paid $42k; list at $170k implies a 309% gain — meaningful room to come down on a strong offer.
Questions for the listing agent
- It's been on market 117 days. Have you received any prior offers? Is the seller open to a 9% concession, seller financing, or rate buy-down credit?
- What does the HOA fee cover, when was the last increase, and are there any pending special assessments or reserve-fund shortfalls?
- Any open or pending special assessments — roof, HVAC, plumbing, elevator, façade? What's the per-unit balance and payoff schedule, and is the seller paying it off at close or rolling it to the buyer?
- Why hasn't it sold? Are there any deal-killer items the seller is aware of (foundation, flood, title, zoning, code violations)?
- Is there a deadline driving the sale (1031 exchange, divorce, estate, relocation)? That informs how much negotiation room exists.
- What's the average days-on-market for RENTAL listings here right now (not sales)? A rising rental-DOM trend means longer vacancies and softer asking-rent achievability than the comps imply.
- What's the recent tenant-quality profile in this submarket — average credit score on applications, eviction rate, late-payment / NSF rate, and stable-employment percentage? A property-management company in the area should have these aggregated.
- How much new apartment / multifamily construction is in the pipeline within 1–3 miles? Heavy new supply (>2% of stock underway) typically softens rents 12–24 months out; light construction supports rent growth.
Investment metrics
- 1% rule
- 1.16% ✓
- Cap rate
- 7.67%
- Cash-on-cash
- 4.92%
- DSCR
- 1.22
- GRM
- 7.2
CMA / ARV
- ARV (median comp)
- $146,797
- List price
- $169,900
- Delta
- 15.74%
- Verdict
- OVERPRICED
- Comps
- 20 within 1.0 mi
Projected returns pro-forma
3.51% appreciation · 3.0% rent growth · sell at horizon
- IRR
- 13.4%
- Equity multiple
- 1.79×
- Total profit
- $37,616
- Equity at exit
- $81,281
- IRR
- 15.1%
- Equity multiple
- 3.34×
- Total profit
- $111,167
- Equity at exit
- $129,204
Cash invested: $47,572 (down + closing). Projections, not guarantees.
Landlord ↔ Tenant lean methodology
- Overall (STATE)
- 62 Landlord-Friendly
- State Pennsylvania
- 62 Landlord-Friendly · EVEN
- County
- — inherits STATE
- City
- — inherits STATE
ZIP-level market 18324
- Home prices YoY
- 1.5%
- Active inventory
- 293
- Price-to-rent
- 7.2×
Monthly cashflow live
- Estimated rent
- $1,968 medium interval (Pro) →
- Mortgage (P&I)
- −$891
- Tax from tax record
- −$186 /mo · $2,230/yr
- Insurance
- −$71
- HOA
- −$212
- Vacancy / Maint / Mgmt
- −$413
- Net cashflow
- $195
Break-even live
Sensitivity live
| Price | -10% $291 | -5% $243 | +0% $195 | +5% $147 | +10% $99 |
|---|---|---|---|---|---|
| Rent | -10% $39 | -5% $117 | +0% $195 | +5% $273 | +10% $350 |
| Rate | -1.0pp $280 | -0.5pp $238 | base $195 | +0.5pp $151 | +1.0pp $106 |
UW: 25.0% down · 7.5% · 30yr · 1.5% tax · 5.0% vac · 8.0% maint · 8.0% mgmt
Financing live
Cash to close
- Down payment
- $42,475
- Closing costs
- $5,097
- Reserves months
- —
- Total cash needed
- —
Loan-product check · same deal, 3 products live
Conventional
25% down · 7.5% · 30yr
- Down + closing
- —
- Monthly P&I
- —
- Monthly cashflow
- —
- DSCR
- —
- Eligible?
- —
Personal DTI + credit; lowest rate.
DSCR
20% down · 8.5% · 30yr
- Down + closing
- —
- Monthly P&I
- —
- Monthly cashflow
- —
- DSCR
- —
- Eligible?
- —
No personal income docs; deal must DSCR.
Hard money
10% down · 12.0% · 12mo
- Down + closing
- —
- Monthly P&I
- —
- Monthly cashflow
- —
- DSCR
- —
- Eligible?
- —
Short-term bridge; refi at stabilization.
HOA detail condo
- Monthly dues
- $212 · $2,544/yr
- Likely covers
- trashsnow removalpool
- Assessments
- None detected in remarks — confirm with the listing agent.
Listing history 27 events
-
2026-06-21days on market $169,900 Active 117 DOM
-
2026-06-19days on market $169,900 Active 115 DOM
-
2026-06-18days on market $169,900 Active 114 DOM
-
2026-06-17days on market $169,900 Active 113 DOM
-
2026-06-16days on market $169,900 Active 112 DOM
-
2026-06-15days on market $169,900 Active 111 DOM
-
2026-06-14days on market $169,900 Active 109 DOM
-
2026-06-13remarks 640-char remark
-
2026-06-13pricedays on market $169,900 Active 108 DOM
-
2026-06-10days on market $179,900 Active 106 DOM
-
2026-06-09days on market $179,900 Active 105 DOM
-
2026-06-08days on market $179,900 Active 104 DOM
-
2026-06-07days on market $179,900 Active 103 DOM
-
2026-06-05days on market $179,900 Active 100 DOM
-
2026-06-03remarks 534-char remark
-
2026-06-03price $179,900 Active 98 DOM
-
2026-06-02days on market $184,900 Active 98 DOM
-
2026-06-01days on market $184,900 Active 97 DOM
-
2026-05-31days on market $184,900 Active 96 DOM
-
2026-05-30days on market $184,900 Active 95 DOM
-
2026-03-25price $189,900 349-char remark
Show marketing remark (349 chars)
The Falls At Saw Creek Newly updated 2 bedroom, 2 bath Townhouse. The unit has a cozy wood burning Fireplace, new Laminate flooring, new appliances, new kitchen, roof only2 years old, newer windows and deck. Ready for a new owner to enjoy. Ammenities include basketball, outdoor pool, tennis, garbage, snow removal, shoveling and road manintenance.
-
2026-02-21$199,000 Active 349-char remark
Show marketing remark (349 chars)
The Falls At Saw Creek Newly updated 2 bedroom, 2 bath Townhouse. The unit has a cozy wood burning Fireplace, new Laminate flooring, new appliances, new kitchen, roof only2 years old, newer windows and deck. Ready for a new owner to enjoy. Ammenities include basketball, outdoor pool, tennis, garbage, snow removal, shoveling and road manintenance.
-
2025-09-03$149,900 Active
-
2016-03-23$24,000
-
2000-11-22soldstatus $41,500
-
2000-11-21soldstatus $41,500
-
2000-04-27$47,900
ⓘ Source: listings_history table (triggers on properties + properties_extension) + one-shot
backfill from property_details.listing_events for pre-trigger history.
Tax reassessment forecast PA · Partial reset (capped growth)
- Current annual tax
- $2,230 · $186/mo
- Projected year-2 tax
- $2,457 · $205/mo
- Expected delta
- +$227/yr (+$19/mo · 10.2%)
ⓘ Screening estimate from a state-policy table — verify with the county assessor before closing.
Climate risk First Street
- Flood 1/10 Low FEMA zone X (unshaded) · 0% chance over 30 yrs
- Wildfire 4/10 Moderate
- Heat 4/10 Moderate 7 d/yr ≥95°F today · 15 d/yr by 30 yrs out
- Wind 4/10 Moderate 11% chance of damaging wind over 30 yrs
- Air quality 2/10 Low 1 unhealthy d/yr today · 2 by 30 yrs out
Nearby sold comps map
Loading sold comps map…
Walkable amenities ~0.75 mi
Loading nearby amenities…
Taxation est. · year 1
- Rental income
- $23,613
- − Mortgage interest
- −$9,517
- − Property taxes
- −$2,230
- − Insurance
- −$850
- − Repairs & maintenance
- −$1,889
- − Management
- −$1,889
- − HOA
- −$2,544
- − Depreciation
- −$4,943
- Taxable loss
- −$249
- Est. tax savings @ 24.0%
- +$60
- After-tax cash flow
- $2,398/yr
For passive investors: Depreciation is non-cash, so a rental often shows a tax loss while cash-flowing — sheltering income. Rental losses are passive: they offset passive income freely, and up to $25,000/yr can offset ordinary (W-2) income if you actively participate and your MAGI is under $100k (phasing out to $0 by $150k); unused losses carry forward. On sale, claimed depreciation is recaptured at up to 25%, and gains may owe capital-gains tax (a 1031 exchange can defer both). Figures are a year-1 estimate at your 24.0% rate — not tax advice; consult a CPA.
Schools (NCES district)
- District
- East Stroudsburg Area SD
- NCES district ID
- 4208670
- Math proficiency
- 25% ▼ -11.00%
- Reading proficiency
- 43% ▼ -18.00%
- Median HH income
- $57,142
- Composite
- 30.13/100
- National rank
- #6332
- State rank
- #413 of 539 in PA
Livability — Lehman
No livability data for this city. (Only ~50 U.S. cities are tracked.)
Census & demographics
- Census place
- Saw Creek, PA
- Population (ZIP)
- 9,591
Population outlook (Pike County) Hauer SSP2
- Today (2025)
- 53,548 people
- By 2030
- 51,622 · -3.6%
- By 2040
- 46,490 · -13.2%
- By 2050
- 40,372 · -24.6%
- By 2075
- 31,951 · -40.3%
- By 2100
- 26,821 · -49.9%
Race, ethnicity, and origin ACS 2023
- Neighborhood character
- Diverse neighborhood (Simpson 0.67)
- Race & ethnicity
- White 47% Hispanic / Latino 26% Black 21% Two or more races 12% Asian 1%
- Hispanic origin (detail)
- Mexican 1% Puerto Rican 12% Cuban 3% Dominican 5%
- Common ancestry
- Romanian 2% Estonian 1% Lithuanian 1%
- Foreign-born
- 19% · Canada, South Korea
- Languages at home
- 69% English-only · Spanish 19% Russian/Polish/Slavic 4% French/Haitian/Cajun 3%
Political lean MEDSL · Pike
- 2024 margin
- Strong R (+24.1) · D 37.6% · R 61.6%
- 2008→2024 swing
- -19.8pp toward R · 2008: -4.2pp · 2024: -24.1pp
- All cycles
- 2024: R+24.1 2020: R+19.0 2016: R+26.0 2012: R+11.0 2008: R+4.2
Not yet ingested
- Civics
- —
Market trends
- HPI YoY
- ▲ 3.51%
- Current HPI
- 243.6754
- Rent YoY
- —
- Metro
- —
- State GDP YoY
- ▲ 1.68%
- F500 in state
- 34
Industry mix (Fortune 500 HQ in PA)
| Industry | F500 HQs | Revenue |
|---|---|---|
| Healthcare | 2 | $309B |
|
||
| Insurance | 2 | $27B |
|
||
| Telecommunications / Media | 1 | $124B |
|
||
| Industrial Distribution | 1 | $22B |
|
||
| Financial Services | 1 | $20B |
|
||
| Chemicals / Materials | 1 | $18B |
|
||
Price history
+296.5% since first listed7 events — show timeline
- 2026-03-25 Price Changed $189,900 PMAR
- 2026-02-21 Listed $199,000 PMAR
- 2025-09-03 Listed $149,900 PMAR
- 2016-03-23 Listed $24,000 PMAR
- 2000-11-22 Sold (Public Records) $41,500 Public Records
- 2000-11-21 Sold (MLS) $41,500 PMAR
- 2000-04-27 Listed $47,900 PMAR
Property tax history
+1.0%/yrLatest (2026): $2,230 · +1.6% YoY. Source: county tax records.
Cash-flow waterfall
monthlySold comps — $/sqft
last 12 mo · ≤1 miLoading sold comps…