15523 Fm 16 · Lindale, TX
Flood risk 1/10 · Minimal
- FEMA flood zone
- X (unshaded)
- Chance of flooding over 30 yrs
- 0.0%
- Est. flood insurance / yr
- $507 – $1,088
Fire risk 4/10 · Minor
- Est. fire insurance / yr
- $1,222 – $2,270
Heat risk 6/10 · Moderate
- Hot days now (above 109°F)
- 6 days/yr
- Hot days in 30 yrs
- 21 days/yr
Wind risk 6/10 · Moderate
- Chance of severe wind over 30 yrs
- 52.0%
Air-quality risk 2/10 · Minimal
- Unhealthy air days now
- 0 days/yr
- Unhealthy air days in 30 yrs
- 1 days/yr
Risk factors via First Street. Map © Google.
Why this score? — see what drove the B grade
The composite is a weighted blend of 9 inputs, each scored 0–100. Each bar is that input's sub-score; the figure is the points it added to the 100-point composite (weight × sub-score).
- Cash flow +30.0/30.0
- 1% rule +10.0/10.0
- DSCR +10.0/10.0
- ARV discount +7.5/15.0
- Schools +5.9/10.0
- Livability +4.0/5.0
- Condition / age +3.8/5.0
- Rent growth +2.5/5.0
- Appreciation +0.0/10.0
$69,000
🖨 Deal sheet 📄 Offer letter ✓ Due diligence
Listing remarks
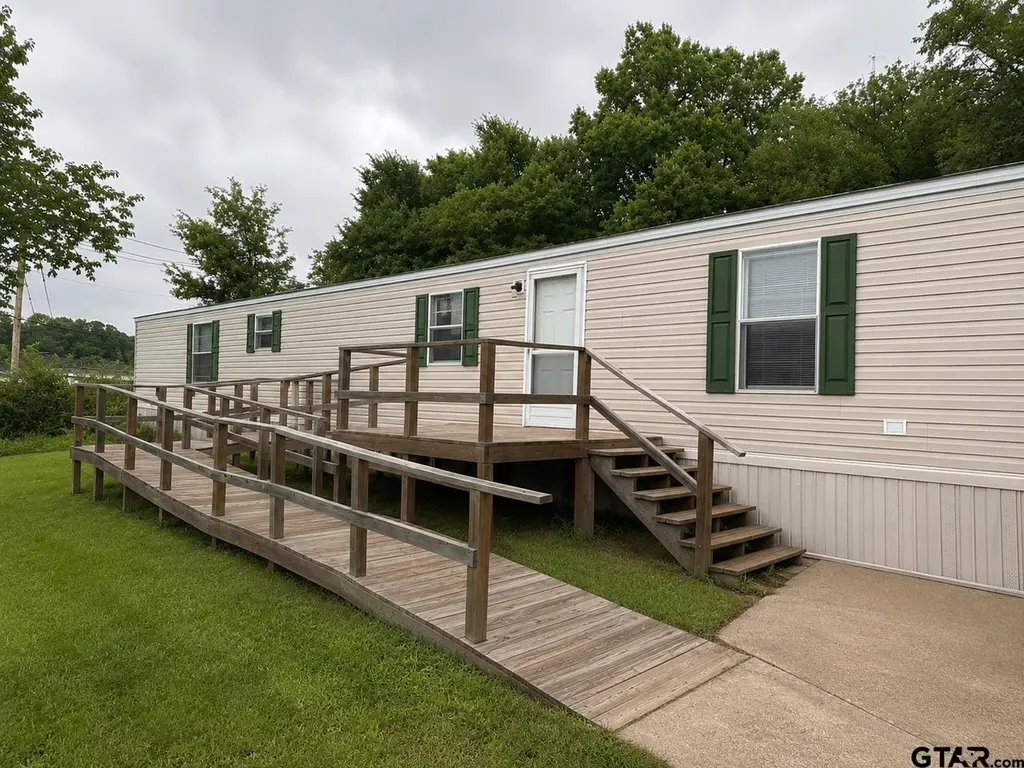
2003 mobile home located in the highly sought-after Lindale Independent School District featuring 2 bedrooms, 2 bathrooms, and 1,216 square feet of living space. This property offers a great opportunity for investors, rental income potential, or first-time homebuyers looking for an affordable option in a desirable area. The functional floor plan provides living areas, natural light, and a cozy feel throughout. Conveniently located with easy access to schools, shopping, dining, and nearby amenities. Whether you are looking to expand your investment portfolio or purchase your first home, this property has plenty of potential and value. Don’t miss the chance to make it your own!
Key facts
- Built 2003
- Listed 27 days
Property features AI
Exterior
- Home design: Single-story manufactured (mobile) home; Residential property; Composition roof; Aluminum and vinyl siding
- Construction: Aluminum siding; Vinyl siding; Composition roof; Built as a manufactured (mobile) home
- Exterior features: Front porch; Storage building/area
Interior
- Kitchen: Gas oven; Gas range
- Bathrooms: 2 full bathrooms
- Heating & cooling: Electric central heat; Central air; Ceiling fans
- Interior features: Ceiling fans; Central air
Neighborhood map
What this means for you Summary
Snapshot
- This is a 2-bed/2.0-bath manufactured listed at $69k. Condition is rated good.
Deal economics
- At list price, monthly cash flow is $511 ($6k/yr) — positive.
- The deal already cash-flows at list — no discount required.
- Meets the 1% rule at list price ($1k rent vs $69k).
- Recommended offer: $68k (1.5% below list) — sets the bar for market timing.
- Cap rate 15.2% vs local median 3.3% in Lindale — top-decile yield for the area; either an underpriced asset or a hidden risk that comps aren't pricing in. Stress-test before assuming the spread holds.
Location & tenants
- Location reads 79/100 on livability (#52 in TX, #2,100 nationally) — a middle-class / working-renter tenant base. Strengths: employment A+, cost of living A+, housing A+; Watch: amenities F, commute F.
- Lindale ISD (town): math 71% / reading 66% proficiency, ranked #20 of 826 in TX (top 2%) — acceptable for families but not a draw, mixed tenant base, ~2y average lease.
- Zoned schools: Lindale J H (math 81% / reading 72%, grade A, #30 of 1,662 statewide, top 2%, 711 students, 44% FRL); Lindale H S (math 79% / reading 75%, grade A-, #60 of 1,632 statewide, top 4%, 1,265 students, 38% FRL) — zoned schools at 41% FRL track the district average.
- Market conditions: 633 active listings in the ZIP; 17 comparable units currently listed for rent nearby; rentals at typical pace (median 21d on market — plan ~3-4 weeks tenant-placement turnaround); solid renter incomes; 595 units permitted in Smith County in 2024 (45 in 5+ unit buildings).
- This rent is only 15% of the median local income ($93k/yr) — well below the 30% rent-burden line; pricing power to push rent on renewal without tenant pushback.
Forward outlook
- Local home prices are declining (-3.0%/yr); year-one equity from $477 of loan paydown is wiped out by about $2k of value loss. Plan a longer hold.
- Smith County population projected at +24% by 2050 — long-run rental-demand tailwind backs the buy-and-hold thesis.
- At projected returns (-3.0% appreciation + 3.0% rent growth), your $19k cash investment doubles in ~4 years — after that, you're playing with house money.
Negotiation context
- It's been on market 28 days — a 2% lower offer ($68k) is reasonable based on typical stale-listing flexibility.
Risks & watch-outs
- Climate carrying-cost: major wind risk, 52% chance of damaging wind over 30y; extreme-heat days projected 6→21/yr by 2055 (HVAC capex compounding) — expect insurance premiums to compound above CPI over the hold.
Questions for the listing agent
- Is there a deadline driving the sale (1031 exchange, divorce, estate, relocation)? That informs how much negotiation room exists.
- What's the average days-on-market for RENTAL listings here right now (not sales)? A rising rental-DOM trend means longer vacancies and softer asking-rent achievability than the comps imply.
- What's the recent tenant-quality profile in this submarket — average credit score on applications, eviction rate, late-payment / NSF rate, and stable-employment percentage? A property-management company in the area should have these aggregated.
- How much new for-sale + rental construction is in the pipeline within 1–3 miles? Heavy new supply typically softens prices + rents 12–24 months out; constrained supply supports both.
Investment metrics
- 1% rule
- 1.71% ✓
- Cap rate
- 15.19%
- Cash-on-cash
- 31.77%
- DSCR
- 2.41
- GRM
- 4.9
CMA / ARV
No comps found within radius.
Projected returns pro-forma
-3.0% appreciation · 3.0% rent growth · sell at horizon
- IRR
- 26.7%
- Equity multiple
- 2.11×
- Total profit
- $21,378
- Equity at exit
- $10,288
- IRR
- 34.3%
- Equity multiple
- 4.13×
- Total profit
- $60,494
- Equity at exit
- $5,966
Cash invested: $19,320 (down + closing). Projections, not guarantees.
Landlord ↔ Tenant lean methodology
- Overall (STATE)
- 87 Strongly Landlord-Friendly
- State Texas
- 87 Strongly Landlord-Friendly · R+5
- County
- — inherits STATE
- City
- — inherits STATE
ZIP-level market 75771
- Home prices YoY
- -30.6%
- Active inventory
- 633
- Price-to-rent
- 4.9×
Monthly cashflow live
- Estimated rent
- $1,181 high interval (Pro) →
- Mortgage (P&I)
- −$362
- Tax from tax record
- −$31 /mo · $367/yr
- Insurance
- −$29
- HOA
- −$0
- Vacancy / Maint / Mgmt
- −$248
- Net cashflow
- $511
Break-even live
UW: 25.0% down · 7.5% · 30yr · 1.5% tax · 5.0% vac · 8.0% maint · 8.0% mgmt
Financing live
Cash to close
- Down payment
- $17,250
- Closing costs
- $2,070
- Reserves months
- —
- Total cash needed
- —
Loan-product check · same deal, 3 products live
Conventional
25% down · 7.5% · 30yr
- Down + closing
- —
- Monthly P&I
- —
- Monthly cashflow
- —
- DSCR
- —
- Eligible?
- —
Personal DTI + credit; lowest rate.
DSCR
20% down · 8.5% · 30yr
- Down + closing
- —
- Monthly P&I
- —
- Monthly cashflow
- —
- DSCR
- —
- Eligible?
- —
No personal income docs; deal must DSCR.
Hard money
10% down · 12.0% · 12mo
- Down + closing
- —
- Monthly P&I
- —
- Monthly cashflow
- —
- DSCR
- —
- Eligible?
- —
Short-term bridge; refi at stabilization.
Rent comps 17 comps
| Address | Beds | Baths | Sqft | Rent | $/sqft | DOM | Units | Dist |
|---|---|---|---|---|---|---|---|---|
| 300 Hilltop St Unit 29 Lindale, TX | 2.0 | 1.0 | 870 | $895 | $1.03 | 13d | 1 | 0.72mi |
| 300 Hilltop St Unit 13 Lindale, TX | 2.0 | 1.0 | 850 | $875 | $1.03 | 43d | 1 | 0.75mi |
| 300 Hilltop St Unit 16 Lindale, TX | 2.0 | 1.0 | 870 | $875 | $1.01 | 13d | 1 | 0.75mi |
| 303 Cooper St Unit 16 Lindale, TX | 2.0 | 1.0 | 870 | $875 | $1.01 | 13d | 1 | 0.77mi |
| 303 Cooper St Unit 13 Lindale, TX | 2.0 | 1.0 | 850 | $875 | $1.03 | 43d | 1 | 0.77mi |
| 527 N College St Lindale, TX | 2.0 | 1.5 | 1267 | $1,300 | $1.03 | 43d | 1 | 0.82mi |
| 527 N College St Unit 13 Lindale, TX | 2.0 | 1.5 | 1267 | $1,395 | $1.10 | 21d | 1 | 0.82mi |
| 206 Cooper St Lindale, TX | 2.0 | 1.0 | 1200 | $1,400 | $1.17 | 43d | 1 | 0.84mi |
| 75 Miranda Lambert Way Unit The Cannery R5 Lindale, TX | 1.0 | 1.5 | 1060 | $1,250 | $1.18 | 21d | 1 | 0.95mi |
| 75 Miranda Lambert Way Unit r4 Lindale, TX | 1.0 | 1.5 | 1060 | $1,250 | $1.18 | 43d | 1 | 0.95mi |
| 75 Miranda Lambert Way Apt R11 Lindale, TX | 1.0 | 1.5 | 775 | $1,195 | $1.54 | 21d | 1 | 0.96mi |
| 302 E South St Lindale, TX | 2.0 | 1.0 | 990 | $1,195 | $1.21 | 13d | 1 | 0.98mi |
| 15996 FM 849 Tyler, TX | 2.0 | 1.0 | 1080 | $1,425 | $1.32 | 21d | 1 | 1.01mi |
| 14560 Tucker St N Lindale, TX | 2.0 | 1.0 | 719 | $1,150 | $1.60 | 21d | 1 | 1.12mi |
| 14560 Tucker St Unit 11 Lindale, TX | 2.0 | 1.0 | 719 | $1,150 | $1.60 | 43d | 1 | 1.13mi |
| 602 E South St Unit 3 Lindale, TX | 2.0 | 1.0 | 950 | $1,200 | $1.26 | 21d | 1 | 1.25mi |
| 1238 Brad Cir Unit a Lindale, TX | 2.0 | 1.5 | 825 | $1,025 | $1.24 | 21d | 1 | 1.40mi |
Listing history 17 events
-
2026-06-19days on market $69,000 Active 28 DOM
-
2026-06-18days on market $69,000 Active 27 DOM
-
2026-06-17days on market $69,000 Active 26 DOM
-
2026-06-16days on market $69,000 Active 25 DOM
-
2026-06-15days on market $69,000 Active 24 DOM
-
2026-06-14days on market $69,000 Active 22 DOM
-
2026-06-13pricedays on market $69,000 Active 21 DOM
-
2026-06-10days on market $75,000 Active 19 DOM
-
2026-06-09days on market $75,000 Active 18 DOM
-
2026-06-08days on market $75,000 Active 17 DOM
-
2026-06-07pricedays on market $75,000 Active 16 DOM
-
2026-06-03days on market $80,000 Active 12 DOM
-
2026-06-02days on market $80,000 Active 11 DOM
-
2026-06-01days on market $80,000 Active 10 DOM
-
2026-05-31days on market $80,000 Active 9 DOM
-
2026-05-30days on market $80,000 Active 8 DOM
-
2026-05-22$80,000 Active
ⓘ Source: listings_history table (triggers on properties + properties_extension) + one-shot
backfill from property_details.listing_events for pre-trigger history.
Tax reassessment forecast TX · Resets to sale price
- Current annual tax
- $367 · $31/mo
- Projected year-2 tax
- $1,263 · $105/mo
- Expected delta
- +$895/yr (+$75/mo · 243.7%)
ⓘ Screening estimate from a state-policy table — verify with the county assessor before closing.
Climate risk First Street
- Flood 1/10 Low FEMA zone X (unshaded) · 0% chance over 30 yrs
- Wildfire 4/10 Moderate
- Heat 6/10 Major 6 d/yr ≥109°F today · 21 d/yr by 30 yrs out
- Wind 6/10 Major 52% chance of damaging wind over 30 yrs
- Air quality 2/10 Low 0 unhealthy d/yr today · 1 by 30 yrs out
Nearby sold comps map
Loading sold comps map…
Walkable amenities ~0.75 mi
Loading nearby amenities…
Taxation est. · year 1
- Rental income
- $14,167
- − Mortgage interest
- −$3,865
- − Property taxes
- −$367
- − Insurance
- −$345
- − Repairs & maintenance
- −$1,133
- − Management
- −$1,133
- − Depreciation
- −$2,007
- Taxable income
- $5,316
- Est. tax owed @ 24.0%
- −$1,276
- After-tax cash flow
- $4,862/yr
For passive investors: Depreciation is non-cash, so a rental often shows a tax loss while cash-flowing — sheltering income. Rental losses are passive: they offset passive income freely, and up to $25,000/yr can offset ordinary (W-2) income if you actively participate and your MAGI is under $100k (phasing out to $0 by $150k); unused losses carry forward. On sale, claimed depreciation is recaptured at up to 25%, and gains may owe capital-gains tax (a 1031 exchange can defer both). Figures are a year-1 estimate at your 24.0% rate — not tax advice; consult a CPA.
Condition & rehab AI · 7 photos
This 2003 manufactured home in Lindale, TX is in good condition with a good condition score of 75. It offers a good opportunity for investors or first-time homebuyers with cosmetic updates needed to enhance its resale and rental value.
Repairs flagged
- Moderate kitchen cabinets — dated and worn
- Moderate bathroom fixtures — standard and dated
Value-add opportunities
- Both paint interior walls — enhances curb appeal and interior aesthetics
- Both replace kitchen cabinets — modernizes the space and increases appeal
- Both update bathroom fixtures — modernizes the space and increases appeal
Renovation cost estimate screening
| Repair item | Severity | Est. cost |
|---|---|---|
| kitchen cabinets · dated and worn | Moderate | $3,000–15,000 |
| bathroom fixtures · standard and dated | Moderate | $3,000–15,000 |
| Total estimated repair cost · 2 items | $6,000–30,000 |
Value-add ROI direction
- Both paint interior walls — enhances curb appeal and interior aesthetics ↑
- Both replace kitchen cabinets — modernizes the space and increases appeal ↑
- Both update bathroom fixtures — modernizes the space and increases appeal ↑
ⓘ Cost ranges are severity-bucket heuristics (US national rule-of-thumb). Get contractor quotes + a written scope before underwriting a rehab budget.
Schools (NCES district)
- District
- Lindale ISD
- NCES district ID
- 4827510
- Math proficiency
- 71% ▼ -2.00%
- Reading proficiency
- 66% ▲ 4.00%
- Median HH income
- $57,325
- Composite
- 58.85/100
- National rank
- #974
- State rank
- #20 of 826 in TX
Livability — Lindale
- Score
- 79/100
- State rank
- #52
- US rank
- #2100
Category grades
Schools grade is shown separately in the Schools card above.
Census & demographics
- County
- Smith County · 180,570 people
- City population
- 21,238
- Metro
- Tyler, TX
- Population (ZIP)
- 21,238
- Household income
- $93,462
- Rent vs Own
- Severe rent burden
- 166.0
Population outlook (Smith County) Hauer SSP2
- Today (2025)
- 248,890 people
- By 2030
- 261,665 · +5.1%
- By 2040
- 286,114 · +15.0%
- By 2050
- 308,006 · +23.8%
- By 2075
- 354,171 · +42.3%
- By 2100
- 372,828 · +49.8%
Race, ethnicity, and origin ACS 2023
- Neighborhood character
- Predominantly White (81%)
- Race & ethnicity
- White 81% Hispanic / Latino 9% Two or more races 6% Black 5% Asian 2%
- Hispanic origin (detail)
- Mexican 8%
- Common ancestry
- Slovak 3% Serbian 2% Lithuanian 1%
- Foreign-born
- 5% · Canada, China
- Languages at home
- 93% English-only · Spanish 6%
Political lean MEDSL · Smith
- 2024 margin
- Solid R (+45.1) · D 27.0% · R 72.1%
- 2008→2024 swing
- -5.6pp toward R · 2008: -39.5pp · 2024: -45.1pp
- All cycles
- 2024: R+45.1 2020: R+39.4 2016: R+43.9 2012: R+46.9 2008: R+39.5
Not yet ingested
- Civics
- —
Market trends
- HPI YoY
- ▼ -88.40%
- Current HPI
- 200.187
- Rent YoY
- —
- Metro
- Tyler, TX
- State GDP YoY
- ▲ 3.95%
- F500 in state
- 110
Industry mix (Fortune 500 HQ in TX)
| Industry | F500 HQs | Revenue |
|---|---|---|
| Energy | 16 | $1,198B |
|
||
| Technology | 5 | $198B |
|
||
| Engineering / Construction | 4 | $72B |
|
||
| Energy Services | 3 | $60B |
|
||
| Utilities | 3 | $41B |
|
||
| Healthcare | 2 | $330B |
|
||
Price history
1 event — show timeline
- 2026-05-22 Listed $80,000 GTAR
Property tax history
-16.1%/yrLatest (2024): $367 · -12.2% YoY. Source: county tax records.
Cash-flow waterfall
monthlySold comps — $/sqft
last 12 mo · ≤1 miLoading sold comps…