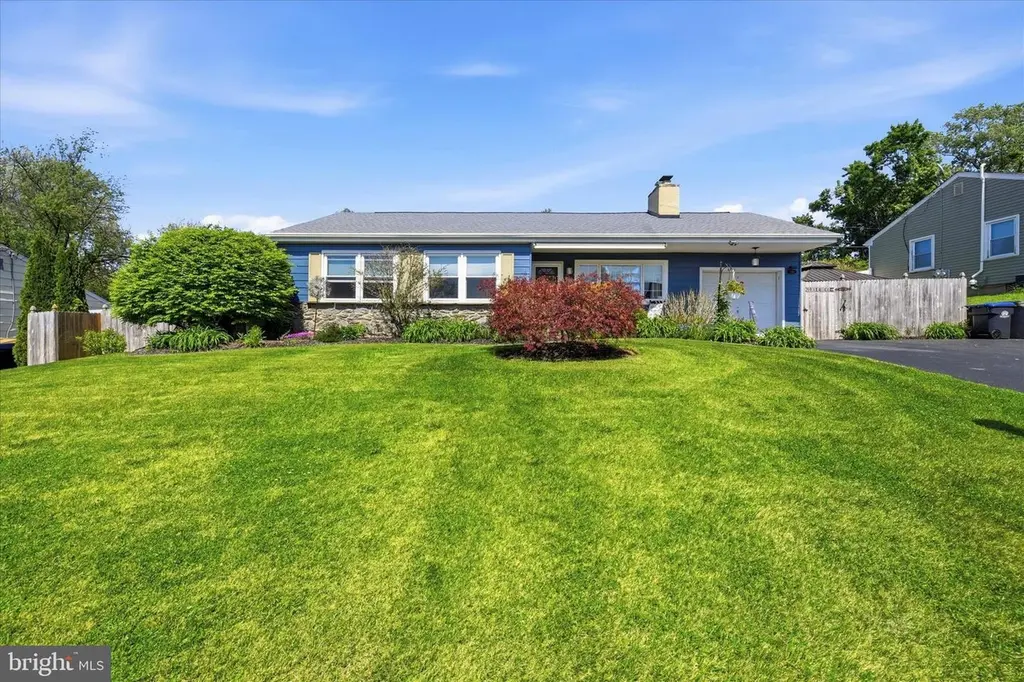
209 New St · Exton, PA
Flood risk 1/10 · Minimal
- FEMA flood zone
- X (unshaded)
- Chance of flooding over 30 yrs
- 0.0%
- Est. flood insurance / yr
- $473 – $860
Fire risk 1/10 · Minimal
- Est. fire insurance / yr
- $511 – $949
Heat risk 6/10 · Moderate
- Hot days now (above 100°F)
- 7 days/yr
- Hot days in 30 yrs
- 15 days/yr
Wind risk 5/10 · Moderate
- Chance of severe wind over 30 yrs
- 26.0%
Air-quality risk 3/10 · Minor
- Unhealthy air days now
- 2 days/yr
- Unhealthy air days in 30 yrs
- 5 days/yr
Risk factors via First Street. Map © Google.
Why this score? — see what drove the D grade
The composite is a weighted blend of 9 inputs, each scored 0–100. Each bar is that input's sub-score; the figure is the points it added to the 100-point composite (weight × sub-score).
- Cash flow +12.6/30.0
- ARV discount +8.4/15.0
- Schools +5.9/10.0
- Livability +4.5/5.0
- DSCR +3.8/10.0
- Rent growth +3.6/5.0
- 1% rule +3.0/10.0
- Condition / age +2.5/5.0
- Appreciation +0.0/10.0
$405,000
🖨 Deal sheet (PDF) 📄 Offer letter ✓ Due diligence
Listing remarks
Welcome to this charming and well-maintained home in the heart of Exton! Offering 3 bedrooms and 1 full bathroom, this property combines comfort, thoughtful updates, and inviting living spaces both inside and out. The home features a cozy gas fireplace that was installed just 3 years ago, creating the perfect space to relax and unwind. Major updates include a roof that is only 2 years old and windows replaced approximately 5 years ago, providing added peace of mind for the next owner. One of the standout features of this home is the spacious four-season room complete with heat and air conditioning, allowing you to enjoy the space comfortably year-round. The unfinished basement offers excell
Key facts
- 0.24 acre lot
- Garage
- Pool
Property features AI
Finance
- Other: Fee simple ownership
Exterior
- Parking: Front-entry attached garage (1-car); Driveway parking for 2 cars; On-street parking; Total of 3 garage/parking spaces
- Utilities: Public water; Public sewer; Electric service (cooling and hot water); Oil-fired heating
- Home design: Detached property; Architectural shingle roof; Frame construction with aluminum siding; Block foundation; Year built (assessor source)
- Construction: Frame and aluminum siding construction; Block foundation; Architectural shingle roof
- Exterior features: Awning(s); Patio(s); Gazebo; Personal (private) pool
Interior
- Kitchen: Commercial range; Dishwasher; Refrigerator
- Bedrooms: Three bedrooms on the main level
- Flooring: Hardwood; Laminate plank
- Bathrooms: One full bathroom
- Heating & cooling: Forced air heating (oil); Central air conditioning; Electric hot water
- Interior features: Attic; Dining area; Traditional floor plan; Screened porch; Full unfinished basement; One fireplace
- Laundry & utility: Washer and dryer (laundry located in basement)
Neighborhood map
What this means for you Summary
Snapshot
- This is a 3-bed/1.0-bath single-family listed at $405k.
Deal economics
- At list price, monthly cash flow is $-48 ($-579/yr) — negative.
- To cash-flow at today's rent, offer at most $396k (2.1% below list).
- To meet the 1% rule (rent ≥ 1% of price), the offer needs to be $323k (20.3% below list).
- Recommended offer: $323k (20.3% below list) — sets the bar for 1% rule.
- Cap rate 6.2% vs local median 3.1% in Exton — top-decile yield for the area; either an underpriced asset or a hidden risk that comps aren't pricing in. Stress-test before assuming the spread holds.
Location & tenants
- Location reads 89/100 on livability (#22 in PA, #136 nationally) — a professional / high-income tenant draw. Strengths: crime A+, amenities A+, employment A+; Watch: commute F, cost of living F.
- West Chester Area SD (suburban): math 56% / reading 74% proficiency, ranked #34 of 539 in PA (top 6%) — acceptable for families but not a draw, mixed tenant base, ~2y average lease; only 11% free/reduced lunch — higher-income household profile.
- Zoned schools: Exton El Sch (math 56% / reading 73%, grade B, #249 of 1,518 statewide, top 19%, 442 students, 16% FRL); J R Fugett Ms (math 40% / reading 75%, grade B, #61 of 512 statewide, top 13%, 908 students, 23% FRL); West Chester East Hs (math 86%, 1,251 students, 20% FRL).
- Market conditions: Rents rising fast (+4.5%/yr); 47 active listings in the ZIP; 7 comparable units currently listed for rent nearby; rentals leasing fast (median 0d on market — plan ~1-2 weeks tenant-placement turnaround); high-income renter base; 1,513 units permitted in Chester County in 2024 (354 in 5+ unit buildings).
- This rent runs 32% of the median local income ($122k/yr) — at the standard rent-burdened threshold; future hikes will face affordability resistance.
Forward outlook
- Local home prices are declining (-3.0%/yr); year-one equity from $3k of loan paydown is wiped out by about $12k of value loss. Plan a longer hold.
- Chester County population projected at +6% by 2050 — modest demand growth; plan on rents tracking national, not racing it.
Negotiation context
- Only 3 days on market — expect competitive offers; lowballing is unlikely to land.
Risks & watch-outs
- Watch-outs: built in 1956 — expect roof / HVAC / electrical / plumbing capex.
- Climate carrying-cost: moderate wind risk, 26% chance of damaging wind over 30y; extreme-heat days projected 7→15/yr by 2055 (HVAC capex compounding) — expect insurance premiums to compound above CPI over the hold.
Questions for the listing agent
- What do current leases actually rent for vs. the listed asking? Can we see a recent rent roll and the last 12 months of T-12 income?
- Built in 1956 — when were the roof, HVAC, electrical panel, plumbing, and water heater last replaced?
- Is there a deadline driving the sale (1031 exchange, divorce, estate, relocation)? That informs how much negotiation room exists.
- Schools are B-rated — typically a magnet for longer-tenancy family renters. What's the average tenant stay here, and is there a school-zone premium baked into asking?
- The area grade is low — what's the realistic commute time and amenity access for the typical tenant pool here? Any planned neighborhood developments (good or bad) we should know about?
- What's the average days-on-market for RENTAL listings here right now (not sales)? A rising rental-DOM trend means longer vacancies and softer asking-rent achievability than the comps imply.
- What's the recent tenant-quality profile in this submarket — average credit score on applications, eviction rate, late-payment / NSF rate, and stable-employment percentage? A property-management company in the area should have these aggregated.
- How much new for-sale + rental construction is in the pipeline within 1–3 miles? Heavy new supply typically softens prices + rents 12–24 months out; constrained supply supports both.
Investment metrics
- 1% rule
- 0.80% ✗
- Cap rate
- 6.15%
- Cash-on-cash
- -0.51%
- DSCR
- 0.98
- GRM
- 10.4
CMA / ARV
- ARV (median comp)
- $413,385
- List price
- $405,000
- Delta
- -2.03%
- Verdict
- FAIR
- Comps
- 17 within 1.0 mi
Show comp detail 2 sales within ~0.75 mi
| Address | Dist | Beds/Ba | Sqft | Sold | Price | $/sf | Match |
|---|---|---|---|---|---|---|---|
| 222 New St | 0.09mi | 3/2.0 | 1,200 (+14%) | 11mo | $363,210 | $303 | 60 |
| 218 N Laurel Ln | 0.65mi | 3/1.5 | 1,207 (+14%) | 22mo | $419,500 | $348 | 26 |
Match score weights: distance 35% · size 25% · config 20% · recency 20%. Top-matched comps best support the ARV.
Projected returns pro-forma
-3.0% appreciation · 4.51% rent growth · sell at horizon
- IRR
- -15.6%
- Equity multiple
- 0.44×
- Total profit
- $-63,791
- Equity at exit
- $60,387
- IRR
- -4.9%
- Equity multiple
- 0.66×
- Total profit
- $-38,723
- Equity at exit
- $35,017
Cash invested: $113,400 (down + closing). Projections, not guarantees.
Landlord ↔ Tenant lean methodology
- Overall (STATE)
- 62 Landlord-Friendly
- State Pennsylvania
- 62 Landlord-Friendly · EVEN
- County
- — inherits STATE
- City
- — inherits STATE
ZIP-level market 19341
- Rents YoY
- 4.5%
- Active inventory
- 47
- Price-to-rent
- 10.4×
Monthly cashflow live
- Estimated rent
- $3,230 high interval (Pro) →
- Mortgage (P&I)
- −$2,124
- Tax from tax record
- −$307 /mo · $3,686/yr
- Insurance
- −$169
- HOA
- −$0
- Vacancy / Maint / Mgmt
- −$678
- Net cashflow
- $-48
Break-even live
Sensitivity live
| Price | -10% $181 | -5% $66 | +0% $-48 | +5% $-163 | +10% $-277 |
|---|---|---|---|---|---|
| Rent | -10% $-303 | -5% $-176 | +0% $-48 | +5% $79 | +10% $207 |
| Rate | -1.0pp $156 | -0.5pp $55 | base $-48 | +0.5pp $-153 | +1.0pp $-260 |
UW: 25.0% down · 7.5% · 30yr · 1.5% tax · 5.0% vac · 8.0% maint · 8.0% mgmt
Financing live
Cash to close
- Down payment
- $101,250
- Closing costs
- $12,150
- Reserves months
- —
- Total cash needed
- —
Loan-product check · same deal, 3 products live
Conventional
25% down · 7.5% · 30yr
- Down + closing
- —
- Monthly P&I
- —
- Monthly cashflow
- —
- DSCR
- —
- Eligible?
- —
Personal DTI + credit; lowest rate.
DSCR
20% down · 8.5% · 30yr
- Down + closing
- —
- Monthly P&I
- —
- Monthly cashflow
- —
- DSCR
- —
- Eligible?
- —
No personal income docs; deal must DSCR.
Hard money
10% down · 12.0% · 12mo
- Down + closing
- —
- Monthly P&I
- —
- Monthly cashflow
- —
- DSCR
- —
- Eligible?
- —
Short-term bridge; refi at stabilization.
Rent comps 7 comps
| Address | Beds | Baths | Sqft | Rent | $/sqft | DOM | Units | Dist |
|---|---|---|---|---|---|---|---|---|
| 109 Commerce Dr Exton, PA | 1.0–3.0 | 1.0–2.0 | 1120 | $3,798 | $3.39 | 0d | 16 | 0.48mi |
| 181 N Pottstown Pike Exton, PA | 2.0 | 1.0–2.0 | 886 | $2,844 | $3.21 | 0d | 22 | 0.51mi |
| 350 Waterloo Blvd Exton, PA | 1.0–2.0 | 1.0–2.0 | 1113 | $4,814 | $4.33 | 0d | 16 | 0.80mi |
| 365 Waterloo Blvd Exton, PA | 1.0–2.0 | 1.0–2.0 | 987 | $2,612 | $2.65 | 0d | 15 | 0.87mi |
| 779 Reading Ct #40 West Chester, PA | 2.0 | 2.0 | 1112 | $2,300 | $2.07 | 45d | 1 | 0.88mi |
| 320 Henley Dr Franklin Center, PA | 2.0–3.0 | 2.5 | 1883 | $4,496 | $2.39 | 0d | 8 | 1.16mi |
| 279 Lindenwood Dr Exton, PA | 1.0–3.0 | 1.0–2.5 | 1169 | $3,200 | $2.74 | 5d | 17 | 1.33mi |
Listing history 3 events
-
2026-05-17status Pending 1099-char remark
-
2026-05-15$405,000 Active 1099-char remark
-
2026-05-13historical $405,000 1099-char remark
ⓘ Source: listings_history table (triggers on properties + properties_extension) + one-shot
backfill from property_details.listing_events for pre-trigger history.
Tax reassessment forecast PA · Partial reset (capped growth)
- Current annual tax
- $3,686 · $307/mo
- Projected year-2 tax
- $5,043 · $420/mo
- Expected delta
- +$1,356/yr (+$113/mo · 36.8%)
ⓘ Screening estimate from a state-policy table — verify with the county assessor before closing.
Climate risk First Street
- Flood 1/10 Low FEMA zone X (unshaded) · 0% chance over 30 yrs
- Wildfire 1/10 Low
- Heat 6/10 Major 7 d/yr ≥100°F today · 15 d/yr by 30 yrs out
- Wind 5/10 Major 26% chance of damaging wind over 30 yrs
- Air quality 3/10 Moderate 2 unhealthy d/yr today · 5 by 30 yrs out
Nearby sold comps map
Loading sold comps map…
Walkable amenities ~0.75 mi
Loading nearby amenities…
Taxation est. · year 1
- Rental income
- $38,758
- − Mortgage interest
- −$22,686
- − Property taxes
- −$3,686
- − Insurance
- −$2,025
- − Repairs & maintenance
- −$3,101
- − Management
- −$3,101
- − Depreciation
- −$11,782
- Taxable loss
- −$7,622
- Est. tax savings @ 24.0%
- +$1,829
- After-tax cash flow
- $1,251/yr
For passive investors: Depreciation is non-cash, so a rental often shows a tax loss while cash-flowing — sheltering income. Rental losses are passive: they offset passive income freely, and up to $25,000/yr can offset ordinary (W-2) income if you actively participate and your MAGI is under $100k (phasing out to $0 by $150k); unused losses carry forward. On sale, claimed depreciation is recaptured at up to 25%, and gains may owe capital-gains tax (a 1031 exchange can defer both). Figures are a year-1 estimate at your 24.0% rate — not tax advice; consult a CPA.
Schools (NCES district)
- District
- West Chester Area SD
- NCES district ID
- 4225290
- Math proficiency
- 56% ▼ -8.00%
- Reading proficiency
- 74% ▼ -6.00%
- Median HH income
- $87,125
- Composite
- 58.7/100
- National rank
- #980
- State rank
- #34 of 539 in PA
Livability — Exton
- Score
- 89/100
- State rank
- #22
- US rank
- #136
Category grades
Schools grade is shown separately in the Schools card above.
Census & demographics
- Census place
- Exton, PA
- County
- Chester County · 432,350 people
- City population
- 21,709
- Metro
- Philadelphia-Camden-Wilmington, PA-NJ-DE-MD
- Population (ZIP)
- 21,709
- Household income
- $121,680
- Rent vs Own
- Severe rent burden
- 658.0
Population outlook (Chester County) Hauer SSP2
- Today (2025)
- 546,756 people
- By 2030
- 559,441 · +2.3%
- By 2040
- 576,377 · +5.4%
- By 2050
- 580,602 · +6.2%
- By 2075
- 581,575 · +6.4%
- By 2100
- 540,922 · -1.1%
Race, ethnicity, and origin ACS 2023
- Neighborhood character
- Predominantly White (73%)
- Race & ethnicity
- White 73% Asian 13% Hispanic / Latino 7% Two or more races 7% Black 2%
- Hispanic origin (detail)
- Mexican 1% Puerto Rican 2% Cuban 2%
- Common ancestry
- Romanian 6% German 2% Lithuanian 2%
- Foreign-born
- 14% · China, Canada, South Korea
- Languages at home
- 84% English-only · Other Indo-European 5% Other Asian/Pacific 3% Chinese 3%
Political lean MEDSL · Chester
- 2024 margin
- D (+14.5) · D 56.7% · R 42.2% · Other 1.0%
- 2008→2024 swing
- +5.2pp toward D · 2008: 9.2pp · 2024: 14.5pp
- All cycles
- 2024: D+14.5 2020: D+17.0 2016: D+9.2 2012: R+0.4 2008: D+9.2
Not yet ingested
- Civics
- —
Market trends
- HPI YoY
- ▼ -237.85%
- Current HPI
- 291.7761
- Rent YoY
- ▲ 4.51%
- Metro
- Philadelphia-Camden-Wilmington, PA-NJ-DE-MD
- State GDP YoY
- ▲ 1.68%
- F500 in state
- 34
Industry mix (Fortune 500 HQ in PA)
| Industry | F500 HQs | Revenue |
|---|---|---|
| Healthcare | 2 | $309B |
|
||
| Insurance | 2 | $27B |
|
||
| Telecommunications / Media | 1 | $124B |
|
||
| Industrial Distribution | 1 | $22B |
|
||
| Financial Services | 1 | $20B |
|
||
| Chemicals / Materials | 1 | $18B |
|
||
Price history
+0.0% since first listed3 events — show timeline
- 2026-05-17 Pending — BRIGHT MLS
- 2026-05-15 Listed $405,000 BRIGHT MLS
- 2026-05-13 Coming Soon $405,000 BRIGHT MLS
Property tax history
+2.0%/yrLatest (2026): $3,686 · +2.2% YoY. Source: county tax records.
Cash-flow waterfall
monthlySold comps — $/sqft
last 12 mo · ≤1 miLoading sold comps…