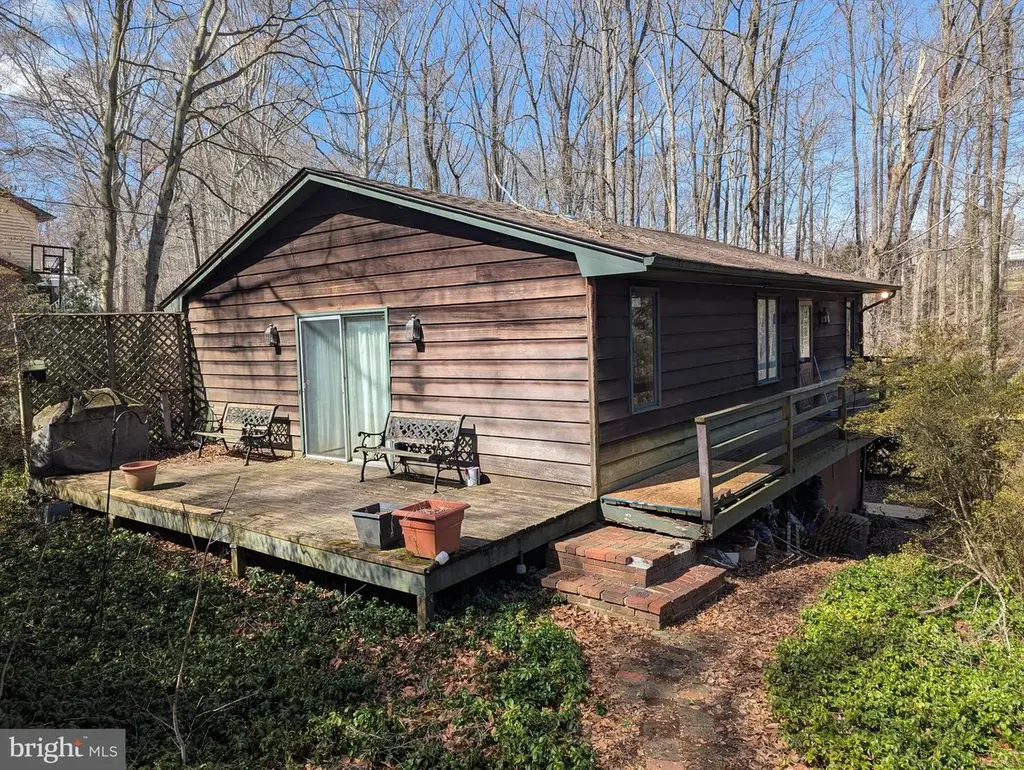
916 Ring Factory Rd · Bel Air South, MD
Flood risk 9/10 · Severe
- FEMA flood zone
- X (unshaded)
- Chance of flooding over 30 yrs
- 0.99%
- Est. flood insurance / yr
- $473 – $860
Fire risk 4/10 · Minor
- Est. fire insurance / yr
- $755 – $1,403
Heat risk 7/10 · Major
- Hot days now (above 106°F)
- 7 days/yr
- Hot days in 30 yrs
- 15 days/yr
Wind risk 5/10 · Moderate
- Chance of severe wind over 30 yrs
- 26.0%
Air-quality risk 4/10 · Minor
- Unhealthy air days now
- 5 days/yr
- Unhealthy air days in 30 yrs
- 7 days/yr
Risk factors via First Street. Map © Google.
Why this score? — see what drove the B- grade
The composite is a weighted blend of 9 inputs, each scored 0–100. Each bar is that input's sub-score; the figure is the points it added to the 100-point composite (weight × sub-score).
- Cash flow +30.0/30.0
- 1% rule +10.0/10.0
- DSCR +10.0/10.0
- ARV discount +7.5/15.0
- Livability +4.1/5.0
- Schools +2.9/10.0
- Rent growth +2.5/5.0
- Condition / age +2.5/5.0
- Appreciation +0.0/10.0
$125,000
🖨 Deal sheet 📄 Offer letter ✓ Due diligence
Listing remarks
$125,000. LIST PRICE SUGGESTED OPENING BID AT AUCTION. * * * * NO PRE BID * * * * AUCTION FRI, April 17th, 2026 @ 11:00 AM ON PREMISES. Broker/agent registration form is available upon request and must be in the hands of Jay Edwards Auctioneers 48 hours prior to the auction. Enter through side entrance to kitchen, equipped w/ an electric stove, dual sink, refrigerator, exhaust hood, recessed lighting, & ceiling fan. Adjoining dining & living room area w/ coat closet & sliding glass door exit to the front of the home. Main level also includes a full bathroom, hall linen closet, & (2) bedrooms, each w/ closet. Hardwood flooring throughout the main level. Lower le
Key facts
- Dual sink
- Ceiling fan
- Exhaust hood
Tags
Neighborhood map
What this means for you Summary
Snapshot
- This is a 3-bed/2.0-bath single-family listed at $125k.
Deal economics
- At list price, monthly cash flow is $980 ($12k/yr) — positive.
- The deal already cash-flows at list — no discount required.
- Meets the 1% rule at list price ($2k rent vs $125k).
- Recommended offer: $123k (1.5% below list) — sets the bar for market timing.
- Cap rate 16.2% vs local median 4.1% in Bel Air South — top-decile yield for the area; either an underpriced asset or a hidden risk that comps aren't pricing in. Stress-test before assuming the spread holds.
Location & tenants
- Location reads 82/100 on livability (#33 in MD, #1,172 nationally) — a professional / high-income tenant draw. Strengths: employment A+, housing A+, health & safety A+; Watch: crime D, cost of living D.
- Harford County Public Schools (suburban): math 22% / reading 39% proficiency, ranked #9 of 24 in MD (top 38%) — families likely to look elsewhere, expect single-tenant / working-renter base with shorter leases.
- Market conditions: 139 active listings in the ZIP; 2 comparable units currently listed for rent nearby; high-income renter base; 803 units permitted in Harford County in 2024 (26 in 5+ unit buildings).
Forward outlook
- Local home prices are declining (-3.0%/yr); year-one equity from $864 of loan paydown is wiped out by about $4k of value loss. Plan a longer hold.
- At projected returns (-3.0% appreciation + 3.0% rent growth), your $35k cash investment doubles in ~4 years — after that, you're playing with house money.
Negotiation context
- It's been on market 30 days — a 2% lower offer ($123k) is reasonable based on typical stale-listing flexibility.
Risks & watch-outs
- Watch-outs: flood insurance adds $56/mo.
- Climate carrying-cost: severe flood risk; moderate wind risk, 26% chance of damaging wind over 30y; extreme-heat days projected 7→15/yr by 2055 (HVAC capex compounding) — expect insurance premiums to compound above CPI over the hold.
Questions for the listing agent
- Built in 1971 — when were the roof, HVAC, electrical panel, plumbing, and water heater last replaced?
- What's the actual annual flood-insurance premium (NFIP or private), and is the property in a SFHA with mandatory coverage?
- Is there a deadline driving the sale (1031 exchange, divorce, estate, relocation)? That informs how much negotiation room exists.
- Schools are B-rated — typically a magnet for longer-tenancy family renters. What's the average tenant stay here, and is there a school-zone premium baked into asking?
- Crime grade is D in this area — have there been break-ins, vandalism, or insurance claims at this property in the last 3 years? What carrier currently insures it and at what premium?
- What's the average days-on-market for RENTAL listings here right now (not sales)? A rising rental-DOM trend means longer vacancies and softer asking-rent achievability than the comps imply.
- What's the recent tenant-quality profile in this submarket — average credit score on applications, eviction rate, late-payment / NSF rate, and stable-employment percentage? A property-management company in the area should have these aggregated.
- How much new for-sale + rental construction is in the pipeline within 1–3 miles? Heavy new supply typically softens prices + rents 12–24 months out; constrained supply supports both.
Investment metrics
- 1% rule
- 1.99% ✓
- Cap rate
- 16.23%
- Cash-on-cash
- 35.50%
- DSCR
- 2.58
- GRM
- 4.2
CMA / ARV
No comps found within radius.
Projected returns pro-forma
-3.0% appreciation · 3.0% rent growth · sell at horizon
- IRR
- 28.9%
- Equity multiple
- 2.21×
- Total profit
- $42,259
- Equity at exit
- $18,638
- IRR
- 36.3%
- Equity multiple
- 4.36×
- Total profit
- $117,600
- Equity at exit
- $10,808
Cash invested: $35,000 (down + closing). Projections, not guarantees.
Landlord ↔ Tenant lean methodology
- Overall (STATE)
- 27 Tenant-Leaning
- State Maryland
- 27 Tenant-Leaning · D+14
- County
- — inherits STATE
- City
- — inherits STATE
ZIP-level market 21085
- Active inventory
- 139
- Price-to-rent
- 4.2×
Monthly cashflow live
- Estimated rent
- $2,482 medium interval (Pro) →
- Mortgage (P&I)
- −$656
- Tax from tax record
- −$218 /mo · $2,618/yr
- Insurance
- −$52
- Flood insurance flood zone
- −$56 /mo · $666/yr
- HOA
- −$0
- Vacancy / Maint / Mgmt
- −$521
- Net cashflow
- $980
Break-even live
UW: 25.0% down · 7.5% · 30yr · 1.5% tax · 5.0% vac · 8.0% maint · 8.0% mgmt
Financing live
Cash to close
- Down payment
- $31,250
- Closing costs
- $3,750
- Reserves months
- —
- Total cash needed
- —
Loan-product check · same deal, 3 products live
Conventional
25% down · 7.5% · 30yr
- Down + closing
- —
- Monthly P&I
- —
- Monthly cashflow
- —
- DSCR
- —
- Eligible?
- —
Personal DTI + credit; lowest rate.
DSCR
20% down · 8.5% · 30yr
- Down + closing
- —
- Monthly P&I
- —
- Monthly cashflow
- —
- DSCR
- —
- Eligible?
- —
No personal income docs; deal must DSCR.
Hard money
10% down · 12.0% · 12mo
- Down + closing
- —
- Monthly P&I
- —
- Monthly cashflow
- —
- DSCR
- —
- Eligible?
- —
Short-term bridge; refi at stabilization.
Rent comps 2 comps
| Address | Beds | Baths | Sqft | Rent | $/sqft | DOM | Units | Dist |
|---|---|---|---|---|---|---|---|---|
| 442 Darby Ln Bel Air, MD | 4.0 | 3.5 | 1442 | $2,700 | $1.87 | 43d | 1 | 1.44mi |
| 644 Berwick Ct Abingdon, MD | 3.0 | 2.5 | 1500 | $2,395 | $1.60 | 43d | 1 | 1.50mi |
Listing history 2 events
-
2026-04-18status Pending
-
2026-03-19$125,000 Active
ⓘ Source: listings_history table (triggers on properties + properties_extension) + one-shot
backfill from property_details.listing_events for pre-trigger history.
Tax reassessment forecast MD · Partial reset (capped growth)
- Current annual tax
- $2,618 · $218/mo
- Projected year-2 tax
- $2,618 · $218/mo
- Expected delta
- $0/yr ($0/mo · 0.0%)
ⓘ Screening estimate from a state-policy table — verify with the county assessor before closing.
Climate risk First Street
- Flood 9/10 Extreme FEMA zone X (unshaded) · 99% chance over 30 yrs
- Wildfire 4/10 Moderate
- Heat 7/10 Severe 7 d/yr ≥106°F today · 15 d/yr by 30 yrs out
- Wind 5/10 Major 26% chance of damaging wind over 30 yrs
- Air quality 4/10 Moderate 5 unhealthy d/yr today · 7 by 30 yrs out
Nearby sold comps map
Loading sold comps map…
Walkable amenities ~0.75 mi
Loading nearby amenities…
Taxation est. · year 1
- Rental income
- $29,790
- − Mortgage interest
- −$7,002
- − Property taxes
- −$2,618
- − Insurance
- −$1,292
- − Repairs & maintenance
- −$2,383
- − Management
- −$2,383
- − Depreciation
- −$3,636
- Taxable income
- $10,475
- Est. tax owed @ 24.0%
- −$2,514
- After-tax cash flow
- $9,244/yr
For passive investors: Depreciation is non-cash, so a rental often shows a tax loss while cash-flowing — sheltering income. Rental losses are passive: they offset passive income freely, and up to $25,000/yr can offset ordinary (W-2) income if you actively participate and your MAGI is under $100k (phasing out to $0 by $150k); unused losses carry forward. On sale, claimed depreciation is recaptured at up to 25%, and gains may owe capital-gains tax (a 1031 exchange can defer both). Figures are a year-1 estimate at your 24.0% rate — not tax advice; consult a CPA.
Schools (NCES district)
- District
- Harford County Public Schools
- NCES district ID
- 2400390
- Math proficiency
- 22% ▼ -23.00%
- Reading proficiency
- 39% ▼ -12.00%
- Median HH income
- $79,569
- Composite
- 29.38/100
- National rank
- #6527
- State rank
- #9 of 24 in MD
Livability — Bel Air South
- Score
- 82/100
- State rank
- #33
- US rank
- #1172
Category grades
Schools grade is shown separately in the Schools card above.
Census & demographics
- County
- Harford County · 198,512 people
- City population
- 63,895
- Metro
- Baltimore-Columbia-Towson, MD
- Population (ZIP)
- 17,307
- Household income
- $113,714
- Rent vs Own
- Severe rent burden
- 357.0
Population outlook (Harford County) Hauer SSP2
- Today (2025)
- 262,292 people
- By 2030
- 266,437 · +1.6%
- By 2040
- 269,954 · +2.9%
- By 2050
- 265,659 · +1.3%
- By 2075
- 252,886 · -3.6%
- By 2100
- 224,014 · -14.6%
Race, ethnicity, and origin ACS 2023
- Neighborhood character
- Predominantly White (75%)
- Race & ethnicity
- White 75% Black 16% Two or more races 4% Hispanic / Latino 4% Asian 1%
- Common ancestry
- Romanian 7% Lithuanian 2% Slovak 1%
- Foreign-born
- 4% · Canada, Vietnam
- Languages at home
- 95% English-only · Spanish 3%
Political lean MEDSL · Harford
- 2024 margin
- R (+13.8) · D 41.9% · R 55.7% · Other 2.4%
- 2008→2024 swing
- +5.0pp toward D · 2008: -18.8pp · 2024: -13.8pp
- All cycles
- 2024: R+13.8 2020: R+12.0 2016: R+24.5 2012: R+19.5 2008: R+18.8
Not yet ingested
- Civics
- —
Market trends
- HPI YoY
- ▼ -304.04%
- Current HPI
- 231.5501
- Rent YoY
- —
- Metro
- Baltimore-Columbia-Towson, MD
- State GDP YoY
- ▲ 2.97%
- F500 in state
- 12
Industry mix (Fortune 500 HQ in MD)
| Industry | F500 HQs | Revenue |
|---|---|---|
| Aerospace / Defense | 1 | $71B |
|
||
| Utilities | 1 | $25B |
|
||
| Hotels | 1 | $24B |
|
||
| Consumer Goods | 1 | $7B |
|
||
| Real Estate | 1 | $6B |
|
||
| Chemicals | 1 | $2B |
|
||
Price history
2 events — show timeline
- 2026-04-18 Pending — BRIGHT MLS
- 2026-03-19 Listed $125,000 BRIGHT MLS
Property tax history
+1.1%/yrLatest (2023): $2,618 · +24.5% YoY. Source: county tax records.
Cash-flow waterfall
monthlySold comps — $/sqft
last 12 mo · ≤1 miLoading sold comps…