323 Pineapple St · Sebastian, FL
Flood risk 6/10 · Moderate
- FEMA flood zone
- X (unshaded)
- Chance of flooding over 30 yrs
- 0.74%
- Est. flood insurance / yr
- $507 – $1,088
Fire risk 3/10 · Minor
- Est. fire insurance / yr
- $947 – $1,759
Heat risk 10/10 · Severe
- Hot days now (above 105°F)
- 7 days/yr
- Hot days in 30 yrs
- 24 days/yr
Wind risk 10/10 · Severe
- Chance of severe wind over 30 yrs
- 99.0%
Air-quality risk 1/10 · Minimal
- Unhealthy air days now
- 0 days/yr
- Unhealthy air days in 30 yrs
- 0 days/yr
Risk factors via First Street. Map © Google.
Why this score? — see what drove the B+ grade
The composite is a weighted blend of 9 inputs, each scored 0–100. Each bar is that input's sub-score; the figure is the points it added to the 100-point composite (weight × sub-score).
- Cash flow +29.8/30.0
- ARV discount +15.0/15.0
- DSCR +10.0/10.0
- 1% rule +8.4/10.0
- Schools +4.2/10.0
- Rent growth +4.1/5.0
- Livability +4.0/5.0
- Condition / age +2.5/5.0
- Appreciation +0.0/10.0
$130,000
🖨 Deal sheet 📄 Offer letter ✓ Due diligence
Listing remarks
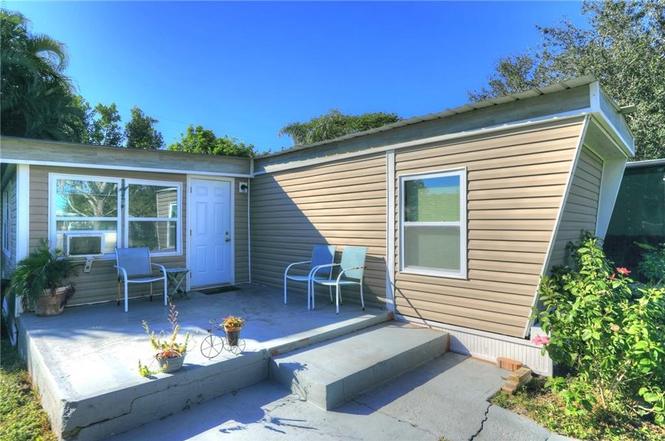
Affordable manufactured home in desirable Sebastian with NO HOA and no restrictions, making it ideal for investors or rental income. This 2-bedroom, 1-bath home sits on a larger cul-de-sac lot offering privacy and flexibility. Located just a stone’s throw from the Indian River, enjoy coastal breezes with nearby boating, fishing, and waterfront parks. Plenty of outdoor space with room to expand, personalize, or store a boat or RV. Close to dining, shopping, and local attractions.
Key facts
- Cul-de-sac lot
- Nearby boating
- Waterfront parks
Tags
Property features AI
Finance
- Financial info: Pets allowed
- HOA & community: No association (N/A)
Exterior
- Parking: Assigned parking; Additional parking; Driveway; Uncovered; Boat parking; RV access/parking; Two parking spaces
- Utilities: Public water; Public sewer
- Home design: Manufactured home; Single-story; Faces east
- Construction: Metal roof
- Exterior features: Patio; Shed(s); Has a view; Less than quarter acre lot
Interior
- Kitchen: Range; Refrigerator
- Bedrooms: Bedroom (10x12); Bedroom (9x9)
- Flooring: Laminate
- Bathrooms: 1 full bathroom
- Interior features: Sliding doors; Split bedrooms; Unfurnished
- Laundry & utility: Washer hookup; Dryer hookup
Neighborhood map
What this means for you Summary
Snapshot
- This is a 2-bed/1.0-bath manufactured listed at $130k.
Deal economics
- At list price, monthly cash flow is $479 ($6k/yr) — positive.
- The deal already cash-flows at list — no discount required.
- Meets the 1% rule at list price ($2k rent vs $130k).
- Recommended offer: $114k (12.0% below list) — sets the bar for market timing.
- Cap rate 10.7% vs local median 4.4% in Sebastian — top-decile yield for the area; either an underpriced asset or a hidden risk that comps aren't pricing in. Stress-test before assuming the spread holds.
Location & tenants
- Location reads 81/100 on livability (#89 in FL, #1,421 nationally) — a professional / high-income tenant draw. Strengths: housing A+, crime A, health & safety A; Watch: schools D+, amenities D-.
- Indian River (other): math 48% / reading 52% proficiency, ranked #35 of 73 in FL (top 48%) — acceptable for families but not a draw, mixed tenant base, ~2y average lease.
- Market conditions: Rents rising fast (+6.2%/yr); 412 active listings in the ZIP; 6 comparable units currently listed for rent nearby; rentals at typical pace (median 21d on market — plan ~3-4 weeks tenant-placement turnaround); 564 units permitted in Indian River County in 2024 (281 in 5+ unit buildings).
- This rent runs 31% of the median local income ($67k/yr) — at the standard rent-burdened threshold; future hikes will face affordability resistance.
Forward outlook
- Local home prices are declining (-3.0%/yr); year-one equity from $899 of loan paydown is wiped out by about $4k of value loss. Plan a longer hold.
- Indian River County population projected at +18% by 2050 — long-run rental-demand tailwind backs the buy-and-hold thesis.
- At projected returns (-3.0% appreciation + 6.2% rent growth), your $36k cash investment doubles in ~7 years — after that, you're playing with house money.
Negotiation context
- It's been on market 126 days — a 12% lower offer ($114k) is reasonable based on typical stale-listing flexibility.
- 2 sale attempts since 2y ago; this cycle's ask has dropped $10k (7%) from the opening price — seller is motivated, your offer sets the floor, not the list.
- Current owner paid $50k; list at $130k implies a 160% gain — meaningful room to come down on a strong offer.
Risks & watch-outs
- Climate carrying-cost: major flood risk; severe wind risk, 99% chance of damaging wind over 30y; extreme-heat days projected 7→24/yr by 2055 (HVAC capex compounding) — expect insurance premiums to compound above CPI over the hold.
Questions for the listing agent
- It's been on market 126 days. Have you received any prior offers? Is the seller open to a 12% concession, seller financing, or rate buy-down credit?
- Built in 1962 — when were the roof, HVAC, electrical panel, plumbing, and water heater last replaced?
- Why hasn't it sold? Are there any deal-killer items the seller is aware of (foundation, flood, title, zoning, code violations)?
- Is there a deadline driving the sale (1031 exchange, divorce, estate, relocation)? That informs how much negotiation room exists.
- Schools are D-rated, which usually means shorter tenancies and higher turnover. Who's the typical renter profile here, and what's been the actual vacancy rate?
- What's the average days-on-market for RENTAL listings here right now (not sales)? A rising rental-DOM trend means longer vacancies and softer asking-rent achievability than the comps imply.
- What's the recent tenant-quality profile in this submarket — average credit score on applications, eviction rate, late-payment / NSF rate, and stable-employment percentage? A property-management company in the area should have these aggregated.
- How much new for-sale + rental construction is in the pipeline within 1–3 miles? Heavy new supply typically softens prices + rents 12–24 months out; constrained supply supports both.
Investment metrics
- 1% rule
- 1.34% ✓
- Cap rate
- 10.71%
- Cash-on-cash
- 15.78%
- DSCR
- 1.70
- GRM
- 6.2
CMA / ARV
- ARV (on-the-fly)
- $169,280
- Comps found
- 1
Show comp detail 1 sale within ~0.75 mi
| Address | Dist | Beds/Ba | Sqft | Sold | Price | $/sf | Match |
|---|---|---|---|---|---|---|---|
| 319 Valencia St | 0.06mi | 2/1.0 | 896 (-3%) | 24mo | $165,000 | $184 | 73 |
Match score weights: distance 35% · size 25% · config 20% · recency 20%. Top-matched comps best support the ARV.
Projected returns pro-forma
-3.0% appreciation · 6.22% rent growth · sell at horizon
- IRR
- 10.2%
- Equity multiple
- 1.42×
- Total profit
- $15,257
- Equity at exit
- $19,383
- IRR
- 21.8%
- Equity multiple
- 3.15×
- Total profit
- $78,137
- Equity at exit
- $11,240
Cash invested: $36,400 (down + closing). Projections, not guarantees.
Landlord ↔ Tenant lean methodology
- Overall (STATE)
- 87 Strongly Landlord-Friendly
- State Florida
- 87 Strongly Landlord-Friendly · R+3
- County
- — inherits STATE
- City
- — inherits STATE
ZIP-level market 32958
- Home prices YoY
- -13.1%
- Rents YoY
- 6.2%
- Active inventory
- 412
- Price-to-rent
- 6.2×
Monthly cashflow live
- Estimated rent
- $1,739 high interval (Pro) →
- Mortgage (P&I)
- −$682
- Tax from tax record
- −$160 /mo · $1,915/yr
- Insurance
- −$54
- HOA
- −$0
- Vacancy / Maint / Mgmt
- −$365
- Net cashflow
- $479
Break-even live
UW: 25.0% down · 7.5% · 30yr · 1.5% tax · 5.0% vac · 8.0% maint · 8.0% mgmt
Financing live
Cash to close
- Down payment
- $32,500
- Closing costs
- $3,900
- Reserves months
- —
- Total cash needed
- —
Loan-product check · same deal, 3 products live
Conventional
25% down · 7.5% · 30yr
- Down + closing
- —
- Monthly P&I
- —
- Monthly cashflow
- —
- DSCR
- —
- Eligible?
- —
Personal DTI + credit; lowest rate.
DSCR
20% down · 8.5% · 30yr
- Down + closing
- —
- Monthly P&I
- —
- Monthly cashflow
- —
- DSCR
- —
- Eligible?
- —
No personal income docs; deal must DSCR.
Hard money
10% down · 12.0% · 12mo
- Down + closing
- —
- Monthly P&I
- —
- Monthly cashflow
- —
- DSCR
- —
- Eligible?
- —
Short-term bridge; refi at stabilization.
Rent comps 6 comps
| Address | Beds | Baths | Sqft | Rent | $/sqft | DOM | Units | Dist |
|---|---|---|---|---|---|---|---|---|
| 950 Louisiana Ave Sebastian, FL | 2.0 | 1.5 | 990 | $1,550 | $1.57 | 21d | 1 | 0.31mi |
| 426 Easy St Sebastian, FL | 1.0 | 1.0 | 600 | $1,400 | $2.33 | 21d | 1 | 0.64mi |
| 362 Del Monte Rd Unit A Sebastian, FL | 2.0 | 2.0 | 1045 | $1,600 | $1.53 | 21d | 1 | 0.91mi |
| 371 Keen Ter Unit A Sebastian, FL | 2.0 | 2.0 | 1037 | $1,650 | $1.59 | 21d | 1 | 1.02mi |
| 449 Del Monte Rd Unit A Sebastian, FL | 2.0 | 1.0 | 840 | $1,750 | $2.08 | 21d | 1 | 1.07mi |
| 586 Gerald St Sebastian, FL | 3.0 | 3.0 | 936 | $1,600 | $1.71 | 13d | 1 | 1.20mi |
Listing history 9 events
-
2026-05-12status Pending
-
2026-04-15price $130,000
-
2026-01-06$140,000 Active
-
2025-10-25price $150,000
-
2025-07-28price $159,000
-
2025-05-27price $164,000
-
2025-01-24price $169,000
-
2024-12-19$175,000 Active
-
2007-01-22soldstatus $50,000
ⓘ Source: listings_history table (triggers on properties + properties_extension) + one-shot
backfill from property_details.listing_events for pre-trigger history.
Tax reassessment forecast FL · Resets to sale price
- Current annual tax
- $1,915 · $160/mo
- Projected year-2 tax
- $1,915 · $160/mo
- Expected delta
- $0/yr ($0/mo · 0.0%)
ⓘ Screening estimate from a state-policy table — verify with the county assessor before closing.
Climate risk First Street
- Flood 6/10 Major FEMA zone X (unshaded) · 74% chance over 30 yrs
- Wildfire 3/10 Moderate
- Heat 10/10 Extreme 7 d/yr ≥105°F today · 24 d/yr by 30 yrs out
- Wind 10/10 Extreme 99% chance of damaging wind over 30 yrs
- Air quality 1/10 Low 0 unhealthy d/yr today · 0 by 30 yrs out
Nearby sold comps map
Loading sold comps map…
Walkable amenities ~0.75 mi
Loading nearby amenities…
Taxation est. · year 1
- Rental income
- $20,872
- − Mortgage interest
- −$7,282
- − Property taxes
- −$1,915
- − Insurance
- −$650
- − Repairs & maintenance
- −$1,670
- − Management
- −$1,670
- − Depreciation
- −$3,782
- Taxable income
- $3,903
- Est. tax owed @ 24.0%
- −$937
- After-tax cash flow
- $4,806/yr
For passive investors: Depreciation is non-cash, so a rental often shows a tax loss while cash-flowing — sheltering income. Rental losses are passive: they offset passive income freely, and up to $25,000/yr can offset ordinary (W-2) income if you actively participate and your MAGI is under $100k (phasing out to $0 by $150k); unused losses carry forward. On sale, claimed depreciation is recaptured at up to 25%, and gains may owe capital-gains tax (a 1031 exchange can defer both). Figures are a year-1 estimate at your 24.0% rate — not tax advice; consult a CPA.
Schools (NCES district)
- District
- Indian River
- NCES district ID
- 1200930
- Math proficiency
- 48% ▼ -9.00%
- Reading proficiency
- 52% ▼ -3.00%
- Median HH income
- $46,597
- Composite
- 42.45/100
- National rank
- #3218
- State rank
- #35 of 73 in FL
Livability — Sebastian
- Score
- 81/100
- State rank
- #89
- US rank
- #1421
Category grades
Schools grade is shown separately in the Schools card above.
Census & demographics
- Census place
- Sebastian, FL
- County
- Indian River County · 143,738 people
- City population
- 30,023
- Metro
- Sebastian-Vero Beach, FL
- Population (ZIP)
- 30,023
- Household income
- $66,840
- Rent vs Own
- Severe rent burden
- 646.0
Population outlook (Indian River County) Hauer SSP2
- Today (2025)
- 165,104 people
- By 2030
- 172,869 · +4.7%
- By 2040
- 185,640 · +12.4%
- By 2050
- 194,465 · +17.8%
- By 2075
- 211,115 · +27.9%
- By 2100
- 211,781 · +28.3%
Race, ethnicity, and origin ACS 2023
- Neighborhood character
- Predominantly White (86%)
- Race & ethnicity
- White 86% Hispanic / Latino 9% Two or more races 7% Black 2% Asian 1%
- Hispanic origin (detail)
- Mexican 1% Puerto Rican 2% Cuban 3%
- Common ancestry
- Lithuanian 4% Slovak 4% Romanian 3%
- Foreign-born
- 7% · Canada, Jamaica
- Languages at home
- 91% English-only · Spanish 6% Other Indo-European 1% Russian/Polish/Slavic 1%
Political lean MEDSL · Indian River
- 2024 margin
- Strong R (+27.4) · D 36.0% · R 63.4%
- 2008→2024 swing
- -12.5pp toward R · 2008: -14.8pp · 2024: -27.4pp
- All cycles
- 2024: R+27.4 2020: R+21.6 2016: R+24.5 2012: R+22.3 2008: R+14.8
Not yet ingested
- Civics
- —
Market trends
- HPI YoY
- ▼ -49.85%
- Current HPI
- 330.1691
- Rent YoY
- ▲ 6.22%
- Metro
- Sebastian-Vero Beach, FL
- State GDP YoY
- ▲ 3.28%
- F500 in state
- 36
Industry mix (Fortune 500 HQ in FL)
| Industry | F500 HQs | Revenue |
|---|---|---|
| Industrial Technology | 2 | $29B |
|
||
| Insurance | 2 | $17B |
|
||
| Retail | 1 | $60B |
|
||
| Technology Distribution | 1 | $58B |
|
||
| Homebuilding | 1 | $35B |
|
||
| Technology Manufacturing | 1 | $35B |
|
||
Price history
+160.0% since first listed9 events — show timeline
- 2026-05-12 Pending — RAIRCMLS
- 2026-04-15 Price Changed $130,000 RAIRCMLS
- 2026-01-06 Listed $140,000 RAIRCMLS
- 2025-10-25 Price Changed $150,000 RAIRCMLS
- 2025-07-28 Price Changed $159,000 RAIRCMLS
- 2025-05-27 Price Changed $164,000 RAIRCMLS
- 2025-01-24 Price Changed $169,000 RAIRCMLS
- 2024-12-19 Listed $175,000 RAIRCMLS
- 2007-01-22 Sold (Public Records) $50,000 Public Records
Property tax history
+8.9%/yrLatest (2025): $1,915 · +5.5% YoY. Source: county tax records.
Cash-flow waterfall
monthlySold comps — $/sqft
last 12 mo · ≤1 miLoading sold comps…