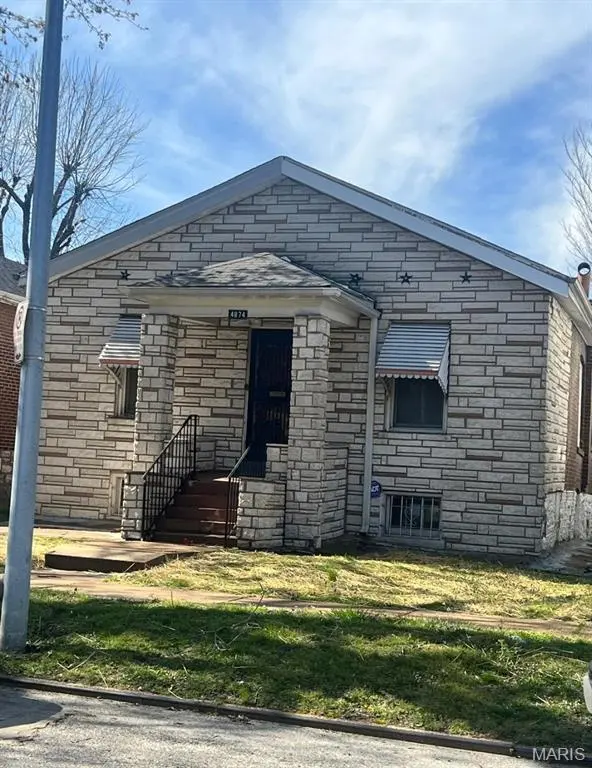
4874 Margaretta Ave · St. Louis, MO
Flood risk 1/10 · Minimal
- FEMA flood zone
- X (unshaded)
- Chance of flooding over 30 yrs
- 0.0%
- Est. flood insurance / yr
- $473 – $860
Fire risk 1/10 · Minimal
- Est. fire insurance / yr
- $1,054 – $1,958
Heat risk 5/10 · Moderate
- Hot days now (above 107°F)
- 7 days/yr
- Hot days in 30 yrs
- 21 days/yr
Wind risk 2/10 · Minimal
- Chance of severe wind over 30 yrs
- 1.0%
Air-quality risk 4/10 · Minor
- Unhealthy air days now
- 5 days/yr
- Unhealthy air days in 30 yrs
- 6 days/yr
Risk factors via First Street. Map © Google.
Why this score? — see what drove the B+ grade
The composite is a weighted blend of 9 inputs, each scored 0–100. Each bar is that input's sub-score; the figure is the points it added to the 100-point composite (weight × sub-score).
- Cash flow +30.0/30.0
- ARV discount +15.0/15.0
- 1% rule +10.0/10.0
- DSCR +10.0/10.0
- Appreciation +3.3/10.0
- Rent growth +2.5/5.0
- Livability +2.5/5.0
- Condition / age +2.5/5.0
- Schools +1.2/10.0
$39,900
🖨 Deal sheet 📄 Offer letter ✓ Due diligence
Listing remarks MLS
Great investment opportunity to add to your portfolio. This home has been well maintained and recently updated. Immediate flow, renting at $1100 a month. No showings without an accepted contract.
Key facts
- 4,517 sq ft lot
- Built 1923
- Listed 50 days
Neighborhood map
What this means for you Summary
Snapshot
- This is a 2-bed/1.0-bath single-family listed at $40k.
Deal economics
- At list price, monthly cash flow is $587 ($7k/yr) — positive.
- The deal already cash-flows at list — no discount required.
- Meets the 1% rule at list price ($1k rent vs $40k).
- Recommended offer: $39k (3.0% below list) — sets the bar for market timing.
- Cap rate 23.9% vs local median 5.0% in St. Louis — top-decile yield for the area; either an underpriced asset or a hidden risk that comps aren't pricing in. Stress-test before assuming the spread holds.
Location & tenants
- Location reads: area grade B — affects rentability + tenant quality, not the cash-flow math above.
- St. Louis City (urban): math 10% / reading 18% proficiency, ranked #312 of 324 in MO (top 96%) — low school quality limits family demand, transient renter base, plan for 1-2y turnover; 80% free/reduced lunch — lower-income household profile, screen leases tightly.
- Market conditions: 97 active listings in the ZIP; 24 comparable units currently listed for rent nearby; rentals at typical pace (median 24d on market — plan ~3-4 weeks tenant-placement turnaround); 46% of comp listings sitting > 30 days — soft ceiling on asking rent; lower-income renter base — watch delinquency; 294 units permitted in St. Louis city in 2024 (227 in 5+ unit buildings).
- This rent runs 42% of the median local income ($31k/yr) — at the standard rent-burdened threshold; future hikes will face affordability resistance.
Forward outlook
- Local home prices are declining (-3.0%/yr); year-one equity from $276 of loan paydown is wiped out by about $1k of value loss. Plan a longer hold.
- St. Louis County population projected to shrink 6% by 2050 — rents likely to lag national; underwrite the cash flow, not the appreciation.
- At projected returns (-3.0% appreciation + 3.0% rent growth), your $11k cash investment doubles in ~2 years — after that, you're playing with house money.
Negotiation context
- It's been on market 50 days — a 3% lower offer ($39k) is reasonable based on typical stale-listing flexibility.
- 5 sale attempts since 2y ago; this cycle's ask has dropped $35k (47%) from the opening price — seller is motivated, your offer sets the floor, not the list.
- Current owner paid $22k; list at $40k implies a 81% gain — meaningful room to come down on a strong offer.
Risks & watch-outs
- Watch-outs: built in 1923 — expect roof / HVAC / electrical / plumbing capex.
- Climate carrying-cost: extreme-heat days projected 7→21/yr by 2055 (HVAC capex compounding) — expect insurance premiums to compound above CPI over the hold.
Questions for the listing agent
- It's been on market 50 days. Have you received any prior offers? Is the seller open to a 3% concession, seller financing, or rate buy-down credit?
- Built in 1923 — when were the roof, HVAC, electrical panel, plumbing, and water heater last replaced?
- Is there a deadline driving the sale (1031 exchange, divorce, estate, relocation)? That informs how much negotiation room exists.
- What's the average days-on-market for RENTAL listings here right now (not sales)? A rising rental-DOM trend means longer vacancies and softer asking-rent achievability than the comps imply.
- What's the recent tenant-quality profile in this submarket — average credit score on applications, eviction rate, late-payment / NSF rate, and stable-employment percentage? A property-management company in the area should have these aggregated.
- How much new for-sale + rental construction is in the pipeline within 1–3 miles? Heavy new supply typically softens prices + rents 12–24 months out; constrained supply supports both.
Investment metrics
- 1% rule
- 2.66% ✓
- Cap rate
- 23.94%
- Cash-on-cash
- 63.04%
- DSCR
- 3.80
- GRM
- 3.1
CMA / ARV
- ARV (median comp)
- $52,718
- List price
- $39,900
- Delta
- -24.31%
- Verdict
- UNDERPRICED
- Comps
- 20 within 1.0 mi
Show comp detail 12 sales within ~0.75 mi
| Address | Dist | Beds/Ba | Sqft | Sold | Price | $/sf | Match |
|---|---|---|---|---|---|---|---|
| 4843 Lee Ave | 0.22mi | 3/1.0 (+1) | 1,170 (-5%) | 2mo | $71,500 | $61 | 75 |
| 4853 Lee Ave | 0.22mi | 2/1.0 | 1,092 (-11%) | 3mo | $29,900 | $27 | 69 |
| 4941 Lexington Ave | 0.32mi | 3/2.0 (+1) | 1,240 (+1%) | 11mo | $124,900 | $101 | 66 |
| 4430 Sexauer Ave | 0.58mi | 2/1.0 | 1,212 (-2%) | 6mo | $64,500 | $53 | 65 |
| 4814 Calvin Ave | 0.44mi | 3/1.0 (+1) | 1,257 (+2%) | 8mo | $20,000 | $16 | 64 |
| 4533 Lexington Ave | 0.53mi | 3/1.0 (+1) | 1,175 (-5%) | 3mo | $105,900 | $90 | 60 |
| 4416 San Francisco Ave | 0.69mi | 2/1.5 | 1,167 (-5%) | 6mo | $29,900 | $26 | 52 |
| 4514 Bircher Blvd | 0.74mi | 3/2.0 (+1) | 1,222 (-1%) | 4mo | $30,000 | $25 | 52 |
| 4400 San Francisco Ave | 0.72mi | 2/1.0 | 1,167 (-5%) | 8mo | $7,000 | $6 | 51 |
| 4472 Natural Bridge Ave | 0.60mi | 2/1.0 | 1,338 (+9%) | 9mo | $25,000 | $19 | 50 |
| 4610 Penrose St | 0.48mi | 3/1.5 (+1) | 1,053 (-14%) | 3mo | $80,000 | $76 | 44 |
| 4627 Korte Ave | 0.69mi | 3/1.0 (+1) | 1,072 (-13%) | 2mo | $18,100 | $17 | 40 |
Match score weights: distance 35% · size 25% · config 20% · recency 20%. Top-matched comps best support the ARV.
Projected returns pro-forma
-3.0% appreciation · 3.0% rent growth · sell at horizon
- IRR
- 62.0%
- Equity multiple
- 3.77×
- Total profit
- $30,914
- Equity at exit
- $5,949
- IRR
- 66.6%
- Equity multiple
- 7.72×
- Total profit
- $75,055
- Equity at exit
- $3,450
Cash invested: $11,172 (down + closing). Projections, not guarantees.
Landlord ↔ Tenant lean methodology
- Overall (STATE)
- 81 Strongly Landlord-Friendly
- State Missouri
- 81 Strongly Landlord-Friendly · R+10
- County
- — inherits STATE
- City
- — inherits STATE
ZIP-level market 63115
- Home prices YoY
- -2.6%
- Active inventory
- 97
- Price-to-rent
- 3.1×
Monthly cashflow live
- Estimated rent
- $1,062 high interval (Pro) →
- Mortgage (P&I)
- −$209
- Tax from tax record
- −$26 /mo · $314/yr
- Insurance
- −$17
- HOA
- −$0
- Vacancy / Maint / Mgmt
- −$223
- Net cashflow
- $587
Break-even live
UW: 25.0% down · 7.5% · 30yr · 1.5% tax · 5.0% vac · 8.0% maint · 8.0% mgmt
Financing live
Cash to close
- Down payment
- $9,975
- Closing costs
- $1,197
- Reserves months
- —
- Total cash needed
- —
Loan-product check · same deal, 3 products live
Conventional
25% down · 7.5% · 30yr
- Down + closing
- —
- Monthly P&I
- —
- Monthly cashflow
- —
- DSCR
- —
- Eligible?
- —
Personal DTI + credit; lowest rate.
DSCR
20% down · 8.5% · 30yr
- Down + closing
- —
- Monthly P&I
- —
- Monthly cashflow
- —
- DSCR
- —
- Eligible?
- —
No personal income docs; deal must DSCR.
Hard money
10% down · 12.0% · 12mo
- Down + closing
- —
- Monthly P&I
- —
- Monthly cashflow
- —
- DSCR
- —
- Eligible?
- —
Short-term bridge; refi at stabilization.
Rent comps 24 comps
| Address | Beds | Baths | Sqft | Rent | $/sqft | DOM | Units | Dist |
|---|---|---|---|---|---|---|---|---|
| 4040 Shreve Ave Saint Louis, MO | 3.0 | 1.0 | 1201 | $1,250 | $1.04 | 44d | 1 | 0.21mi |
| 4642 Farlin Ave Unit 1F St. Louis, MO | 2.0 | 1.0 | 1056 | $800 | $0.76 | 44d | 1 | 0.36mi |
| 4847 Calvin Ave Saint Louis, MO | 3.0 | 2.0 | 1000 | $1,473 | $1.47 | 2d | 1 | 0.47mi |
| 4497 Lee Ave Saint Louis, MO | 3.0 | 2.0 | 1012 | $1,000 | $0.99 | 16d | 1 | 0.58mi |
| 4493 Bessie Ave Saint Louis, MO | 3.0 | 1.0 | 880 | $1,250 | $1.42 | 44d | 1 | 0.66mi |
| 4627 Maffitt Ave Saint Louis, MO | 2.0 | 1.0 | 704 | $795 | $1.13 | 44d | 1 | 0.75mi |
| 4919 Thekla Ave Saint Louis, MO | 2.0 | 1.0 | 931 | $700 | $0.75 | 44d | 1 | 0.79mi |
| 4460 Bircher Blvd Saint Louis, MO | 1.0 | 1.0 | 1100 | $725 | $0.66 | 10d | 1 | 0.88mi |
| 2831 Abner Pl Unit 7 St. Louis, MO | 2.0 | 1.0 | 968 | $1,250 | $1.29 | 23d | 1 | 0.96mi |
| 4426 Holly Ave Unit B St. Louis, MO | 2.0 | 1.0 | 1000 | $1,100 | $1.10 | 14d | 1 | 1.05mi |
| 4223 Red Bud Ave Unit 1F St. Louis, MO | 2.0 | 1.0 | 1167 | $895 | $0.77 | 44d | 1 | 1.07mi |
| 4908 W Florissant Ave Apt A St. Louis, MO | 1.0 | 1.0 | 750 | $695 | $0.93 | 44d | 1 | 1.08mi |
| 5338 Claxton Ave Unit 33 St. Louis, MO | 3.0 | 2.0 | 1196 | $1,550 | $1.30 | 44d | 1 | 1.12mi |
| 1965 Arlington Ave Saint Louis, MO | 3.0 | 1.0 | 980 | $1,300 | $1.33 | 4d | 1 | 1.21mi |
| 5333 Patton Ave St. Louis, MO | 3.0 | 1.5 | 1262 | $1,250 | $0.99 | 44d | 1 | 1.26mi |
| 4715 Thrush Ave Unit 24 St. Louis, MO | 2.0 | 1.0 | 900 | $1,350 | $1.50 | 23d | 1 | 1.29mi |
| 4914 Plover Ave Saint Louis, MO | 3.0 | 2.0 | 1248 | $925 | $0.74 | 23d | 1 | 1.35mi |
| 4719 Plover Ave Saint Louis, MO | 2.0 | 1.0 | 744 | $995 | $1.34 | 4d | 1 | 1.35mi |
| 5662 Maffitt Ave Saint Louis, MO | 2.0 | 1.0 | 850 | $895 | $1.05 | 7d | 1 | 1.44mi |
| 1232 N Euclid Ave Saint Louis, MO | 3.0 | 1.5 | 982 | $1,395 | $1.42 | 44d | 1 | 1.44mi |
| 5608 Wabada Ave Saint Louis, MO | 2.0 | 1.0 | 910 | $1,300 | $1.43 | 16d | 1 | 1.45mi |
| 2603 Belle Glade Ave Saint Louis, MO | 2.0 | 1.0 | 945 | $800 | $0.85 | 4d | 1 | 1.46mi |
| 5345 Wells Ave Unit 2ND St. Louis, MO | 3.0 | 1.0 | 1127 | $1,095 | $0.97 | 23d | 1 | 1.48mi |
| 1420 Union Blvd Unit 2F St. Louis, MO | 2.0 | 1.0 | 1096 | $995 | $0.91 | 44d | 1 | 1.50mi |
Listing history 21 events
-
2026-06-13status $39,900 Pending 50 DOM
-
2026-06-09days on market $39,900 Active 50 DOM
-
2026-06-08days on market $39,900 Active 49 DOM
-
2026-06-07days on market $39,900 Active 48 DOM
-
2026-06-05days on market $39,900 Active 45 DOM
-
2026-06-03days on market $39,900 Active 44 DOM
-
2026-06-02days on market $39,900 Active 43 DOM
-
2026-06-01days on market $39,900 Active 42 DOM
-
2026-05-31days on market $39,900 Active 41 DOM
-
2026-04-20$74,900 Active 196-char remark
Show marketing remark (196 chars)
Great investment opportunity to add to your portfolio. This home has been well maintained and recently updated. Immediate flow, renting at $1100 a month. No showings without an accepted contract.
-
2026-04-20historical $74,900 196-char remark
Show marketing remark (196 chars)
Great investment opportunity to add to your portfolio. This home has been well maintained and recently updated. Immediate flow, renting at $1100 a month. No showings without an accepted contract.
-
2025-09-10status Active
-
2025-09-10price $49,000
-
2025-07-02status Pending
-
2025-06-13$55,000 Active
-
2024-12-01historical
-
2024-11-05status Active
-
2024-10-23status Pending
-
2024-10-02$65,000 Active
-
2020-09-15soldstatus $22,000
-
2001-09-27soldstatus
ⓘ Source: listings_history table (triggers on properties + properties_extension) + one-shot
backfill from property_details.listing_events for pre-trigger history.
Tax reassessment forecast MO · Resets to sale price
- Current annual tax
- $314 · $26/mo
- Projected year-2 tax
- $387 · $32/mo
- Expected delta
- +$73/yr (+$6/mo · 23.1%)
ⓘ Screening estimate from a state-policy table — verify with the county assessor before closing.
Climate risk First Street
- Flood 1/10 Low FEMA zone X (unshaded) · 0% chance over 30 yrs
- Wildfire 1/10 Low
- Heat 5/10 Major 7 d/yr ≥107°F today · 21 d/yr by 30 yrs out
- Wind 2/10 Low 100% chance of damaging wind over 30 yrs
- Air quality 4/10 Moderate 5 unhealthy d/yr today · 6 by 30 yrs out
Nearby sold comps map
Loading sold comps map…
Walkable amenities ~0.75 mi
Loading nearby amenities…
Taxation est. · year 1
- Rental income
- $12,743
- − Mortgage interest
- −$2,235
- − Property taxes
- −$314
- − Insurance
- −$200
- − Repairs & maintenance
- −$1,019
- − Management
- −$1,019
- − Depreciation
- −$1,161
- Taxable income
- $6,795
- Est. tax owed @ 24.0%
- −$1,631
- After-tax cash flow
- $5,412/yr
For passive investors: Depreciation is non-cash, so a rental often shows a tax loss while cash-flowing — sheltering income. Rental losses are passive: they offset passive income freely, and up to $25,000/yr can offset ordinary (W-2) income if you actively participate and your MAGI is under $100k (phasing out to $0 by $150k); unused losses carry forward. On sale, claimed depreciation is recaptured at up to 25%, and gains may owe capital-gains tax (a 1031 exchange can defer both). Figures are a year-1 estimate at your 24.0% rate — not tax advice; consult a CPA.
Schools (NCES district)
- District
- St. Louis City
- NCES district ID
- 2929280
- Math proficiency
- 10% ▼ -6.00%
- Reading proficiency
- 18% ▼ -3.00%
- Median HH income
- $35,685
- Composite
- 11.54/100
- National rank
- #9699
- State rank
- #312 of 324 in MO
Livability — St. Louis
No livability data for this city. (Only ~50 U.S. cities are tracked.)
Census & demographics
- Census place
- St. Louis, MO
- County
- Saint Louis City · 254,015 people
- City population
- 283,259
- Metro
- St. Louis, MO-IL
- Population (ZIP)
- 14,488
- Household income
- $30,622
- Rent vs Own
- Severe rent burden
- 1655.0
Population outlook (St. Louis County) Hauer SSP2
- Today (2025)
- 315,737 people
- By 2030
- 313,865 · -0.6%
- By 2040
- 305,439 · -3.3%
- By 2050
- 296,529 · -6.1%
- By 2075
- 271,028 · -14.2%
- By 2100
- 255,359 · -19.1%
Race, ethnicity, and origin ACS 2023
- Neighborhood character
- Predominantly Black (95%)
- Race & ethnicity
- Black 95% White 2% Two or more races 2%
- Foreign-born
- 0%
Political lean MEDSL · St. Louis
- 2024 margin
- Solid D (+64.7) · D 81.4% · R 16.7% · Other 2.0%
- 2008→2024 swing
- -3.5pp toward R · 2008: 68.2pp · 2024: 64.7pp
- All cycles
- 2024: D+64.7 2020: D+66.2 2016: D+63.7 2012: D+66.6 2008: D+68.2
Not yet ingested
- Civics
- —
Market trends
- HPI YoY
- ▼ -3.42%
- Current HPI
- 127.3403
- Rent YoY
- —
- Metro
- St. Louis, MO-IL
- State GDP YoY
- ▲ 1.84%
- F500 in state
- 20
Industry mix (Fortune 500 HQ in MO)
| Industry | F500 HQs | Revenue |
|---|---|---|
| Healthcare | 1 | $163B |
|
||
| Insurance | 1 | $21B |
|
||
| Industrial Technology | 1 | $17B |
|
||
| Retail | 1 | $16B |
|
||
| Industrial Distribution | 1 | $10B |
|
||
| Utilities | 1 | $9B |
|
||
Price history
+240.5% since first listed12 events — show timeline
- 2026-04-20 Listed $74,900 MARIS as Distributed by MLS Grid
- 2026-04-20 Coming Soon $74,900 MARIS as Distributed by MLS Grid
- 2025-09-10 Relisted — MARIS as Distributed by MLS Grid
- 2025-09-10 Price Changed $49,000 MARIS as Distributed by MLS Grid
- 2025-07-02 Pending — MARIS as Distributed by MLS Grid
- 2025-06-13 Listed $55,000 MARIS as Distributed by MLS Grid
- 2024-12-01 Delisted — MARIS as Distributed by MLS Grid
- 2024-11-05 Relisted — MARIS as Distributed by MLS Grid
- 2024-10-23 Pending — MARIS as Distributed by MLS Grid
- 2024-10-02 Listed $65,000 MARIS as Distributed by MLS Grid
- 2020-09-15 Sold (Public Records) $22,000 Public Records
- 2001-09-27 Sold (Public Records) — Public Records
Property tax history
-2.7%/yrLatest (2024): $314 · +4.7% YoY. Source: county tax records.
Cash-flow waterfall
monthlySold comps — $/sqft
last 12 mo · ≤1 miLoading sold comps…