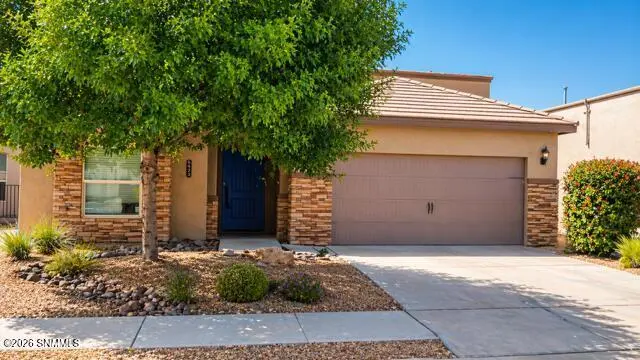
3664 W Maya Ct · Las Cruces, NM
Flood risk 1/10 · Minimal
- FEMA flood zone
- X (unshaded)
- Chance of flooding over 30 yrs
- 0.0%
- Est. flood insurance / yr
- $507 – $1,088
Fire risk 4/10 · Minor
- Est. fire insurance / yr
- $706 – $1,312
Heat risk 5/10 · Moderate
- Hot days now (above 98°F)
- 5 days/yr
- Hot days in 30 yrs
- 18 days/yr
Wind risk 1/10 · Minimal
- Chance of severe wind over 30 yrs
- —
Air-quality risk 1/10 · Minimal
- Unhealthy air days now
- 0 days/yr
- Unhealthy air days in 30 yrs
- 0 days/yr
Risk factors via First Street. Map © Google.
Why this score? — see what drove the D- grade
The composite is a weighted blend of 9 inputs, each scored 0–100. Each bar is that input's sub-score; the figure is the points it added to the 100-point composite (weight × sub-score).
- ARV discount +9.6/15.0
- Cash flow +8.1/30.0
- Schools +4.6/10.0
- Rent growth +3.4/5.0
- Livability +3.0/5.0
- Condition / age +2.5/5.0
- DSCR +2.1/10.0
- 1% rule +1.9/10.0
- Appreciation +0.0/10.0
$312,000
🖨 Deal sheet (PDF) 📄 Offer letter ✓ Due diligence
Listing remarks
Welcome to 3664 W Maya Court in the desirable Metro Verde community! This beautiful 2,034 sq. ft. home features 4 bedrooms, 2 bathrooms, and a versatile flex room. Enjoy stunning coffered and vaulted ceilings, two living areas, and a functional open floor plan. The spacious kitchen offers stainless steel appliances, a large island, and a walk-in pantry. Recent updates include fresh paint, new fixtures, and new carpet. Complete with paid-off solar panels and low-maintenance xeriscape landscaping in the front and back yards, this move-in-ready home is an incredible opportunity with instant equity! Priced to sell. Call Milano today!
Key facts
- Breakfast nook
- Solar
- New paint
Tags
Property features AI
Exterior
- Parking: 2-car garage; Garage door opener
- Utilities: Public water; Natural gas available; Solar
- Home design: Single family residence; One story
- Construction: Brick veneer and stucco exterior; Slab foundation
- Exterior features: Covered patio/porch; Located on a cul-de-sac
Interior
- Kitchen: Dishwasher; Gas cooktop; Microwave
- Bedrooms: Walk-in closet(s) in bedroom(s)
- Bathrooms: 2 full bathrooms
- Heating & cooling: Central air
- Interior features: Kitchen island; Pantry; Walk-in closet(s); Open floorplan; Double pane windows
- Laundry & utility: Gas water heater
Neighborhood map
What this means for you Summary
Snapshot
- This is a 4-bed/2.0-bath single-family listed at $312k.
Deal economics
- At list price, monthly cash flow is $-306 ($-4k/yr) — negative.
- To cash-flow at today's rent, offer at most $258k (17.3% below list).
- To meet the 1% rule (rent ≥ 1% of price), the offer needs to be $215k (31.2% below list).
- Recommended offer: $215k (31.2% below list) — sets the bar for 1% rule.
Location & tenants
- Location reads 59/100 on livability (#120 in NM) — a working-class tenant base; expect higher turnover. Strengths: cost of living A+, housing A; Watch: amenities D+, crime F, commute F.
- Las Cruces Public Schools (urban): math 42% / reading 68% proficiency, ranked #5 of 29 in NM (top 17%) — acceptable for families but not a draw, mixed tenant base, ~2y average lease; 62% free/reduced lunch — lower-income household profile, screen leases tightly.
- Zoned schools: Monte Vista Elementary (718 students, 100% FRL); Mesa Middle (803 students, 100% FRL); Organ Mountain High School (math 32% / reading 62%, grade D-, #56 of 110 statewide, top 50%, 1,980 students, 0% FRL) — zoned schools at 67% FRL track the district average.
- Market conditions: Rents rising (+3.5%/yr); 598 active listings in the ZIP; 11 comparable units currently listed for rent nearby; rentals lingering (median 46d on market — plan ~5-8 weeks vacancy on turnover, expect pricing pressure); 55% of comp listings sitting > 30 days — soft ceiling on asking rent; 964 units permitted in Doña Ana County in 2024 (0 in 5+ unit buildings).
- This rent runs 37% of the median local income ($69k/yr) — at the standard rent-burdened threshold; future hikes will face affordability resistance.
Forward outlook
- Local home prices are declining (-3.0%/yr); year-one equity from $2k of loan paydown is wiped out by about $9k of value loss. Plan a longer hold.
Negotiation context
- It's been on market 46 days — a 3% lower offer ($303k) is reasonable based on typical stale-listing flexibility.
Risks & watch-outs
- Climate carrying-cost: extreme-heat days projected 5→18/yr by 2055 (HVAC capex compounding) — expect insurance premiums to compound above CPI over the hold.
Questions for the listing agent
- What do current leases actually rent for vs. the listed asking? Can we see a recent rent roll and the last 12 months of T-12 income?
- It's been on market 46 days. Have you received any prior offers? Is the seller open to a 31% concession, seller financing, or rate buy-down credit?
- Is there a deadline driving the sale (1031 exchange, divorce, estate, relocation)? That informs how much negotiation room exists.
- Schools are D-rated, which usually means shorter tenancies and higher turnover. Who's the typical renter profile here, and what's been the actual vacancy rate?
- Crime grade is F in this area — have there been break-ins, vandalism, or insurance claims at this property in the last 3 years? What carrier currently insures it and at what premium?
- The area grade is low — what's the realistic commute time and amenity access for the typical tenant pool here? Any planned neighborhood developments (good or bad) we should know about?
- What's the average days-on-market for RENTAL listings here right now (not sales)? A rising rental-DOM trend means longer vacancies and softer asking-rent achievability than the comps imply.
- What's the recent tenant-quality profile in this submarket — average credit score on applications, eviction rate, late-payment / NSF rate, and stable-employment percentage? A property-management company in the area should have these aggregated.
- How much new for-sale + rental construction is in the pipeline within 1–3 miles? Heavy new supply typically softens prices + rents 12–24 months out; constrained supply supports both.
Investment metrics
- 1% rule
- 0.69% ✗
- Cap rate
- 5.12%
- Cash-on-cash
- -4.21%
- DSCR
- 0.81
- GRM
- 12.1
CMA / ARV
- ARV (median comp)
- $327,430
- List price
- $312,000
- Delta
- -4.71%
- Verdict
- FAIR
- Comps
- 2 within 2.0 mi
Projected returns pro-forma
-3.0% appreciation · 3.52% rent growth · sell at horizon
- IRR
- -22.9%
- Equity multiple
- 0.21×
- Total profit
- $-68,993
- Equity at exit
- $46,520
- IRR
- -16.2%
- Equity multiple
- 0.08×
- Total profit
- $-80,762
- Equity at exit
- $26,976
Cash invested: $87,360 (down + closing). Projections, not guarantees.
Landlord ↔ Tenant lean methodology
- Overall (STATE)
- 55 Moderately Landlord-Leaning
- State New Mexico
- 55 Moderately Landlord-Leaning · D+3
- County
- — inherits STATE
- City
- — inherits STATE
ZIP-level market 88012
- Home prices YoY
- -26.2%
- Rents YoY
- 3.5%
- Active inventory
- 598
- Price-to-rent
- 12.1×
Monthly cashflow live
- Estimated rent
- $2,146 high interval (Pro) →
- Mortgage (P&I)
- −$1,636
- Tax from tax record
- −$236 /mo · $2,826/yr
- Insurance
- −$130
- HOA
- −$0
- Vacancy / Maint / Mgmt
- −$451
- Net cashflow
- $-306
Break-even live
Sensitivity live
| Price | -10% $-130 | -5% $-218 | +0% $-306 | +5% $-394 | +10% $-483 |
|---|---|---|---|---|---|
| Rent | -10% $-476 | -5% $-391 | +0% $-306 | +5% $-221 | +10% $-137 |
| Rate | -1.0pp $-149 | -0.5pp $-227 | base $-306 | +0.5pp $-387 | +1.0pp $-469 |
UW: 25.0% down · 7.5% · 30yr · 1.5% tax · 5.0% vac · 8.0% maint · 8.0% mgmt
Financing live
Cash to close
- Down payment
- $78,000
- Closing costs
- $9,360
- Reserves months
- —
- Total cash needed
- —
Loan-product check · same deal, 3 products live
Conventional
25% down · 7.5% · 30yr
- Down + closing
- —
- Monthly P&I
- —
- Monthly cashflow
- —
- DSCR
- —
- Eligible?
- —
Personal DTI + credit; lowest rate.
DSCR
20% down · 8.5% · 30yr
- Down + closing
- —
- Monthly P&I
- —
- Monthly cashflow
- —
- DSCR
- —
- Eligible?
- —
No personal income docs; deal must DSCR.
Hard money
10% down · 12.0% · 12mo
- Down + closing
- —
- Monthly P&I
- —
- Monthly cashflow
- —
- DSCR
- —
- Eligible?
- —
Short-term bridge; refi at stabilization.
Rent comps 11 comps
| Address | Beds | Baths | Sqft | Rent | $/sqft | DOM | Units | Dist |
|---|---|---|---|---|---|---|---|---|
| 3652 Springhaven Loop Las Cruces, NM | 4.0 | 3.0 | 2126 | $2,500 | $1.18 | 15d | 1 | 0.49mi |
| 3575 Sierra del Sol Ave Las Cruces, NM | 3.0 | 2.0 | 1700 | $1,950 | $1.15 | 45d | 1 | 0.58mi |
| 7516 Sierra de Oro Pl Las Cruces, NM | 4.0 | 2.0 | 1549 | $1,895 | $1.22 | 15d | 1 | 0.86mi |
| 7353 Vista de Sobre Dr Las Cruces, NM | 3.0 | 2.0 | 1506 | $1,895 | $1.26 | 45d | 1 | 0.94mi |
| 3833 Ranchers Rd Las Cruces, NM | 3.0 | 2.0 | 1600 | $2,000 | $1.25 | 45d | 1 | 0.95mi |
| 7013 Silver Spur St Las Cruces, NM | 3.0 | 2.5 | 2330 | $2,200 | $0.94 | 23d | 1 | 1.00mi |
| 5015 Emerald St Las Cruces, NM | 3.0 | 2.0 | 1426 | $1,450 | $1.02 | 45d | 1 | 1.22mi |
| 3670 Gem St Las Cruces, NM | 3.0 | 2.0 | 1446 | $1,700 | $1.18 | 45d | 1 | 1.24mi |
| 3350 Longview Ln Las Cruces, NM | 3.0 | 2.0 | 2135 | $1,895 | $0.89 | 45d | 1 | 1.24mi |
| 4025 Boardwalk Rd Las Cruces, NM | 4.0 | 2.5 | 2530 | $2,495 | $0.99 | 23d | 1 | 1.41mi |
| 3860 Las Colinas Dr Las Cruces, NM | 3.0 | 2.5 | 1550 | $1,600 | $1.03 | 23d | 1 | 1.43mi |
Listing history 9 events
-
2026-06-08status $312,000 Pending 46 DOM
-
2026-06-07days on market $312,000 Active 46 DOM
-
2026-06-02days on market $312,000 Active 41 DOM
-
2026-06-01days on market $312,000 Active 40 DOM
-
2026-06-01remarks 637-char remark
-
2026-05-31days on market $312,000 Active 39 DOM
-
2026-05-30days on market $312,000 Active 38 DOM
-
2026-05-05price $314,900 320-char remark
-
2026-04-22$319,000 Active 320-char remark
ⓘ Source: listings_history table (triggers on properties + properties_extension) + one-shot
backfill from property_details.listing_events for pre-trigger history.
Tax reassessment forecast NM · Resets to sale price
- Current annual tax
- $2,826 · $236/mo
- Projected year-2 tax
- $2,826 · $236/mo
- Expected delta
- $0/yr ($0/mo · 0.0%)
ⓘ Screening estimate from a state-policy table — verify with the county assessor before closing.
Climate risk First Street
- Flood 1/10 Low FEMA zone X (unshaded) · 0% chance over 30 yrs
- Wildfire 4/10 Moderate
- Heat 5/10 Major 5 d/yr ≥98°F today · 18 d/yr by 30 yrs out
- Wind 1/10 Low
- Air quality 1/10 Low 0 unhealthy d/yr today · 0 by 30 yrs out
Nearby sold comps map
Loading sold comps map…
Walkable amenities ~0.75 mi
Loading nearby amenities…
Taxation est. · year 1
- Rental income
- $25,754
- − Mortgage interest
- −$17,477
- − Property taxes
- −$2,826
- − Insurance
- −$1,560
- − Repairs & maintenance
- −$2,060
- − Management
- −$2,060
- − Depreciation
- −$9,076
- Taxable loss
- −$9,306
- Est. tax savings @ 24.0%
- +$2,233
- After-tax cash flow
- $-1,441/yr
For passive investors: Depreciation is non-cash, so a rental often shows a tax loss while cash-flowing — sheltering income. Rental losses are passive: they offset passive income freely, and up to $25,000/yr can offset ordinary (W-2) income if you actively participate and your MAGI is under $100k (phasing out to $0 by $150k); unused losses carry forward. On sale, claimed depreciation is recaptured at up to 25%, and gains may owe capital-gains tax (a 1031 exchange can defer both). Figures are a year-1 estimate at your 24.0% rate — not tax advice; consult a CPA.
Schools (NCES district)
- District
- Las Cruces Public Schools
- NCES district ID
- 3501500
- Math proficiency
- 42% ▲ 24.00%
- Reading proficiency
- 68% ▲ 35.00%
- Median HH income
- $41,157
- Composite
- 45.98/100
- National rank
- #2535
- State rank
- #5 of 29 in NM
Livability — Las Cruces
- Score
- 59/100
- State rank
- #120
- US rank
- #19687
Category grades
Schools grade is shown separately in the Schools card above.
Census & demographics
- Census place
- Las Cruces, NM
- County
- Dona Ana County · 144,044 people
- City population
- 131,421
- Metro
- Las Cruces, NM
- Population (ZIP)
- 33,158
- Household income
- $69,052
- Rent vs Own
- Severe rent burden
- 717.0
Population outlook (Doña Ana County) Hauer SSP2
- Today (2025)
- 219,177 people
- By 2030
- 220,967 · +0.8%
- By 2040
- 222,775 · +1.6%
- By 2050
- 223,576 · +2.0%
- By 2075
- 228,461 · +4.2%
- By 2100
- 214,536 · -2.1%
Race, ethnicity, and origin ACS 2023
- Neighborhood character
- Majority Hispanic (63%)
- Race & ethnicity
- Hispanic / Latino 63% White 32% Two or more races 25% Native American 2% Black 1% Asian 1%
- Hispanic origin (detail)
- Mexican 55%
- Common ancestry
- Slovak 2% Russian 1% Iranian 1%
- Foreign-born
- 10% · Canada, South Korea
- Languages at home
- 65% English-only · Spanish 33%
Political lean MEDSL · Doña Ana
- 2024 margin
- Lean D (+9.8) · D 53.8% · R 44.0% · Other 2.2%
- 2008→2024 swing
- -7.9pp toward R · 2008: 17.6pp · 2024: 9.8pp
- All cycles
- 2024: D+9.8 2020: D+18.3 2016: D+18.0 2012: D+14.9 2008: D+17.6
Not yet ingested
- Civics
- —
Market trends
- HPI YoY
- ▼ -66.04%
- Current HPI
- 185.7733
- Rent YoY
- ▲ 3.52%
- Metro
- Las Cruces, NM
- State GDP YoY
- —
- F500 in state
- 0
Price history
-2.2% since first listed4 events — show timeline
- 2026-06-07 Pending — SNMMLS as distributed by MLS GRID
- 2026-05-27 Price Changed $312,000 SNMMLS as distributed by MLS GRID
- 2026-05-05 Price Changed $314,900 SNMMLS as distributed by MLS GRID
- 2026-04-22 Listed $319,000 SNMMLS as distributed by MLS GRID
Property tax history
+28.7%/yrLatest (2025): $2,826 · +2.4% YoY. Source: county tax records.
Cash-flow waterfall
monthlySold comps — $/sqft
last 12 mo · ≤1 miLoading sold comps…