20 Racal Ct Unit A2 · New York, NY
Flood risk 1/10 · Minimal
- FEMA flood zone
- X (unshaded)
- Chance of flooding over 30 yrs
- 0.0%
- Est. flood insurance / yr
- $507 – $1,088
Fire risk 4/10 · Minor
- Est. fire insurance / yr
- $691 – $1,283
Heat risk 8/10 · Major
- Hot days now (above 98°F)
- 7 days/yr
- Hot days in 30 yrs
- 16 days/yr
Wind risk 6/10 · Moderate
- Chance of severe wind over 30 yrs
- 50.0%
Air-quality risk 4/10 · Minor
- Unhealthy air days now
- 5 days/yr
- Unhealthy air days in 30 yrs
- 6 days/yr
Risk factors via First Street. Map © Google.
Why this score? — see what drove the D grade
The composite is a weighted blend of 9 inputs, each scored 0–100. Each bar is that input's sub-score; the figure is the points it added to the 100-point composite (weight × sub-score).
- Cash flow +12.2/30.0
- ARV discount +7.5/15.0
- Schools +5.0/10.0
- Livability +3.8/5.0
- DSCR +3.6/10.0
- Rent growth +3.5/5.0
- 1% rule +2.5/10.0
- Condition / age +2.5/5.0
- Appreciation +0.0/10.0
$399,000
🖨 Deal sheet (PDF) 📄 Offer letter ✓ Due diligence
Listing remarks
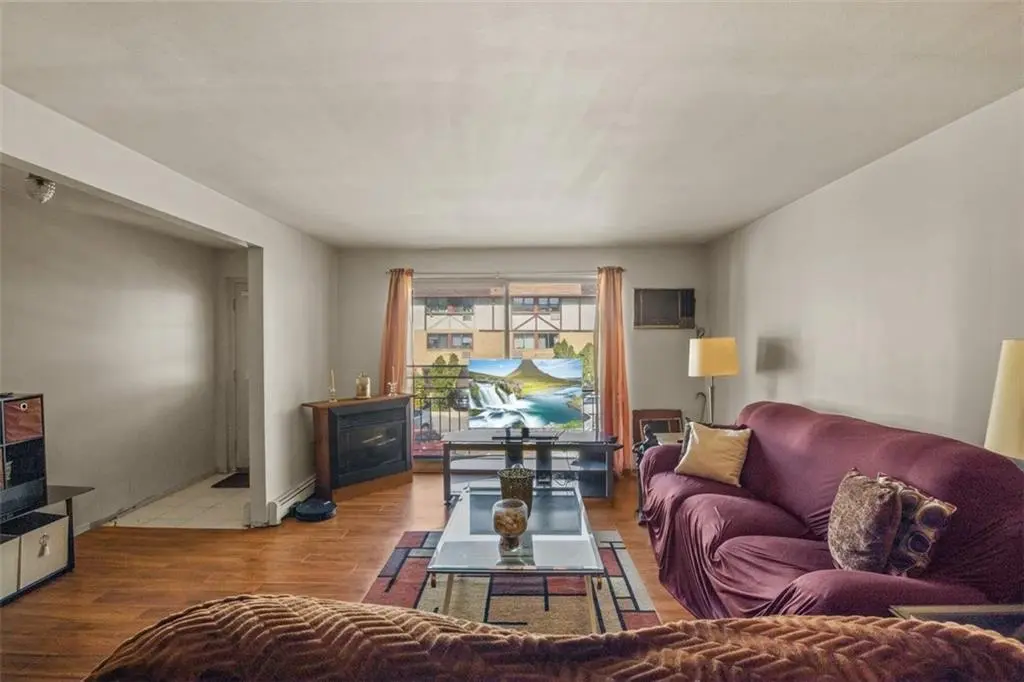
This beautiful 2 bedroom, 1.5 bath is in the heart of New Springville, Staten Island. This condo is in great condition, equip with washer/dryer, storage space, parking, great natural light coming into the front facing living room, & best of all, private balcony. Hardwood floors throughout, with updated appliances to finish. Common backyard area in an amazing New Springville community! Minutes away from the S91, S61, SIM4. Food shopping is a short distance to the S. I Mall Greenmarket. Dave & Busters, Outback Steakhouse, Raymour & Flanigan, AMC Dine-in Cinema, & many dine-in eating establishments. Top rated schools & Hospitals close by. Please contact Michael for
Key facts
- Parking
- Built 1985
- Listed 139 days
Neighborhood map
What this means for you Summary
Snapshot
- This is a 2-bed/1.5-bath condo listed at $399k.
Deal economics
- At list price, monthly cash flow is $-80 ($-959/yr) — negative.
- To cash-flow at today's rent, offer at most $385k (3.5% below list).
- To meet the 1% rule (rent ≥ 1% of price), the offer needs to be $300k (24.8% below list).
- Recommended offer: $300k (24.8% below list) — sets the bar for 1% rule.
- Cap rate 6.1% vs local median 2.6% in New York — top-decile yield for the area; either an underpriced asset or a hidden risk that comps aren't pricing in. Stress-test before assuming the spread holds.
Location & tenants
- Location reads 75/100 on livability (#268 in NY, #4,188 nationally) — a middle-class / working-renter tenant base. Strengths: amenities A+, commute A+, health & safety A; Watch: crime F, cost of living F.
- Market conditions: Rents rising (+3.9%/yr); 490 active listings in the ZIP; solid renter incomes; 480 units permitted in Richmond County in 2024 (22 in 5+ unit buildings).
- This rent runs 34% of the median local income ($105k/yr) — at the standard rent-burdened threshold; future hikes will face affordability resistance.
Forward outlook
- Local home prices are declining (-3.0%/yr); year-one equity from $3k of loan paydown is wiped out by about $12k of value loss. Plan a longer hold.
- Richmond County population projected to shrink 5% by 2050 — rents likely to lag national; underwrite the cash flow, not the appreciation.
Negotiation context
- It's been on market 139 days — a 12% lower offer ($351k) is reasonable based on typical stale-listing flexibility.
- 4 sale attempts since 17y ago with the ask held roughly flat each time — persistent listings suggest the price (not the market) is what's stuck; bring a comps-based counter.
Risks & watch-outs
- Climate carrying-cost: major wind risk, 50% chance of damaging wind over 30y; extreme-heat days projected 7→16/yr by 2055 (HVAC capex compounding) — expect insurance premiums to compound above CPI over the hold.
Questions for the listing agent
- What do current leases actually rent for vs. the listed asking? Can we see a recent rent roll and the last 12 months of T-12 income?
- It's been on market 139 days. Have you received any prior offers? Is the seller open to a 25% concession, seller financing, or rate buy-down credit?
- Any open or pending special assessments — roof, HVAC, plumbing, elevator, façade? What's the per-unit balance and payoff schedule, and is the seller paying it off at close or rolling it to the buyer?
- Why hasn't it sold? Are there any deal-killer items the seller is aware of (foundation, flood, title, zoning, code violations)?
- Is there a deadline driving the sale (1031 exchange, divorce, estate, relocation)? That informs how much negotiation room exists.
- Schools are B-rated — typically a magnet for longer-tenancy family renters. What's the average tenant stay here, and is there a school-zone premium baked into asking?
- Crime grade is F in this area — have there been break-ins, vandalism, or insurance claims at this property in the last 3 years? What carrier currently insures it and at what premium?
- The area grade is low — what's the realistic commute time and amenity access for the typical tenant pool here? Any planned neighborhood developments (good or bad) we should know about?
- What's the average days-on-market for RENTAL listings here right now (not sales)? A rising rental-DOM trend means longer vacancies and softer asking-rent achievability than the comps imply.
- What's the recent tenant-quality profile in this submarket — average credit score on applications, eviction rate, late-payment / NSF rate, and stable-employment percentage? A property-management company in the area should have these aggregated.
- How much new apartment / multifamily construction is in the pipeline within 1–3 miles? Heavy new supply (>2% of stock underway) typically softens rents 12–24 months out; light construction supports rent growth.
Investment metrics
- 1% rule
- 0.75% ✗
- Cap rate
- 6.05%
- Cash-on-cash
- -0.86%
- DSCR
- 0.96
- GRM
- 11.1
CMA / ARV
No comps found within radius.
Projected returns pro-forma
-3.0% appreciation · 3.93% rent growth · sell at horizon
- IRR
- -16.8%
- Equity multiple
- 0.40×
- Total profit
- $-67,055
- Equity at exit
- $59,492
- IRR
- -7.3%
- Equity multiple
- 0.52×
- Total profit
- $-53,685
- Equity at exit
- $34,498
Cash invested: $111,720 (down + closing). Projections, not guarantees.
Landlord ↔ Tenant lean methodology
- Overall (CITY)
- 0 Strongly Tenant-Friendly
- State New York
- 15 Strongly Tenant-Friendly · D+10
- County
- — inherits STATE
- City New York
- 0 Strongly Tenant-Friendly · D+34
ZIP-level market 10314
- Rents YoY
- 3.9%
- Active inventory
- 490
- Price-to-rent
- 11.1×
Monthly cashflow live
- Estimated rent
- $2,999 medium interval (Pro) →
- Mortgage (P&I)
- −$2,092
- Tax from tax record
- −$190 /mo · $2,282/yr
- Insurance
- −$166
- HOA
- −$0
- Vacancy / Maint / Mgmt
- −$630
- Net cashflow
- $-80
Break-even live
Sensitivity live
| Price | -10% $146 | -5% $33 | +0% $-80 | +5% $-193 | +10% $-306 |
|---|---|---|---|---|---|
| Rent | -10% $-317 | -5% $-198 | +0% $-80 | +5% $39 | +10% $157 |
| Rate | -1.0pp $121 | -0.5pp $22 | base $-80 | +0.5pp $-183 | +1.0pp $-288 |
UW: 25.0% down · 7.5% · 30yr · 1.5% tax · 5.0% vac · 8.0% maint · 8.0% mgmt
Financing live
Cash to close
- Down payment
- $99,750
- Closing costs
- $11,970
- Reserves months
- —
- Total cash needed
- —
Loan-product check · same deal, 3 products live
Conventional
25% down · 7.5% · 30yr
- Down + closing
- —
- Monthly P&I
- —
- Monthly cashflow
- —
- DSCR
- —
- Eligible?
- —
Personal DTI + credit; lowest rate.
DSCR
20% down · 8.5% · 30yr
- Down + closing
- —
- Monthly P&I
- —
- Monthly cashflow
- —
- DSCR
- —
- Eligible?
- —
No personal income docs; deal must DSCR.
Hard money
10% down · 12.0% · 12mo
- Down + closing
- —
- Monthly P&I
- —
- Monthly cashflow
- —
- DSCR
- —
- Eligible?
- —
Short-term bridge; refi at stabilization.
HOA detail condo
- Monthly dues
- $0 · $0/yr
- Assessments
- None detected in remarks — confirm with the listing agent.
Listing history 13 events
-
2024-04-11soldstatus $365,000
-
2024-02-05status Pending
-
2024-02-01status Pending
-
2024-01-30historical
-
2023-12-11status Active
-
2023-11-29price $385,000
-
2023-11-29price $385,000
-
2023-10-10status Pending
-
2023-09-22$399,000 Active
-
2023-09-19$399,000 Active
-
2010-07-15historical
-
2009-06-19$274,900
-
1988-07-14soldstatus $138,000
ⓘ Source: listings_history table (triggers on properties + properties_extension) + one-shot
backfill from property_details.listing_events for pre-trigger history.
Tax reassessment forecast NY · Partial reset (capped growth)
- Current annual tax
- $2,282 · $190/mo
- Projected year-2 tax
- $4,513 · $376/mo
- Expected delta
- +$2,230/yr (+$186/mo · 97.7%)
ⓘ Screening estimate from a state-policy table — verify with the county assessor before closing.
Climate risk First Street
- Flood 1/10 Low FEMA zone X (unshaded) · 0% chance over 30 yrs
- Wildfire 4/10 Moderate
- Heat 8/10 Severe 7 d/yr ≥98°F today · 16 d/yr by 30 yrs out
- Wind 6/10 Major 50% chance of damaging wind over 30 yrs
- Air quality 4/10 Moderate 5 unhealthy d/yr today · 6 by 30 yrs out
Nearby sold comps map
Loading sold comps map…
Walkable amenities ~0.75 mi
Loading nearby amenities…
Taxation est. · year 1
- Rental income
- $35,985
- − Mortgage interest
- −$22,350
- − Property taxes
- −$2,282
- − Insurance
- −$1,995
- − Repairs & maintenance
- −$2,879
- − Management
- −$2,879
- − Depreciation
- −$11,607
- Taxable loss
- −$8,008
- Est. tax savings @ 24.0%
- +$1,922
- After-tax cash flow
- $963/yr
For passive investors: Depreciation is non-cash, so a rental often shows a tax loss while cash-flowing — sheltering income. Rental losses are passive: they offset passive income freely, and up to $25,000/yr can offset ordinary (W-2) income if you actively participate and your MAGI is under $100k (phasing out to $0 by $150k); unused losses carry forward. On sale, claimed depreciation is recaptured at up to 25%, and gains may owe capital-gains tax (a 1031 exchange can defer both). Figures are a year-1 estimate at your 24.0% rate — not tax advice; consult a CPA.
Schools (NCES district)
No district data.
Livability — New York
- Score
- 75/100
- State rank
- #268
- US rank
- #4188
Category grades
Schools grade is shown separately in the Schools card above.
Census & demographics
- Census place
- New York, NY
- County
- Richmond County · 404,174 people
- City population
- 7,731,280
- Metro
- New York-Newark-Jersey City, NY-NJ-PA
- Population (ZIP)
- 93,915
- Household income
- $104,613
- Rent vs Own
- Severe rent burden
- 2168.0
Population outlook (Richmond County) Hauer SSP2
- Today (2025)
- 482,784 people
- By 2030
- 481,831 · -0.2%
- By 2040
- 473,159 · -2.0%
- By 2050
- 457,242 · -5.3%
- By 2075
- 408,029 · -15.5%
- By 2100
- 341,459 · -29.3%
Race, ethnicity, and origin ACS 2023
- Neighborhood character
- Diverse neighborhood (Simpson 0.58)
- Race & ethnicity
- White 60% Asian 19% Hispanic / Latino 15% Two or more races 8% Black 4%
- Hispanic origin (detail)
- Mexican 3% Puerto Rican 7% Dominican 1%
- Common ancestry
- Romanian 4% Scotch-Irish 2% Subsaharan African 1%
- Foreign-born
- 28% · Canada, China, South Korea
- Languages at home
- 61% English-only · Spanish 9% Chinese 7% Other Indo-European 7%
Political lean MEDSL · Richmond
- 2024 margin
- Strong R (+29.8) · D 35.1% · R 64.9%
- 2008→2024 swing
- -25.7pp toward R · 2008: -4.0pp · 2024: -29.8pp
- All cycles
- 2024: R+29.8 2020: R+14.9 2016: R+16.8 2012: D+0.8 2008: R+4.0
Not yet ingested
- Civics
- —
Market trends
- HPI YoY
- ▼ -553.73%
- Current HPI
- 378.3872
- Rent YoY
- ▲ 3.93%
- Metro
- New York-Newark-Jersey City, NY-NJ-PA
- State GDP YoY
- ▲ 2.60%
- F500 in state
- 92
Industry mix (Fortune 500 HQ in NY)
| Industry | F500 HQs | Revenue |
|---|---|---|
| Financial Services | 10 | $950B |
|
||
| Consumer Goods | 9 | $162B |
|
||
| Insurance | 4 | $225B |
|
||
| Telecommunications | 2 | $144B |
|
||
| Pharmaceuticals | 2 | $112B |
|
||
| Media / Entertainment | 2 | $69B |
|
||
Price history
+164.5% since first listed13 events — show timeline
- 2024-04-11 Sold (Public Records) $365,000 Public Records
- 2024-02-05 Pending — BNYMLS
- 2024-02-01 Pending — OneKey® MLS as Distributed by MLS Grid
- 2024-01-30 Listing Removed — OneKey® MLS as Distributed by MLS Grid
- 2023-12-11 Relisted — OneKey® MLS as Distributed by MLS Grid
- 2023-11-29 Price Changed $385,000 OneKey® MLS as Distributed by MLS Grid
- 2023-11-29 Price Changed $385,000 RLS at REBNY
- 2023-10-10 Pending — OneKey® MLS as Distributed by MLS Grid
- 2023-09-22 Listed $399,000 OneKey® MLS as Distributed by MLS Grid
- 2023-09-19 Listed $399,000 BNYMLS
- 2010-07-15 Listing Removed — SIBORMLS
- 2009-06-19 Listed $274,900 SIBORMLS
- 1988-07-14 Sold (Public Records) $138,000 Public Records
Property tax history
+5.0%/yrLatest (2025): $2,282 · +0.8% YoY. Source: county tax records.
Cash-flow waterfall
monthlySold comps — $/sqft
last 12 mo · ≤1 miLoading sold comps…