13755 Kenner Ave Unit C · Village St. George, LA
Flood risk 1/10 · Minimal
- FEMA flood zone
- X
- Chance of flooding over 30 yrs
- 0.0%
- Est. flood insurance / yr
- $507 – $1,088
Fire risk 1/10 · Minimal
- Est. fire insurance / yr
- $1,269 – $2,357
Heat risk 8/10 · Major
- Hot days now (above 108°F)
- 7 days/yr
- Hot days in 30 yrs
- 22 days/yr
Wind risk 9/10 · Severe
- Chance of severe wind over 30 yrs
- 99.0%
Air-quality risk 3/10 · Minor
- Unhealthy air days now
- 3 days/yr
- Unhealthy air days in 30 yrs
- 3 days/yr
Risk factors via First Street. Map © Google.
Why this score? — see what drove the C- grade
The composite is a weighted blend of 9 inputs, each scored 0–100. Each bar is that input's sub-score; the figure is the points it added to the 100-point composite (weight × sub-score).
- Cash flow +21.2/30.0
- 1% rule +6.9/10.0
- DSCR +6.8/10.0
- ARV discount +5.5/15.0
- Rent growth +2.7/5.0
- Livability +2.5/5.0
- Condition / age +2.5/5.0
- Schools +2.4/10.0
- Appreciation +0.0/10.0
$99,000
🖨 Deal sheet 📄 Offer letter ✓ Due diligence
Listing remarks MLS
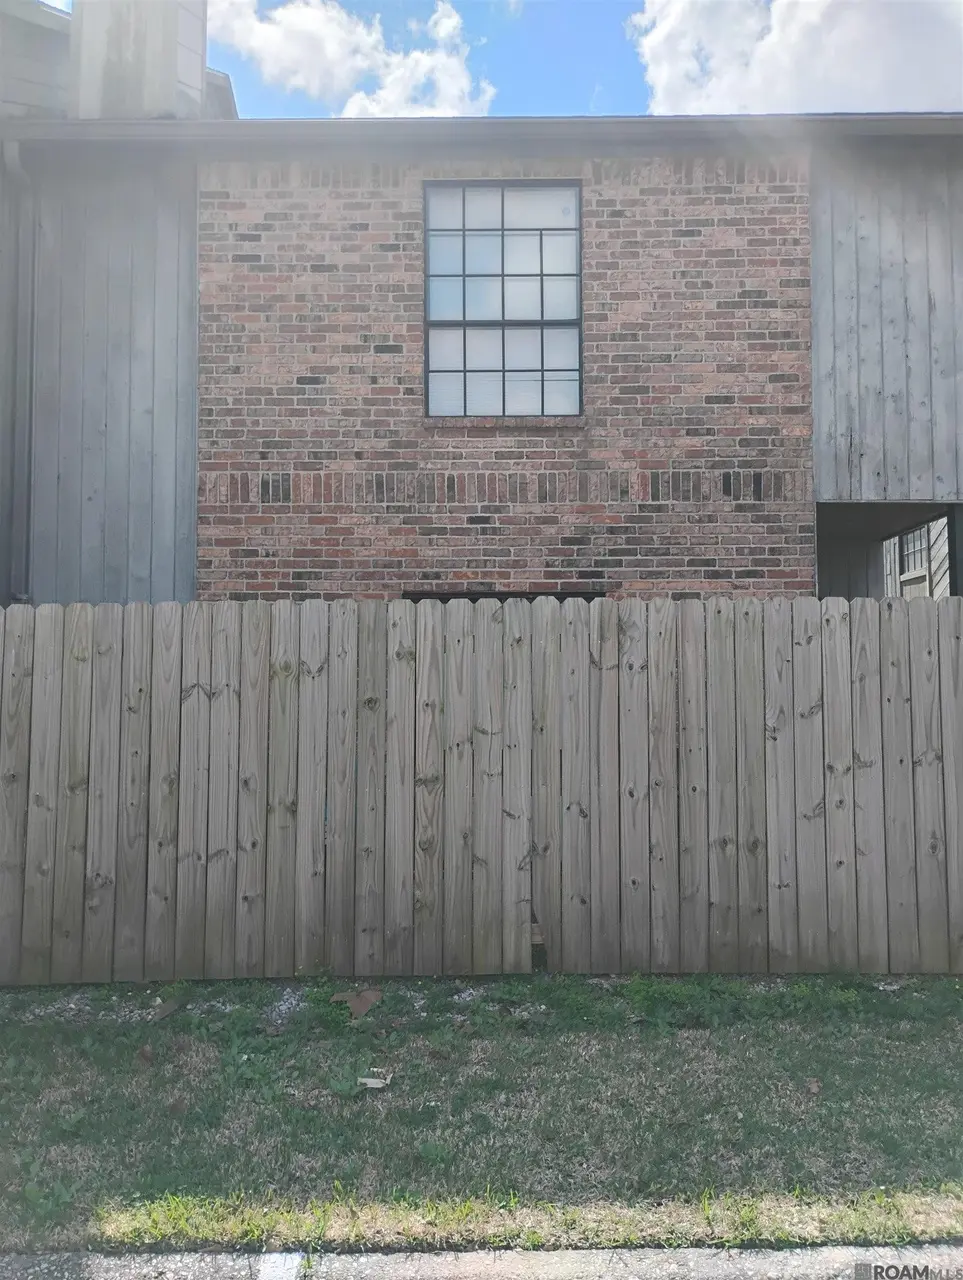
Conveniently located close to shopping, dining and everyday essentials, this desirable 2 Bedroom, 2.5 Bath offers comfort and functionality. The half bath is located downstairs, perfect for guest. The inviting living room features a cozy fireplace, creating a warm and welcoming atmosphere. Step outside to enjoy fenced in patio-ideal for relaxing or entertaining. Do not disturb tenants. Measurements are not warranted by realtor
Key facts
- Inviting living room
- Cozy fireplace
- Fenced in patio
Tags
Neighborhood map
What this means for you Summary
Snapshot
- This is a 2-bed/2.5-bath condo listed at $99k.
Deal economics
- At list price, monthly cash flow is $143 ($2k/yr) — positive.
- The deal already cash-flows at list — no discount required.
- Meets the 1% rule at list price ($1k rent vs $99k).
- Recommended offer: $90k (9.0% below list) — sets the bar for market timing.
- Cap rate 8.0% vs local median 3.9% in Village St. George — top-decile yield for the area; either an underpriced asset or a hidden risk that comps aren't pricing in. Stress-test before assuming the spread holds.
Location & tenants
- Location reads: area grade C — affects rentability + tenant quality, not the cash-flow math above.
- East Baton Rouge Parish (urban): math 22% / reading 34% proficiency, ranked #47 of 98 in LA (top 48%) — low school quality limits family demand, transient renter base, plan for 1-2y turnover; 77% free/reduced lunch — lower-income household profile, screen leases tightly.
- Market conditions: Rents flat; 625 active listings in the ZIP; 13 comparable units currently listed for rent nearby; rentals lingering (median 44d on market — plan ~5-8 weeks vacancy on turnover, expect pricing pressure); 62% of comp listings sitting > 30 days — soft ceiling on asking rent; solid renter incomes; 2,252 units permitted in East Baton Rouge Parish in 2024 (440 in 5+ unit buildings).
- This rent is only 15% of the median local income ($92k/yr) — well below the 30% rent-burden line; pricing power to push rent on renewal without tenant pushback.
Forward outlook
- Local home prices are declining (-3.0%/yr); year-one equity from $684 of loan paydown is wiped out by about $3k of value loss. Plan a longer hold.
- East Baton Rouge County population projected at +4% by 2050 — modest demand growth; plan on rents tracking national, not racing it.
Negotiation context
- It's been on market 104 days — a 9% lower offer ($90k) is reasonable based on typical stale-listing flexibility.
- 5 sale attempts since 2y ago with the ask held roughly flat each time — persistent listings suggest the price (not the market) is what's stuck; bring a comps-based counter.
Risks & watch-outs
- Climate carrying-cost: severe wind risk, 99% chance of damaging wind over 30y; extreme-heat days projected 7→22/yr by 2055 (HVAC capex compounding) — expect insurance premiums to compound above CPI over the hold.
Questions for the listing agent
- It's been on market 104 days. Have you received any prior offers? Is the seller open to a 9% concession, seller financing, or rate buy-down credit?
- What does the HOA fee cover, when was the last increase, and are there any pending special assessments or reserve-fund shortfalls?
- Any open or pending special assessments — roof, HVAC, plumbing, elevator, façade? What's the per-unit balance and payoff schedule, and is the seller paying it off at close or rolling it to the buyer?
- Why hasn't it sold? Are there any deal-killer items the seller is aware of (foundation, flood, title, zoning, code violations)?
- Is there a deadline driving the sale (1031 exchange, divorce, estate, relocation)? That informs how much negotiation room exists.
- What's the average days-on-market for RENTAL listings here right now (not sales)? A rising rental-DOM trend means longer vacancies and softer asking-rent achievability than the comps imply.
- What's the recent tenant-quality profile in this submarket — average credit score on applications, eviction rate, late-payment / NSF rate, and stable-employment percentage? A property-management company in the area should have these aggregated.
- How much new apartment / multifamily construction is in the pipeline within 1–3 miles? Heavy new supply (>2% of stock underway) typically softens rents 12–24 months out; light construction supports rent growth.
Investment metrics
- 1% rule
- 1.19% ✓
- Cap rate
- 8.03%
- Cash-on-cash
- 6.21%
- DSCR
- 1.28
- GRM
- 7.0
CMA / ARV
- ARV (median comp)
- $94,734
- List price
- $99,000
- Delta
- 4.50%
- Verdict
- FAIR
- Comps
- 13 within 1.0 mi
Projected returns pro-forma
-3.0% appreciation · 0.68% rent growth · sell at horizon
- IRR
- -9.6%
- Equity multiple
- 0.66×
- Total profit
- $-9,522
- Equity at exit
- $14,761
- IRR
- -4.2%
- Equity multiple
- 0.76×
- Total profit
- $-6,756
- Equity at exit
- $8,560
Cash invested: $27,720 (down + closing). Projections, not guarantees.
Landlord ↔ Tenant lean methodology
- Overall (STATE)
- 90 Strongly Landlord-Friendly
- State Louisiana
- 90 Strongly Landlord-Friendly · R+12
- County
- — inherits STATE
- City
- — inherits STATE
ZIP-level market 70810
- Rents YoY
- 0.7%
- Active inventory
- 625
- Price-to-rent
- 7.0×
Monthly cashflow live
- Estimated rent
- $1,182 high interval (Pro) →
- Mortgage (P&I)
- −$519
- Tax from tax record
- −$80 /mo · $960/yr
- Insurance
- −$41
- HOA
- −$150
- Vacancy / Maint / Mgmt
- −$248
- Net cashflow
- $143
Break-even live
UW: 25.0% down · 7.5% · 30yr · 1.5% tax · 5.0% vac · 8.0% maint · 8.0% mgmt
Financing live
Cash to close
- Down payment
- $24,750
- Closing costs
- $2,970
- Reserves months
- —
- Total cash needed
- —
Loan-product check · same deal, 3 products live
Conventional
25% down · 7.5% · 30yr
- Down + closing
- —
- Monthly P&I
- —
- Monthly cashflow
- —
- DSCR
- —
- Eligible?
- —
Personal DTI + credit; lowest rate.
DSCR
20% down · 8.5% · 30yr
- Down + closing
- —
- Monthly P&I
- —
- Monthly cashflow
- —
- DSCR
- —
- Eligible?
- —
No personal income docs; deal must DSCR.
Hard money
10% down · 12.0% · 12mo
- Down + closing
- —
- Monthly P&I
- —
- Monthly cashflow
- —
- DSCR
- —
- Eligible?
- —
Short-term bridge; refi at stabilization.
Rent comps 13 comps
| Address | Beds | Baths | Sqft | Rent | $/sqft | DOM | Units | Dist |
|---|---|---|---|---|---|---|---|---|
| 13650 Kenner Ave Unit 13650A Baton Rouge, LA | 2.0 | 2.5 | 1175 | $975 | $0.83 | 43d | 1 | 0.06mi |
| 13621 Kenner Ave Unit 13621D Baton Rouge, LA | 2.0 | 2.5 | 1175 | $975 | $0.83 | 23d | 1 | 0.08mi |
| 13610 Kenner Ave Unit 13610D Baton Rouge, LA | 2.0 | 2.5 | 1175 | $975 | $0.83 | 43d | 1 | 0.10mi |
| 8933 Baronne Dr Baton Rouge, LA | 3.0 | 2.0 | 1386 | $1,450 | $1.05 | 43d | 1 | 0.40mi |
| 7317 Meadow Park Ave Baton Rouge, LA | 3.0 | 2.0 | 1251 | $1,600 | $1.28 | 43d | 1 | 0.42mi |
| 7047 Meadow Park Avennue Baton Rouge, LA | 3.0 | 2.0 | 1100 | $1,150 | $1.05 | 43d | 1 | 0.47mi |
| 8363 Siegen Ln Baton Rouge, LA | 1.0–3.0 | 1.0–1.5 | 741 | $1,056 | $1.43 | 14d | 4 | 0.56mi |
| 1345 Bullrush Dr Baton Rouge, LA | 3.0 | 2.0 | 1294 | $1,800 | $1.39 | 14d | 1 | 0.75mi |
| 9645 Siegen Ln Baton Rouge, LA | 2.0 | 2.0 | 1100 | $1,350 | $1.23 | 43d | 1 | 0.86mi |
| 9849 Siegen Ln Baton Rouge, LA | 2.0 | 2.5 | 1260 | $1,575 | $1.25 | 14d | 1 | 0.97mi |
| 9843 Siegen Ln Baton Rouge, LA | 2.0 | 2.5 | 1225 | $1,500 | $1.22 | 43d | 1 | 0.98mi |
| 1741 Twisted Oak Ln Baton Rouge, LA | 3.0 | 2.0 | 1368 | $1,825 | $1.33 | 43d | 1 | 1.17mi |
| 11580 Perkins Rd Baton Rouge, LA | 1.0–2.0 | 1.0–2.0 | 1000 | $1,392 | $1.39 | 14d | 11 | 1.29mi |
HOA detail condo
- Monthly dues
- $150 · $1,800/yr
- Assessments
- None detected in remarks — confirm with the listing agent.
Listing history 22 events
-
2026-06-18days on market $99,000 Active 104 DOM
-
2026-06-17days on market $99,000 Active 103 DOM
-
2026-06-16days on market $99,000 Active 102 DOM
-
2026-06-15days on market $99,000 Active 101 DOM
-
2026-06-14days on market $99,000 Active 99 DOM
-
2026-06-10days on market $99,000 Active 96 DOM
-
2026-06-09days on market $99,000 Active 95 DOM
-
2026-06-08days on market $99,000 Active 94 DOM
-
2026-06-07days on market $99,000 Active 93 DOM
-
2026-06-05days on market $99,000 Active 90 DOM
-
2026-06-03days on market $99,000 Active 89 DOM
-
2026-06-02days on market $99,000 Active 88 DOM
-
2026-06-01days on market $99,000 Active 87 DOM
-
2026-05-31days on market $99,000 Active 86 DOM
-
2026-05-31days on market $99,000 Active 85 DOM
-
2026-04-26status Active 430-char remark
Show marketing remark (430 chars)
Conveniently located close to shopping, dining and everyday essentials, this desirable 2 Bedroom, 2.5 Bath offers comfort and functionality. The half bath is located downstairs, perfect for guest. The inviting living room features a cozy fireplace, creating a warm and welcoming atmosphere. Step outside to enjoy fenced in patio-ideal for relaxing or entertaining. Do not disturb tenants. Measurements are not warranted by realtor
-
2026-03-05$99,000 Active 430-char remark
Show marketing remark (430 chars)
Conveniently located close to shopping, dining and everyday essentials, this desirable 2 Bedroom, 2.5 Bath offers comfort and functionality. The half bath is located downstairs, perfect for guest. The inviting living room features a cozy fireplace, creating a warm and welcoming atmosphere. Step outside to enjoy fenced in patio-ideal for relaxing or entertaining. Do not disturb tenants. Measurements are not warranted by realtor
-
2024-10-18soldstatus Sold
-
2024-09-25status Pending
-
2024-09-20$75,000 Active
-
2024-09-20$75,000
ⓘ Source: listings_history table (triggers on properties + properties_extension) + one-shot
backfill from property_details.listing_events for pre-trigger history.
Tax reassessment forecast LA · Resets to sale price
- Current annual tax
- $960 · $80/mo
- Projected year-2 tax
- $960 · $80/mo
- Expected delta
- $0/yr ($0/mo · 0.0%)
ⓘ Screening estimate from a state-policy table — verify with the county assessor before closing.
Climate risk First Street
- Flood 1/10 Low FEMA zone X · 0% chance over 30 yrs
- Wildfire 1/10 Low
- Heat 8/10 Severe 7 d/yr ≥108°F today · 22 d/yr by 30 yrs out
- Wind 9/10 Extreme 99% chance of damaging wind over 30 yrs
- Air quality 3/10 Moderate 3 unhealthy d/yr today · 3 by 30 yrs out
Nearby sold comps map
Loading sold comps map…
Walkable amenities ~0.75 mi
Loading nearby amenities…
Taxation est. · year 1
- Rental income
- $14,185
- − Mortgage interest
- −$5,546
- − Property taxes
- −$960
- − Insurance
- −$495
- − Repairs & maintenance
- −$1,135
- − Management
- −$1,135
- − HOA
- −$1,800
- − Depreciation
- −$2,880
- Taxable income
- $235
- Est. tax owed @ 24.0%
- −$56
- After-tax cash flow
- $1,665/yr
For passive investors: Depreciation is non-cash, so a rental often shows a tax loss while cash-flowing — sheltering income. Rental losses are passive: they offset passive income freely, and up to $25,000/yr can offset ordinary (W-2) income if you actively participate and your MAGI is under $100k (phasing out to $0 by $150k); unused losses carry forward. On sale, claimed depreciation is recaptured at up to 25%, and gains may owe capital-gains tax (a 1031 exchange can defer both). Figures are a year-1 estimate at your 24.0% rate — not tax advice; consult a CPA.
Schools (NCES district)
- District
- East Baton Rouge Parish
- NCES district ID
- 2200540
- Math proficiency
- 22% ▼ -36.00%
- Reading proficiency
- 34% ▼ -31.00%
- Median HH income
- $46,263
- Composite
- 24.14/100
- National rank
- #7745
- State rank
- #47 of 98 in LA
Livability — Village St. George
No livability data for this city. (Only ~50 U.S. cities are tracked.)
Census & demographics
- Census place
- Village St. George, LA
- County
- East Baton Rouge Parish · 399,686 people
- Metro
- Baton Rouge, LA
- Population (ZIP)
- 42,659
- Household income
- $92,098
- Rent vs Own
- Severe rent burden
- 1106.0
Population outlook (East Baton Rouge County) Hauer SSP2
- Today (2025)
- 464,810 people
- By 2030
- 472,137 · +1.6%
- By 2040
- 480,243 · +3.3%
- By 2050
- 484,422 · +4.2%
- By 2075
- 492,069 · +5.9%
- By 2100
- 476,347 · +2.5%
Race, ethnicity, and origin ACS 2023
- Neighborhood character
- Diverse neighborhood (Simpson 0.60)
- Race & ethnicity
- White 55% Black 29% Hispanic / Latino 7% Two or more races 6% Asian 6%
- Hispanic origin (detail)
- Mexican 1%
- Common ancestry
- Lithuanian 11% Slovak 2% Scottish 1%
- Foreign-born
- 9% · Canada, China, South Korea
- Languages at home
- 89% English-only · Spanish 4% Other Indo-European 2% Chinese 1%
Political lean MEDSL · East Baton Rouge
- 2024 margin
- D (+11.1) · D 54.5% · R 43.4% · Other 2.1%
- 2008→2024 swing
- +8.9pp toward D · 2008: 2.2pp · 2024: 11.1pp
- All cycles
- 2024: D+11.1 2020: D+13.1 2016: D+9.2 2012: D+5.2 2008: D+2.2
Not yet ingested
- Civics
- —
Market trends
- HPI YoY
- ▼ -117.55%
- Current HPI
- 172.7593
- Rent YoY
- ▲ 0.68%
- Metro
- Baton Rouge, LA
- State GDP YoY
- ▲ 3.29%
- F500 in state
- 10
Industry mix (Fortune 500 HQ in LA)
| Industry | F500 HQs | Revenue |
|---|---|---|
| Telecommunications | 2 | $23B |
|
||
| Utilities | 1 | $12B |
|
||
| Wholesale / Distribution | 1 | $5B |
|
||
| Advertising | 1 | $2B |
|
||
Price history
+32.0% since first listed7 events — show timeline
- 2026-04-26 Relisted — GBRMLS
- 2026-03-05 Listed $99,000 AcadianaMLS
- 2026-03-05 Listed $99,000 GBRMLS
- 2024-10-18 Sold (MLS) — GBRMLS
- 2024-09-25 Pending — GBRMLS
- 2024-09-20 Listed $75,000 AcadianaMLS
- 2024-09-20 Listed $75,000 GBRMLS
Property tax history
+2.7%/yrLatest (2025): $960 · -0.5% YoY. Source: county tax records.
Cash-flow waterfall
monthlySold comps — $/sqft
last 12 mo · ≤1 miLoading sold comps…