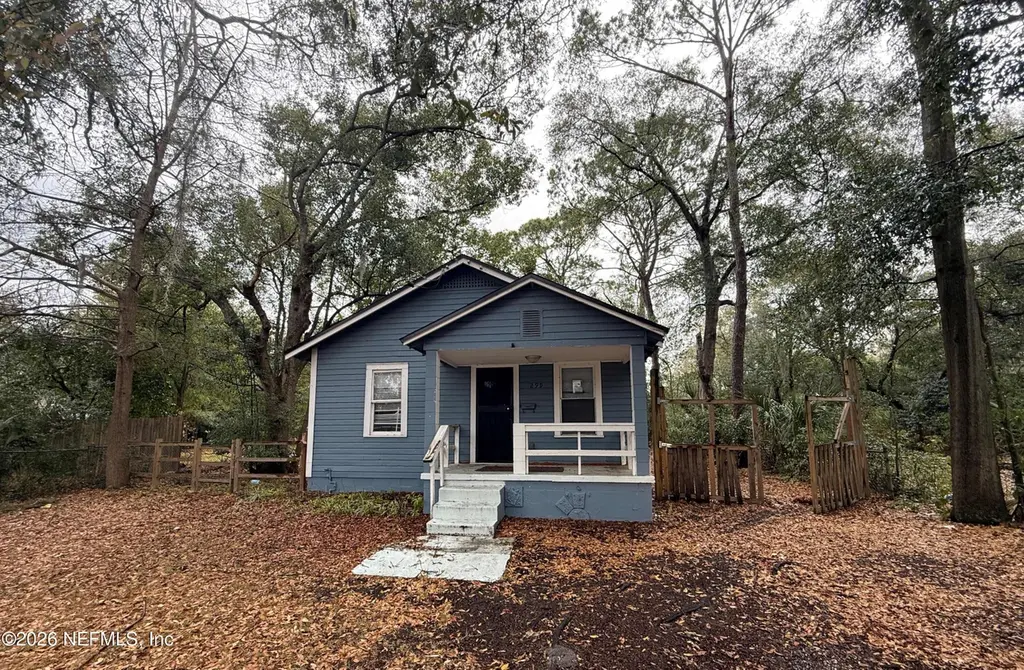
299 E 48th St · Jacksonville, FL
Flood risk 1/10 · Minimal
- FEMA flood zone
- X (unshaded)
- Chance of flooding over 30 yrs
- 0.0%
- Est. flood insurance / yr
- $507 – $1,088
Fire risk 1/10 · Minimal
- Est. fire insurance / yr
- $947 – $1,759
Heat risk 9/10 · Severe
- Hot days now (above 107°F)
- 7 days/yr
- Hot days in 30 yrs
- 20 days/yr
Wind risk 9/10 · Severe
- Chance of severe wind over 30 yrs
- 99.0%
Air-quality risk 4/10 · Minor
- Unhealthy air days now
- 6 days/yr
- Unhealthy air days in 30 yrs
- 6 days/yr
Risk factors via First Street. Map © Google.
Why this score? — see what drove the B+ grade
The composite is a weighted blend of 9 inputs, each scored 0–100. Each bar is that input's sub-score; the figure is the points it added to the 100-point composite (weight × sub-score).
- Cash flow +30.0/30.0
- ARV discount +15.0/15.0
- 1% rule +10.0/10.0
- DSCR +10.0/10.0
- Livability +4.2/5.0
- Schools +3.9/10.0
- Condition / age +2.5/5.0
- Rent growth +2.2/5.0
- Appreciation +0.0/10.0
$64,900
🖨 Deal sheet 📄 Offer letter ✓ Due diligence
Listing remarks MLS
**HIGHEST AND BEST OFFERS DUE BY 5PM ON 02/19/2026***PERFECT STARTER HOME! Bright and spacious this 2 bedroom, 1 full bath home features recent updates to kitchen and bath, vinyl flooring throughout and a kitchen that is open to the living/dining room. Property is being sold ''As-Is'' with the right to inspect. Seller will make no repairs. seller will not pay for or provide survey. This property may qualify for Seller Financing(Vendee). if property was built prior to 1978, Lead Based Paint Potentially exists. Please see attachments for additional offer instructions.
Key facts
- 0.23 acre lot
- Built 1938
- Listed 46 days
Property features AI
Exterior
- Parking: Off-street parking
- Utilities: Cable available; Electricity available; Sewer available; Water available
- Home design: Single family residence
- Construction: Frame construction; Shingle roof
- Exterior features: Front porch; Back yard fencing; Shed(s) on the property; City street frontage; Asphalt road surface
Interior
- Bedrooms: 2 bedrooms
- Flooring: Laminate
- Bathrooms: 1 full bathroom
- Heating & cooling: Electric heating; No central cooling
- Interior features: Laminate flooring; Other appliances
- Laundry & utility: In-unit laundry with washer hookup and electric dryer hookup
Neighborhood map
What this means for you Summary
Snapshot
- This is a 2-bed/1.0-bath single-family listed at $65k.
Deal economics
- At list price, monthly cash flow is $345 ($4k/yr) — positive.
- The deal already cash-flows at list — no discount required.
- Meets the 1% rule at list price ($1k rent vs $65k).
- Recommended offer: $63k (3.0% below list) — sets the bar for market timing.
- Cap rate 12.7% vs local median 4.0% in Jacksonville — top-decile yield for the area; either an underpriced asset or a hidden risk that comps aren't pricing in. Stress-test before assuming the spread holds.
Location & tenants
- Location reads 83/100 on livability (#50 in FL, #911 nationally) — a professional / high-income tenant draw. Strengths: amenities A+, commute A+, housing A+.
- Duval (urban): math 46% / reading 45% proficiency, ranked #48 of 73 in FL (top 66%) — families likely to look elsewhere, expect single-tenant / working-renter base with shorter leases.
- Market conditions: Rents soft (-1.4%/yr); 291 active listings in the ZIP; 40 comparable units currently listed for rent nearby; rentals at typical pace (median 21d on market — plan ~3-4 weeks tenant-placement turnaround); lower-income renter base — watch delinquency; 6,503 units permitted in Duval County in 2024 (1,131 in 5+ unit buildings).
- This rent runs 34% of the median local income ($41k/yr) — at the standard rent-burdened threshold; future hikes will face affordability resistance.
Forward outlook
- Local home prices are declining (-3.0%/yr); year-one equity from $449 of loan paydown is wiped out by about $2k of value loss. Plan a longer hold.
- Duval County population projected at +19% by 2050 — long-run rental-demand tailwind backs the buy-and-hold thesis.
- At projected returns (-3.0% appreciation + 0.0% rent growth), your $18k cash investment doubles in ~7 years — after that, you're playing with house money.
Negotiation context
- It's been on market 46 days — a 3% lower offer ($63k) is reasonable based on typical stale-listing flexibility.
- 5 sale attempts since 5y ago; this cycle's ask has dropped $10k (13%) from the opening price — seller is motivated, your offer sets the floor, not the list.
Risks & watch-outs
- Watch-outs: property tax is 3.8% of price; built in 1938 — expect roof / HVAC / electrical / plumbing capex.
- Climate carrying-cost: severe wind risk, 99% chance of damaging wind over 30y; extreme-heat days projected 7→20/yr by 2055 (HVAC capex compounding) — expect insurance premiums to compound above CPI over the hold.
Questions for the listing agent
- It's been on market 46 days. Have you received any prior offers? Is the seller open to a 3% concession, seller financing, or rate buy-down credit?
- Built in 1938 — when were the roof, HVAC, electrical panel, plumbing, and water heater last replaced?
- Property tax is high relative to price — has the assessment been appealed recently, and will the sale trigger a re-assessment?
- Is there a deadline driving the sale (1031 exchange, divorce, estate, relocation)? That informs how much negotiation room exists.
- Schools are B-rated — typically a magnet for longer-tenancy family renters. What's the average tenant stay here, and is there a school-zone premium baked into asking?
- What's the average days-on-market for RENTAL listings here right now (not sales)? A rising rental-DOM trend means longer vacancies and softer asking-rent achievability than the comps imply.
- What's the recent tenant-quality profile in this submarket — average credit score on applications, eviction rate, late-payment / NSF rate, and stable-employment percentage? A property-management company in the area should have these aggregated.
- How much new for-sale + rental construction is in the pipeline within 1–3 miles? Heavy new supply typically softens prices + rents 12–24 months out; constrained supply supports both.
Investment metrics
- 1% rule
- 1.80% ✓
- Cap rate
- 12.68%
- Cash-on-cash
- 22.81%
- DSCR
- 2.01
- GRM
- 4.6
CMA / ARV
- ARV (on-the-fly)
- $95,040
- Comps found
- 12
Show comp detail 12 sales within ~0.75 mi
| Address | Dist | Beds/Ba | Sqft | Sold | Price | $/sf | Match |
|---|---|---|---|---|---|---|---|
| 299 E 48th St | 0.00mi | 2/1.0 | 792 (0%) | 1mo | $66,500 | $84 | 99 |
| 238 E 45th St | 0.19mi | 2/1.0 | 784 (-1%) | 18mo | $89,000 | $114 | 74 |
| 617 E 57th St | 0.40mi | 2/1.0 | 772 (-2%) | 7mo | $136,000 | $176 | 71 |
| 81 E 61st St | 0.55mi | 2/1.0 | 848 (+7%) | 6mo | $40,000 | $47 | 57 |
| 7120 Buffalo Ave | 0.63mi | 2/1.0 | 832 (+5%) | 8mo | $141,017 | $169 | 56 |
| 85 W 55th St | 0.47mi | 2/1.0 | 833 (+5%) | 18mo | $100,000 | $120 | 54 |
| 410 Demper Dr | 0.73mi | 2/1.0 | 784 (-1%) | 12mo | $122,500 | $156 | 54 |
| 7503 Wilder Ave | 0.75mi | 2/1.0 | 840 (+6%) | 3mo | $50,300 | $60 | 53 |
| 7106 Buffalo Ave | 0.61mi | 2/1.0 | 832 (+5%) | 15mo | $140,020 | $168 | 51 |
| 7129 Northland St | 0.61mi | 2/2.0 | 684 (-14%) | 1mo | $50,000 | $73 | 44 |
| 235 W 43rd St | 0.64mi | 2/1.0 | 734 (-7%) | 19mo | $160,000 | $218 | 42 |
| 607 E 60th St | 0.57mi | 2/1.0 | 892 (+13%) | 13mo | $53,000 | $59 | 42 |
Match score weights: distance 35% · size 25% · config 20% · recency 20%. Top-matched comps best support the ARV.
Projected returns pro-forma
-3.0% appreciation · 0.0% rent growth · sell at horizon
- IRR
- 11.8%
- Equity multiple
- 1.45×
- Total profit
- $8,164
- Equity at exit
- $9,677
- IRR
- 17.9%
- Equity multiple
- 2.25×
- Total profit
- $22,627
- Equity at exit
- $5,611
Cash invested: $18,172 (down + closing). Projections, not guarantees.
Landlord ↔ Tenant lean methodology
- Overall (STATE)
- 87 Strongly Landlord-Friendly
- State Florida
- 87 Strongly Landlord-Friendly · R+3
- County
- — inherits STATE
- City
- — inherits STATE
ZIP-level market 32208
- Home prices YoY
- -33.6%
- Rents YoY
- -1.4%
- Active inventory
- 291
- Price-to-rent
- 4.6×
Monthly cashflow live
- Estimated rent
- $1,165 high interval (Pro) →
- Mortgage (P&I)
- −$340
- Tax from tax record
- −$208 /mo · $2,493/yr
- Insurance
- −$27
- HOA
- −$0
- Vacancy / Maint / Mgmt
- −$245
- Net cashflow
- $345
Break-even live
UW: 25.0% down · 7.5% · 30yr · 1.5% tax · 5.0% vac · 8.0% maint · 8.0% mgmt
Financing live
Cash to close
- Down payment
- $16,225
- Closing costs
- $1,947
- Reserves months
- —
- Total cash needed
- —
Loan-product check · same deal, 3 products live
Conventional
25% down · 7.5% · 30yr
- Down + closing
- —
- Monthly P&I
- —
- Monthly cashflow
- —
- DSCR
- —
- Eligible?
- —
Personal DTI + credit; lowest rate.
DSCR
20% down · 8.5% · 30yr
- Down + closing
- —
- Monthly P&I
- —
- Monthly cashflow
- —
- DSCR
- —
- Eligible?
- —
No personal income docs; deal must DSCR.
Hard money
10% down · 12.0% · 12mo
- Down + closing
- —
- Monthly P&I
- —
- Monthly cashflow
- —
- DSCR
- —
- Eligible?
- —
Short-term bridge; refi at stabilization.
Rent comps 40 comps
| Address | Beds | Baths | Sqft | Rent | $/sqft | DOM | Units | Dist |
|---|---|---|---|---|---|---|---|---|
| 217 E 48th St Jacksonville, FL | 3.0 | 1.0 | 979 | $1,096 | $1.12 | 10d | 1 | 0.12mi |
| 349 E 45th St Jacksonville, FL | 2.0 | 1.0 | 954 | $1,175 | $1.23 | 7d | 1 | 0.18mi |
| 205 E 44th St Jacksonville, FL | 3.0 | 1.0 | 955 | $1,075 | $1.13 | 21d | 1 | 0.26mi |
| 222 E 43rd St Jacksonville, FL | 2.0 | 1.0 | 840 | $946 | $1.13 | 23d | 1 | 0.32mi |
| 481 E 44th St Jacksonville, FL | 2.0 | 1.0 | 668 | $899 | $1.35 | 23d | 1 | 0.33mi |
| 6701 N Main St Jacksonville, FL | 1.0 | 1.0 | 700 | $950 | $1.36 | 23d | 1 | 0.41mi |
| 92 W 55th St Jacksonville, FL | 2.0 | 1.0 | 624 | $845 | $1.35 | 21d | 1 | 0.45mi |
| 18 W 43rd St Jacksonville, FL | 2.0 | 1.0 | 750 | $795 | $1.06 | 4d | 1 | 0.47mi |
| 41 Tallulah Ave Jacksonville, FL | 3.0 | 1.0 | 1092 | $1,390 | $1.27 | 2d | 1 | 0.49mi |
| 525 E 60th St Jacksonville, FL | 3.0 | 2.0 | 1120 | $1,471 | $1.31 | 23d | 1 | 0.51mi |
| 5035 N Main St Jacksonville, FL | 3.0 | 1.0–2.0 | 816 | $1,181 | $1.45 | 23d | 69 | 0.52mi |
| 141 W 43rd St Jacksonville, FL | 3.0 | 2.0 | 1022 | $1,231 | $1.20 | 3d | 1 | 0.57mi |
| 814 E 60th St Jacksonville, FL | 2.0 | 1.0 | 981 | $1,199 | $1.22 | 1d | 1 | 0.59mi |
| 841 E 60th St Jacksonville, FL | 3.0 | 1.0 | 954 | $1,225 | $1.28 | 23d | 1 | 0.64mi |
| 7140 Buffalo Ave Jacksonville, FL | 2.0 | 1.0 | 832 | $1,321 | $1.59 | 23d | 1 | 0.65mi |
| 319 W 49th St Jacksonville, FL | 2.0 | 1.0 | 977 | $1,200 | $1.23 | 23d | 1 | 0.67mi |
| 7345 Penrose St Jacksonville, FL | 1.0 | 1.0 | 1006 | $685 | $0.68 | 16d | 1 | 0.68mi |
| 425 W 47th St Jacksonville, FL | 3.0 | 1.5 | 1083 | $1,193 | $1.10 | 7d | 1 | 0.73mi |
| 22 W 38th St Jacksonville, FL | 2.0 | 1.0 | 800 | $1,100 | $1.38 | 23d | 1 | 0.73mi |
| 7525 Oakwood St Jacksonville, FL | 3.0 | 1.0 | 945 | $1,375 | $1.46 | 14d | 1 | 0.76mi |
| 8027 Floyd St Jacksonville, FL | 2.0 | 1.5 | 935 | $1,300 | $1.39 | 2d | 1 | 0.78mi |
| 4918 N Pearl St Jacksonville, FL | 2.0 | 1.0 | 850 | $895 | $1.05 | 23d | 1 | 0.80mi |
| 356 Duray Ct Jacksonville, FL | 3.0 | 2.0 | 1070 | $1,425 | $1.33 | 13d | 1 | 0.80mi |
| 562 W 49th St Jacksonville, FL | 3.0 | 1.0 | 1091 | $1,195 | $1.10 | 23d | 1 | 0.83mi |
| 385 Duray Ct Jacksonville, FL | 3.0 | 1.0 | 932 | $1,250 | $1.34 | 19d | 1 | 0.84mi |
| 6460 Lanark Ave Jacksonville, FL | 2.0 | 1.0 | 708 | $1,095 | $1.55 | 23d | 1 | 0.88mi |
| 511 Ivy St Jacksonville, FL | 2.0 | 1.0 | 900 | $995 | $1.11 | 23d | 1 | 0.90mi |
| 609 E 30th St Jacksonville, FL | 2.0 | 2.0 | 818 | $1,138 | $1.39 | 23d | 1 | 0.93mi |
| 5616 Calvin Ave Jacksonville, FL | 3.0 | 1.0 | 1008 | $1,195 | $1.19 | 7d | 1 | 0.97mi |
| 3747 Peachtree St Jacksonville, FL | 3.0 | 2.0 | 1082 | $1,410 | $1.30 | 4d | 1 | 0.97mi |
| 535 W 59th St Jacksonville, FL | 3.0 | 2.0 | 816 | $1,395 | $1.71 | 7d | 1 | 0.98mi |
| 451 Long Branch Blvd Unit 451 Jacksonville, FL | 2.0 | 1.0 | 1000 | $1,350 | $1.35 | 23d | 1 | 0.99mi |
| 5514 Long St Jacksonville, FL | 2.0 | 1.0 | 941 | $1,250 | $1.33 | 1d | 1 | 1.01mi |
| 1305 E 30th St Jacksonville, FL | 2.0 | 1.0 | 859 | $1,150 | $1.34 | 23d | 1 | 1.03mi |
| 7124 Lorain St Jacksonville, FL | 3.0 | 1.0 | 864 | $1,043 | $1.21 | 3d | 1 | 1.07mi |
| 346 W 68th St Jacksonville, FL | 3.0 | 1.0 | 1114 | $1,385 | $1.24 | 4d | 1 | 1.13mi |
| 1125 E 24th St Jacksonville, FL | 2.0 | 1.0 | 914 | $600 | $0.66 | 17d | 1 | 1.14mi |
| 3728 Silver St Jacksonville, FL | 2.0 | 1.0 | 916 | $1,100 | $1.20 | 23d | 1 | 1.14mi |
| 3403 Phoenix Ave Jacksonville, FL | 3.0 | 1.0 | 1002 | $995 | $0.99 | 7d | 1 | 1.16mi |
| 4721 E Castlewood Dr Jacksonville, FL | 3.0 | 1.0 | 1008 | $1,250 | $1.24 | 23d | 1 | 1.17mi |
Listing history 17 events
-
2026-05-14status Pending
-
2026-04-24price $64,900
-
2026-03-25$74,900 Active
-
2026-02-20historical 572-char remark
Show marketing remark (572 chars)
**HIGHEST AND BEST OFFERS DUE BY 5PM ON 02/19/2026***PERFECT STARTER HOME! Bright and spacious this 2 bedroom, 1 full bath home features recent updates to kitchen and bath, vinyl flooring throughout and a kitchen that is open to the living/dining room. Property is being sold ''As-Is'' with the right to inspect. Seller will make no repairs. seller will not pay for or provide survey. This property may qualify for Seller Financing(Vendee). if property was built prior to 1978, Lead Based Paint Potentially exists. Please see attachments for additional offer instructions.
-
2026-02-16$48,500 Active 572-char remark
Show marketing remark (572 chars)
**HIGHEST AND BEST OFFERS DUE BY 5PM ON 02/19/2026***PERFECT STARTER HOME! Bright and spacious this 2 bedroom, 1 full bath home features recent updates to kitchen and bath, vinyl flooring throughout and a kitchen that is open to the living/dining room. Property is being sold ''As-Is'' with the right to inspect. Seller will make no repairs. seller will not pay for or provide survey. This property may qualify for Seller Financing(Vendee). if property was built prior to 1978, Lead Based Paint Potentially exists. Please see attachments for additional offer instructions.
-
2022-08-03soldstatus $162,000
-
2022-07-20soldstatus $162,000 Sold 401-char remark
Show marketing remark (401 chars)
Fully-renovated home ready for a new owner. Amazing opportunity to own this beautifully renovated affordable home. New floors throughout. New kitchen cabinets with granite countertops. Updated electrical and plumbing. Roof 2022. Water Heater 2022. Gorgeous bathroom. Enjoy your cup of coffee on the front porch. Spacious back yard. Dont miss this opportunity to own this move-in ready affordable home.
-
2022-06-19status Pending 401-char remark
Show marketing remark (401 chars)
Fully-renovated home ready for a new owner. Amazing opportunity to own this beautifully renovated affordable home. New floors throughout. New kitchen cabinets with granite countertops. Updated electrical and plumbing. Roof 2022. Water Heater 2022. Gorgeous bathroom. Enjoy your cup of coffee on the front porch. Spacious back yard. Dont miss this opportunity to own this move-in ready affordable home.
-
2022-06-10$159,900 Active 401-char remark
Show marketing remark (401 chars)
Fully-renovated home ready for a new owner. Amazing opportunity to own this beautifully renovated affordable home. New floors throughout. New kitchen cabinets with granite countertops. Updated electrical and plumbing. Roof 2022. Water Heater 2022. Gorgeous bathroom. Enjoy your cup of coffee on the front porch. Spacious back yard. Dont miss this opportunity to own this move-in ready affordable home.
-
2022-03-17soldstatus $65,000 Sold
-
2022-03-02status Pending
-
2022-02-01$79,000 Active
-
2021-01-18historical
-
2021-01-01$58,000 Active
-
2018-03-13soldstatus $851,700
-
1986-09-18soldstatus $2,090
-
1980-11-01soldstatus $17,000
ⓘ Source: listings_history table (triggers on properties + properties_extension) + one-shot
backfill from property_details.listing_events for pre-trigger history.
Tax reassessment forecast FL · Resets to sale price
- Current annual tax
- $2,493 · $208/mo
- Projected year-2 tax
- $2,493 · $208/mo
- Expected delta
- $0/yr ($0/mo · 0.0%)
ⓘ Screening estimate from a state-policy table — verify with the county assessor before closing.
Climate risk First Street
- Flood 1/10 Low FEMA zone X (unshaded) · 0% chance over 30 yrs
- Wildfire 1/10 Low
- Heat 9/10 Extreme 7 d/yr ≥107°F today · 20 d/yr by 30 yrs out
- Wind 9/10 Extreme 99% chance of damaging wind over 30 yrs
- Air quality 4/10 Moderate 6 unhealthy d/yr today · 6 by 30 yrs out
Nearby sold comps map
Loading sold comps map…
Walkable amenities ~0.75 mi
Loading nearby amenities…
Taxation est. · year 1
- Rental income
- $13,983
- − Mortgage interest
- −$3,635
- − Property taxes
- −$2,493
- − Insurance
- −$324
- − Repairs & maintenance
- −$1,119
- − Management
- −$1,119
- − Depreciation
- −$1,888
- Taxable income
- $3,405
- Est. tax owed @ 24.0%
- −$817
- After-tax cash flow
- $3,328/yr
For passive investors: Depreciation is non-cash, so a rental often shows a tax loss while cash-flowing — sheltering income. Rental losses are passive: they offset passive income freely, and up to $25,000/yr can offset ordinary (W-2) income if you actively participate and your MAGI is under $100k (phasing out to $0 by $150k); unused losses carry forward. On sale, claimed depreciation is recaptured at up to 25%, and gains may owe capital-gains tax (a 1031 exchange can defer both). Figures are a year-1 estimate at your 24.0% rate — not tax advice; consult a CPA.
Schools (NCES district)
- District
- Duval
- NCES district ID
- 1200480
- Math proficiency
- 46% ▼ -11.00%
- Reading proficiency
- 45% ▼ -4.00%
- Median HH income
- $48,987
- Composite
- 38.97/100
- National rank
- #4076
- State rank
- #48 of 73 in FL
Livability — Jacksonville
- Score
- 83/100
- State rank
- #50
- US rank
- #911
Category grades
Schools grade is shown separately in the Schools card above.
Census & demographics
- Census place
- Jacksonville, FL
- County
- Duval County · 1,015,274 people
- City population
- 979,034
- Metro
- Jacksonville, FL
- Population (ZIP)
- 32,699
- Household income
- $41,324
- Rent vs Own
- Severe rent burden
- 1765.0
Population outlook (Duval County) Hauer SSP2
- Today (2025)
- 1,013,010 people
- By 2030
- 1,059,228 · +4.6%
- By 2040
- 1,141,439 · +12.7%
- By 2050
- 1,205,258 · +19.0%
- By 2075
- 1,324,282 · +30.7%
- By 2100
- 1,319,620 · +30.3%
Race, ethnicity, and origin ACS 2023
- Neighborhood character
- Predominantly Black (77%)
- Race & ethnicity
- Black 77% White 16% Two or more races 4% Hispanic / Latino 3%
- Common ancestry
- Italian 1%
- Foreign-born
- 2% · Canada
- Languages at home
- 97% English-only · Spanish 2%
Political lean MEDSL · Duval
- 2024 margin
- Toss-up / Even · D 48.7% · R 50.1% · Other 1.2%
- 2008→2024 swing
- +0.4pp no change · 2008: -1.9pp · 2024: -1.5pp
- All cycles
- 2024: R+1.5 2020: D+3.8 2016: R+1.5 2012: R+3.6 2008: R+1.9
Not yet ingested
- Civics
- —
Market trends
- HPI YoY
- ▼ -110.56%
- Current HPI
- 217.9706
- Rent YoY
- ▼ -1.36%
- Metro
- Jacksonville, FL
- State GDP YoY
- ▲ 3.28%
- F500 in state
- 36
Industry mix (Fortune 500 HQ in FL)
| Industry | F500 HQs | Revenue |
|---|---|---|
| Industrial Technology | 2 | $29B |
|
||
| Insurance | 2 | $17B |
|
||
| Retail | 1 | $60B |
|
||
| Technology Distribution | 1 | $58B |
|
||
| Homebuilding | 1 | $35B |
|
||
| Technology Manufacturing | 1 | $35B |
|
||
Price history
+281.8% since first listed17 events — show timeline
- 2026-05-14 Pending — realMLS
- 2026-04-24 Price Changed $64,900 realMLS
- 2026-03-25 Listed $74,900 realMLS
- 2026-02-20 Listing Removed — realMLS
- 2026-02-16 Listed $48,500 realMLS
- 2022-08-03 Sold (Public Records) $162,000 Public Records
- 2022-07-20 Sold (MLS) $162,000 realMLS
- 2022-06-19 Pending — realMLS
- 2022-06-10 Listed $159,900 realMLS
- 2022-03-17 Sold (MLS) $65,000 realMLS
- 2022-03-02 Pending — realMLS
- 2022-02-01 Listed $79,000 realMLS
- 2021-01-18 Listing Removed — realMLS
- 2021-01-01 Listed $58,000 realMLS
- 2018-03-13 Sold (Public Records) $851,700 Public Records
- 1986-09-18 Sold (Public Records) $2,090 Public Records
- 1980-11-01 Sold (Public Records) $17,000 Public Records
Property tax history
+13.0%/yrLatest (2025): $2,493 · +73.8% YoY. Source: county tax records.
Cash-flow waterfall
monthlySold comps — $/sqft
last 12 mo · ≤1 miLoading sold comps…