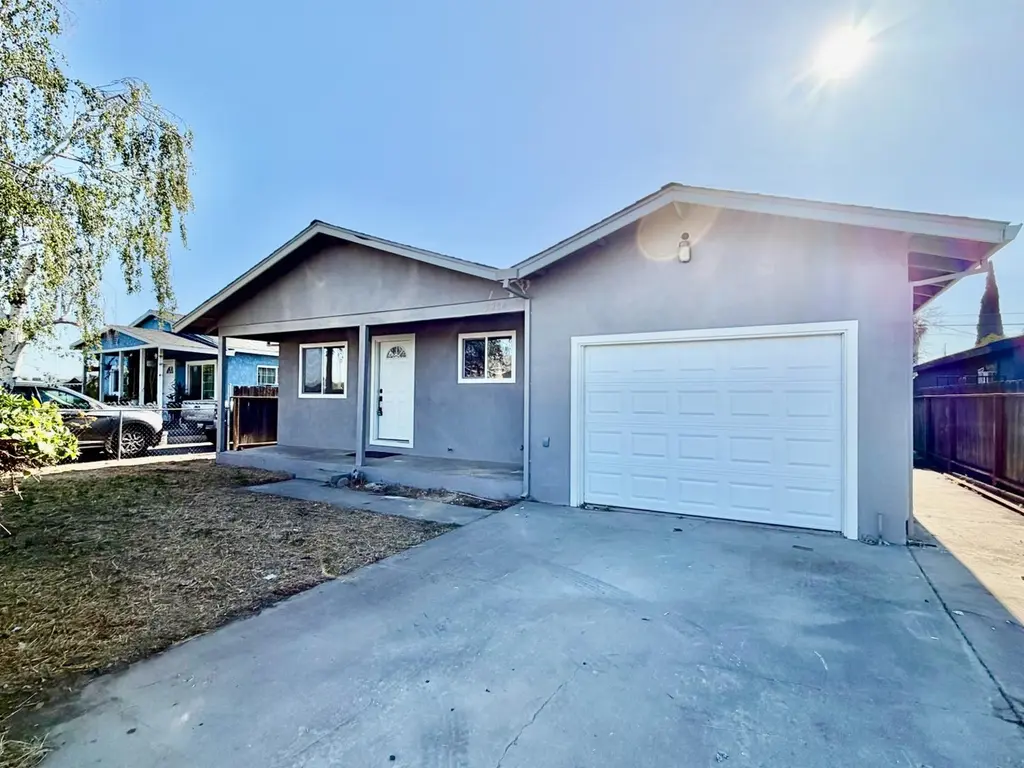
5204 7th St · Keyes, CA
Flood risk 6/10 · Moderate
- FEMA flood zone
- X (unshaded)
- Chance of flooding over 30 yrs
- 0.75%
- Est. flood insurance / yr
- $507 – $1,088
Fire risk 6/10 · Moderate
- Est. fire insurance / yr
- $659 – $1,223
Heat risk 7/10 · Major
- Hot days now (above 102°F)
- 7 days/yr
- Hot days in 30 yrs
- 15 days/yr
Wind risk 1/10 · Minimal
- Chance of severe wind over 30 yrs
- —
Air-quality risk 10/10 · Severe
- Unhealthy air days now
- 34 days/yr
- Unhealthy air days in 30 yrs
- 37 days/yr
Risk factors via First Street. Map © Google.
Why this score? — see what drove the D- grade
The composite is a weighted blend of 9 inputs, each scored 0–100. Each bar is that input's sub-score; the figure is the points it added to the 100-point composite (weight × sub-score).
- Appreciation +10.0/10.0
- Cash flow +7.8/30.0
- ARV discount +5.1/15.0
- Schools +5.0/10.0
- Rent growth +2.5/5.0
- Condition / age +2.5/5.0
- Livability +2.3/5.0
- DSCR +1.8/10.0
- 1% rule +1.1/10.0
$365,000
🖨 Deal sheet 📄 Offer letter ✓ Due diligence
Key facts
- 5,998 sq ft lot
- Garage
- Built 1982
Property features AI
Finance
- HOA & community: No homeowners association; Not a senior community
Exterior
- Parking: Assigned parking; 1-car garage
- Utilities: 220 Volt electric service; Public water; Public sewer; No irrigation
- Home design: Detached single-family residence; Single-story; Built in 1982
- Construction: Shingle roof
- Exterior features: Regular-shaped lot
Interior
- Kitchen: Granite counters
- Bedrooms: 3 bedrooms
- Flooring: Carpet; Laminate; Tile
- Bathrooms: 1 full bathroom with tile and tub/shower combo
- Heating & cooling: Central heating; Central cooling
- Interior features: Living room with a view; Main level includes bedrooms, living room, garage and kitchen
- Laundry & utility: Laundry located in garage
Neighborhood map
What this means for you Summary
Snapshot
- This is a 3-bed/1.0-bath single-family listed at $365k.
Deal economics
- At list price, monthly cash flow is $-413 ($-5k/yr) — negative.
- To cash-flow at today's rent, offer at most $292k (20.0% below list).
- To meet the 1% rule (rent ≥ 1% of price), the offer needs to be $222k (39.2% below list).
- Recommended offer: $222k (39.2% below list) — sets the bar for 1% rule.
- Cap rate 4.9% vs local median 4.0% in Keyes — meaningfully above typical; check what's discounted (condition, days-on-market, listing class) to confirm the premium yield is real.
Location & tenants
- Location reads 46/100 on livability (#1,280 in CA) — a working-class tenant base; expect higher turnover. Strengths: housing A; Watch: schools D, employment D, crime F.
- Market conditions: 17 active listings in the ZIP; 1 comparable units currently listed for rent nearby; 923 units permitted in Stanislaus County in 2024 (63 in 5+ unit buildings).
Forward outlook
- In year one you build about $39k of equity ($3k loan paydown + $36k appreciation (10.0% local appreciation)).
- Stanislaus County population projected at +14% by 2050 — modest demand growth; plan on rents tracking national, not racing it.
- By year 2, paydown + projected appreciation supports a ~$63k cash-out refi (75% LTV) — recoverable capital for the next deal without selling this one.
Negotiation context
- Only 1 days on market — expect competitive offers; lowballing is unlikely to land.
- Current owner paid $195k; list at $365k implies a 87% gain — meaningful room to come down on a strong offer.
Risks & watch-outs
- Climate carrying-cost: major flood risk; major wildfire risk; extreme-heat days projected 7→15/yr by 2055 (HVAC capex compounding) — expect insurance premiums to compound above CPI over the hold.
Questions for the listing agent
- What do current leases actually rent for vs. the listed asking? Can we see a recent rent roll and the last 12 months of T-12 income?
- Is there a deadline driving the sale (1031 exchange, divorce, estate, relocation)? That informs how much negotiation room exists.
- Schools are D-rated, which usually means shorter tenancies and higher turnover. Who's the typical renter profile here, and what's been the actual vacancy rate?
- Crime grade is F in this area — have there been break-ins, vandalism, or insurance claims at this property in the last 3 years? What carrier currently insures it and at what premium?
- The area grade is low — what's the realistic commute time and amenity access for the typical tenant pool here? Any planned neighborhood developments (good or bad) we should know about?
- What's the average days-on-market for RENTAL listings here right now (not sales)? A rising rental-DOM trend means longer vacancies and softer asking-rent achievability than the comps imply.
- What's the recent tenant-quality profile in this submarket — average credit score on applications, eviction rate, late-payment / NSF rate, and stable-employment percentage? A property-management company in the area should have these aggregated.
- How much new for-sale + rental construction is in the pipeline within 1–3 miles? Heavy new supply typically softens prices + rents 12–24 months out; constrained supply supports both.
Investment metrics
- 1% rule
- 0.61% ✗
- Cap rate
- 4.94%
- Cash-on-cash
- -4.85%
- DSCR
- 0.78
- GRM
- 13.7
CMA / ARV
- ARV (on-the-fly)
- $346,368
- Comps found
- 9
Show comp detail 9 sales within ~0.75 mi
| Address | Dist | Beds/Ba | Sqft | Sold | Price | $/sf | Match |
|---|---|---|---|---|---|---|---|
| 4405 Sunset Ter | 0.09mi | 3/2.0 | 1,064 (+8%) | 9mo | $375,000 | $352 | 71 |
| 5320 8th St | 0.17mi | 3/1.0 | 1,044 (+6%) | 16mo | $343,000 | $329 | 68 |
| 4021 Anna Ave | 0.22mi | 2/1.0 (-1) | 1,080 (+10%) | 4mo | $332,500 | $308 | 66 |
| 5463 8th St | 0.36mi | 3/1.0 | 1,021 (+4%) | 20mo | $359,000 | $352 | 60 |
| 5555 10th St | 0.47mi | 3/1.0 | 1,040 (+6%) | 15mo | $340,000 | $327 | 56 |
| 4100 Anna Ave | 0.19mi | 3/1.0 | 1,100 (+12%) | 22mo | $460,000 | $418 | 54 |
| 5020 Fonda Way | 0.55mi | 3/2.0 | 1,040 (+6%) | 11mo | $417,500 | $401 | 52 |
| 3917 Hollywood Dr | 0.46mi | 2/2.0 (-1) | 1,040 (+6%) | 14mo | $405,000 | $389 | 48 |
| 4504 Stella Ave | 0.74mi | 3/2.0 | 1,050 (+7%) | 17mo | $363,600 | $346 | 36 |
Match score weights: distance 35% · size 25% · config 20% · recency 20%. Top-matched comps best support the ARV.
Projected returns pro-forma
10.0% appreciation · 3.0% rent growth · sell at horizon
- IRR
- 20.8%
- Equity multiple
- 2.69×
- Total profit
- $172,305
- Equity at exit
- $328,821
- IRR
- 18.9%
- Equity multiple
- 6.16×
- Total profit
- $527,723
- Equity at exit
- $709,115
Cash invested: $102,200 (down + closing). Projections, not guarantees.
Landlord ↔ Tenant lean methodology
- Overall (STATE)
- 18 Strongly Tenant-Friendly
- State California
- 18 Strongly Tenant-Friendly · D+13
- County
- — inherits STATE
- City
- — inherits STATE
ZIP-level market 95328
- Home prices YoY
- 5.5%
- Active inventory
- 17
- Price-to-rent
- 13.7×
Monthly cashflow live
- Estimated rent
- $2,220 medium interval (Pro) →
- Mortgage (P&I)
- −$1,914
- Tax from tax record
- −$101 /mo · $1,206/yr
- Insurance
- −$152
- HOA
- −$0
- Vacancy / Maint / Mgmt
- −$466
- Net cashflow
- $-413
Break-even live
UW: 25.0% down · 7.5% · 30yr · 1.5% tax · 5.0% vac · 8.0% maint · 8.0% mgmt
Financing live
Cash to close
- Down payment
- $91,250
- Closing costs
- $10,950
- Reserves months
- —
- Total cash needed
- —
Loan-product check · same deal, 3 products live
Conventional
25% down · 7.5% · 30yr
- Down + closing
- —
- Monthly P&I
- —
- Monthly cashflow
- —
- DSCR
- —
- Eligible?
- —
Personal DTI + credit; lowest rate.
DSCR
20% down · 8.5% · 30yr
- Down + closing
- —
- Monthly P&I
- —
- Monthly cashflow
- —
- DSCR
- —
- Eligible?
- —
No personal income docs; deal must DSCR.
Hard money
10% down · 12.0% · 12mo
- Down + closing
- —
- Monthly P&I
- —
- Monthly cashflow
- —
- DSCR
- —
- Eligible?
- —
Short-term bridge; refi at stabilization.
Rent comps 1 comps
| Address | Beds | Baths | Sqft | Rent | $/sqft | DOM | Units | Dist |
|---|---|---|---|---|---|---|---|---|
| 3824 Hollywood Dr Ceres, CA | 3.0 | 2.0 | 1100 | $2,220 | $2.02 | 43d | 1 | 0.50mi |
Listing history 2 events
-
2026-03-24soldstatus $195,000
-
1982-06-01soldstatus $41,000
ⓘ Source: listings_history table (triggers on properties + properties_extension) + one-shot
backfill from property_details.listing_events for pre-trigger history.
Tax reassessment forecast CA · Resets to sale price
- Current annual tax
- $1,206 · $101/mo
- Projected year-2 tax
- $2,774 · $231/mo
- Expected delta
- +$1,568/yr (+$131/mo · 130.0%)
ⓘ Screening estimate from a state-policy table — verify with the county assessor before closing.
Climate risk First Street
- Flood 6/10 Major FEMA zone X (unshaded) · 75% chance over 30 yrs
- Wildfire 6/10 Major
- Heat 7/10 Severe 7 d/yr ≥102°F today · 15 d/yr by 30 yrs out
- Wind 1/10 Low
- Air quality 10/10 Extreme 34 unhealthy d/yr today · 37 by 30 yrs out
Nearby sold comps map
Loading sold comps map…
Walkable amenities ~0.75 mi
Loading nearby amenities…
Taxation est. · year 1
- Rental income
- $26,640
- − Mortgage interest
- −$20,446
- − Property taxes
- −$1,206
- − Insurance
- −$1,825
- − Repairs & maintenance
- −$2,131
- − Management
- −$2,131
- − Depreciation
- −$10,618
- Taxable loss
- −$11,718
- Est. tax savings @ 24.0%
- +$2,812
- After-tax cash flow
- $-2,143/yr
For passive investors: Depreciation is non-cash, so a rental often shows a tax loss while cash-flowing — sheltering income. Rental losses are passive: they offset passive income freely, and up to $25,000/yr can offset ordinary (W-2) income if you actively participate and your MAGI is under $100k (phasing out to $0 by $150k); unused losses carry forward. On sale, claimed depreciation is recaptured at up to 25%, and gains may owe capital-gains tax (a 1031 exchange can defer both). Figures are a year-1 estimate at your 24.0% rate — not tax advice; consult a CPA.
Schools (NCES district)
No district data.
Livability — Keyes
- Score
- 46/100
- State rank
- #1280
- US rank
- #26476
Category grades
Schools grade is shown separately in the Schools card above.
Census & demographics
- Census place
- Keyes, CA
- City population
- 3,939
- Population (ZIP)
- 3,939
Population outlook (Stanislaus County) Hauer SSP2
- Today (2025)
- 579,493 people
- By 2030
- 598,000 · +3.2%
- By 2040
- 630,930 · +8.9%
- By 2050
- 658,300 · +13.6%
- By 2075
- 712,363 · +22.9%
- By 2100
- 719,805 · +24.2%
Race, ethnicity, and origin ACS 2023
- Neighborhood character
- Predominantly Hispanic (71%)
- Race & ethnicity
- Hispanic / Latino 71% Two or more races 33% White 16% Asian 13% Native American 5%
- Hispanic origin (detail)
- Mexican 67% Cuban 3%
- Common ancestry
- Slovak 2% Russian 2%
- Foreign-born
- 32% · Canada
- Languages at home
- 29% English-only · Spanish 60% Other Indo-European 7% Other Asian/Pacific 4%
Political lean MEDSL · Stanislaus
- 2024 margin
- R (+11.0) · D 43.2% · R 54.2% · Other 2.6%
- 2008→2024 swing
- -12.7pp toward R · 2008: 1.7pp · 2024: -11.0pp
- All cycles
- 2024: R+11.0 2020: D+0.8 2016: D+0.6 2012: D+0.7 2008: D+1.7
Not yet ingested
- Civics
- —
Market trends
- HPI YoY
- ▲ 21.97%
- Current HPI
- 418.8737
- Rent YoY
- —
- Metro
- —
- State GDP YoY
- ▲ 3.21%
- F500 in state
- 116
Industry mix (Fortune 500 HQ in CA)
| Industry | F500 HQs | Revenue |
|---|---|---|
| Technology | 27 | $1,492B |
|
||
| Financial Services | 3 | $174B |
|
||
| Retail | 3 | $44B |
|
||
| Insurance | 3 | $26B |
|
||
| Media / Entertainment | 2 | $115B |
|
||
| Pharmaceuticals / Biotech | 2 | $62B |
|
||
Price history
+375.6% since first listed2 events — show timeline
- 2026-03-24 Sold (Public Records) $195,000 Public Records
- 1982-06-01 Sold (Public Records) $41,000 Public Records
Property tax history
+2.9%/yrLatest (2025): $1,206 · +4.1% YoY. Source: county tax records.
Cash-flow waterfall
monthlySold comps — $/sqft
last 12 mo · ≤1 miLoading sold comps…